• Panoramica
  • Recensioni
  • Commenti

Smarter Support and Resistance

Indicatore di Supporto e Resistenza Intelligente

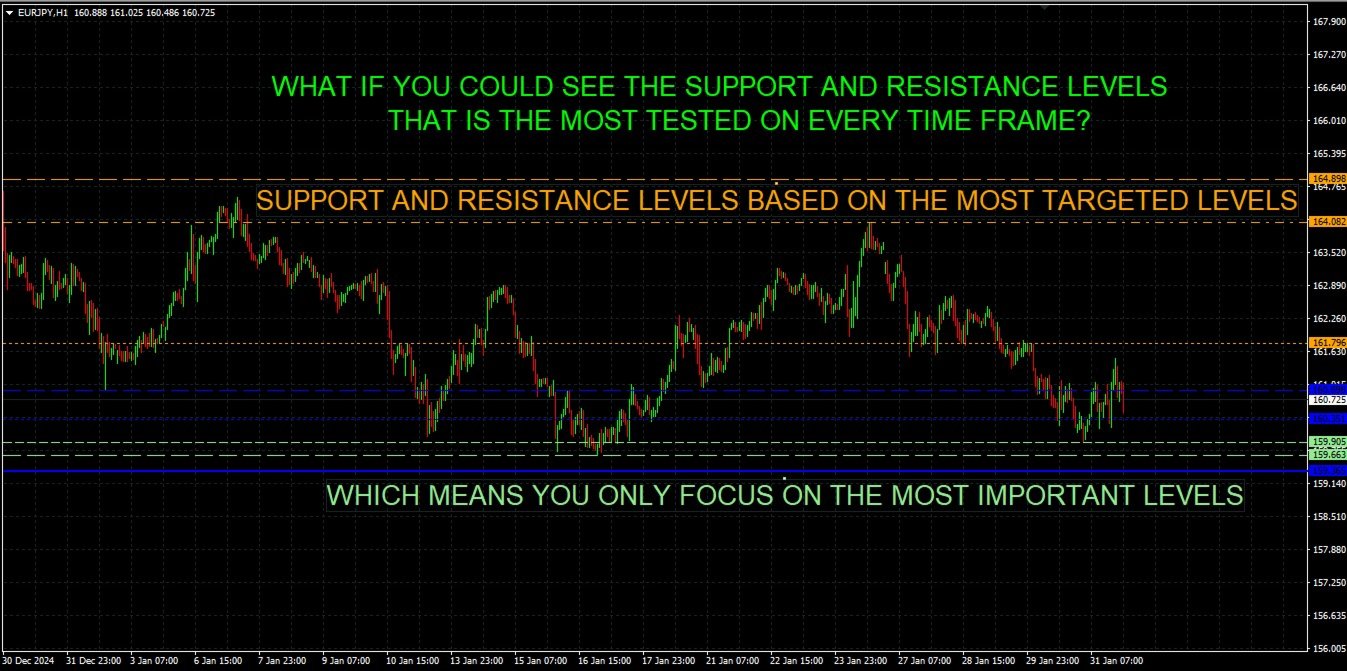
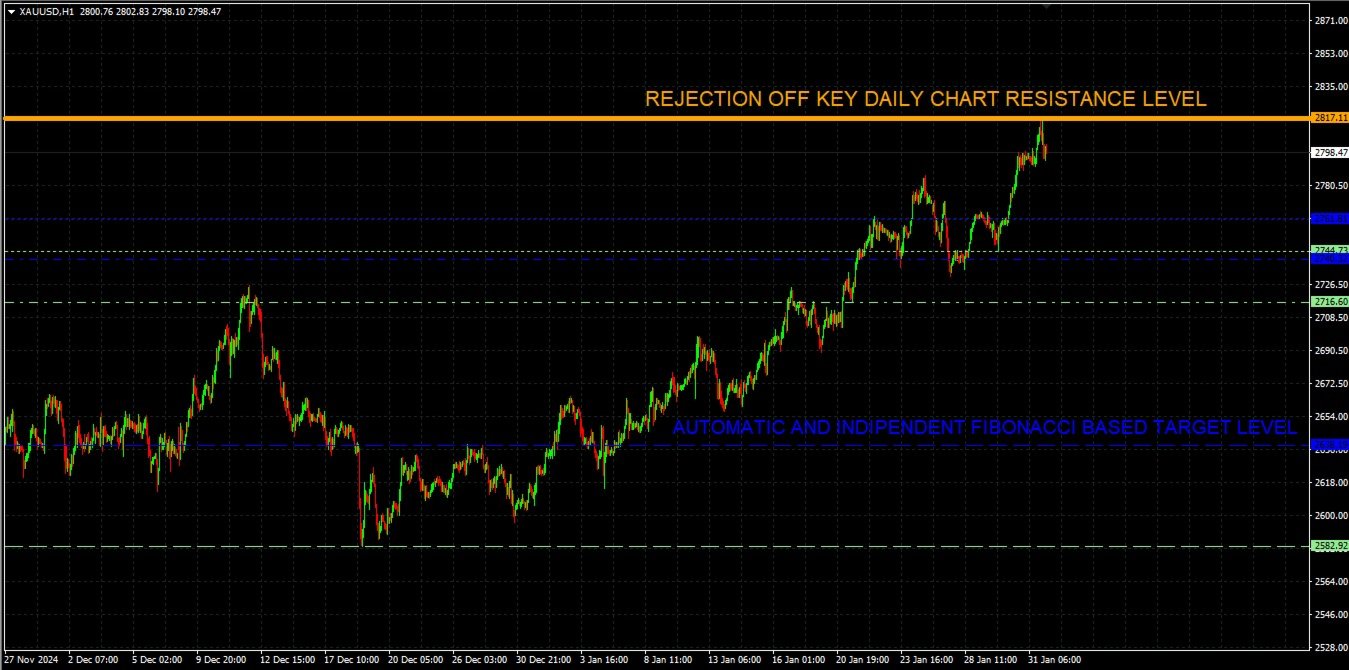
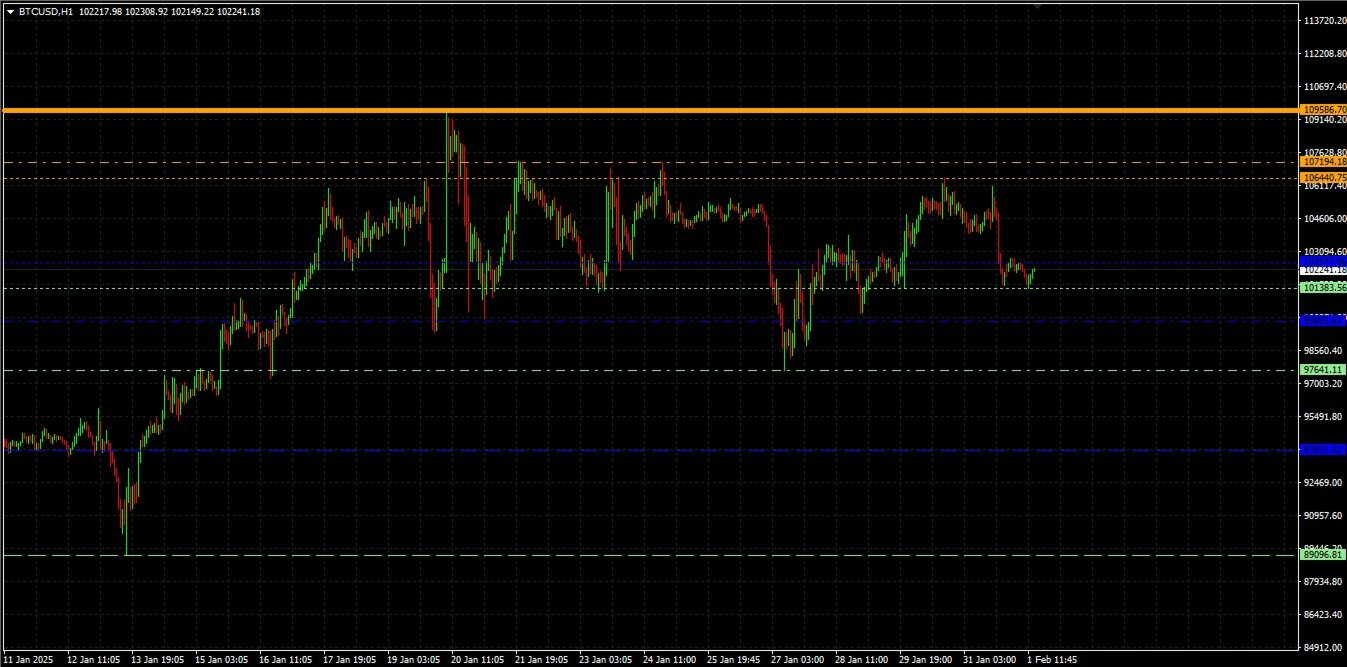
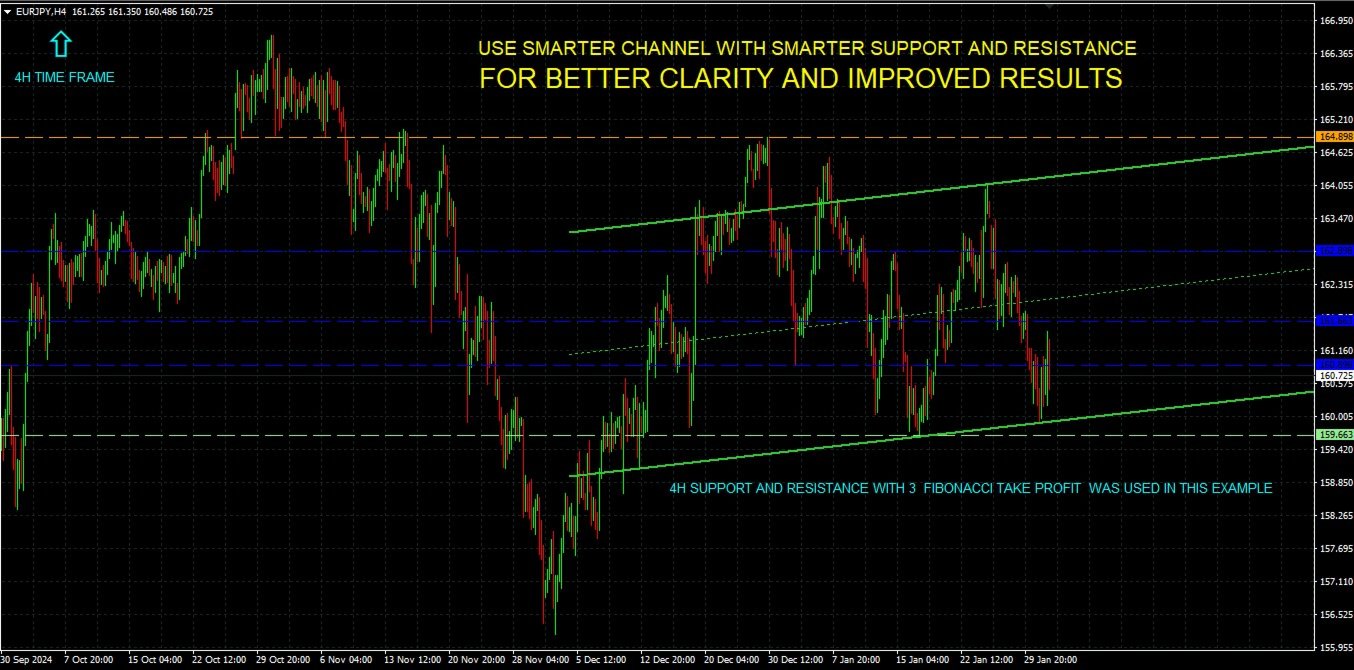
L'Indicatore di Supporto e Resistenza Intelligente è progettato per migliorare la tua analisi tecnica identificando automaticamente i livelli chiave di supporto e resistenza su più periodi, aiutando i trader a prendere decisioni più informate. Questo strumento calcola in modo efficiente i punti di prezzo più alti e più bassi su un periodo di riferimento specificato, basandosi sui livelli più testati, quindi calcola la media di questi livelli per tracciarli dinamicamente sul tuo grafico. Ciò significa che i livelli di supporto e resistenza generati sono più affidabili rispetto alla maggior parte degli indicatori di supporto e resistenza disponibili. Integra anche i livelli di ritracciamento di Fibonacci come potenziali obiettivi di prezzo per migliorare le previsioni di mercato, che possono anche fungere da ulteriori livelli di supporto o resistenza.

Caratteristiche principali:

  • Livelli di Supporto e Resistenza Automatici: Identifica i livelli di supporto e resistenza più significativi su un periodo di riferimento (predefinito: 200).
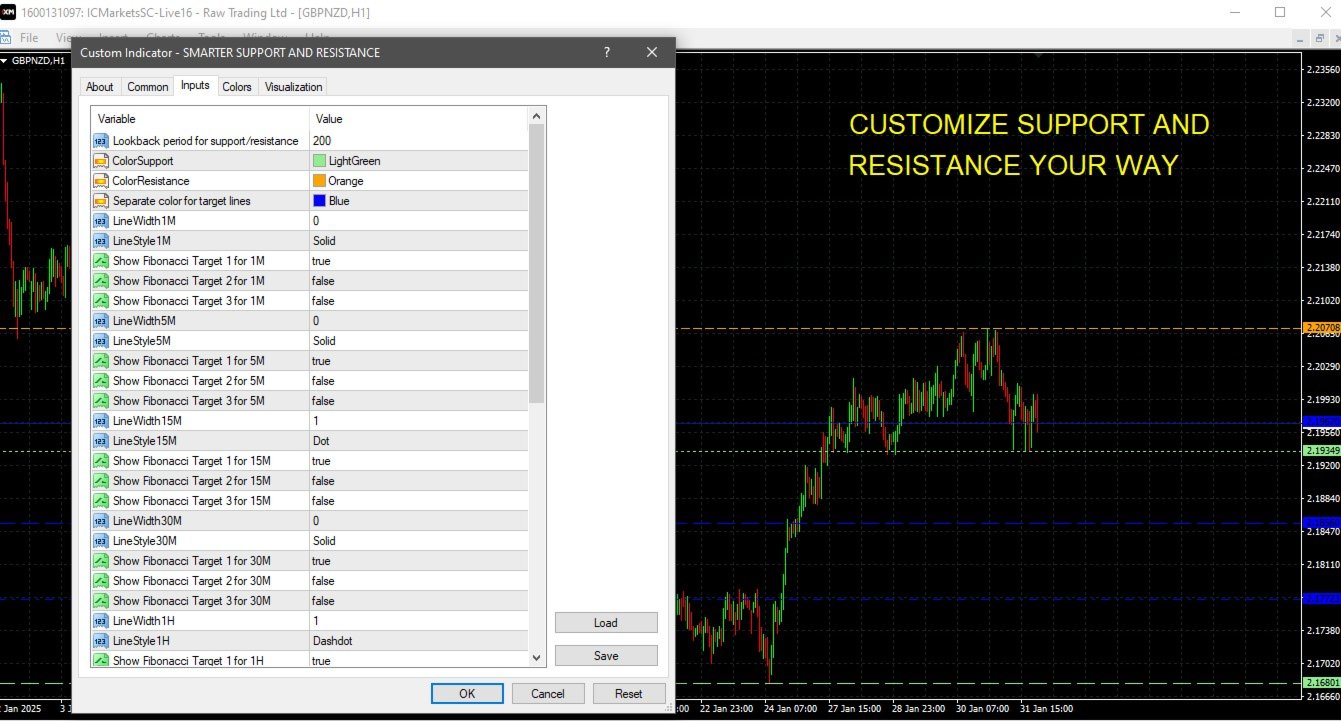
  • Periodi Personalizzabili: Supporta tutti i principali periodi, dal 1 minuto (M1) al mensile (MN1), consentendo una tracciatura precisa dei livelli su ogni periodo.
  • Personalizzazione Flessibile delle Linee: Personalizza la larghezza, lo stile e il colore delle linee per i livelli di supporto, resistenza e obiettivi di Fibonacci per adattarsi alle tue preferenze di trading.
  • Obiettivi di Fibonacci: Traccia automaticamente fino a tre livelli di obiettivo basati su Fibonacci (23,6%, 38,2%, 61,8%) su ogni periodo, con l'opzione di attivare/disattivare la visibilità.
  • Supporto Multi-Periodo: L'indicatore aggiorna le linee di supporto, resistenza e obiettivo per diversi periodi, garantendo dati pertinenti per ogni sessione di trading.
  • Visualizzazione Migliorata: Visualizza facilmente i livelli importanti con linee colorate per il supporto, la resistenza e gli obiettivi. Supporta diverse opzioni di colore per una visualizzazione chiara del grafico.
  • Ottimizzato per Scalping e Swing Trading: Che tu stia facendo trading su periodi brevi come M1 o M5, o analizzando tendenze più ampie su D1 o W1, questo indicatore è adatto a diversi stili di trading.

Opzioni di Personalizzazione:

  • Imposta larghezze, stili e visibilità delle linee personalizzati per ogni periodo.
  • Attiva/disattiva gli obiettivi di Fibonacci per ogni periodo separatamente.
  • Scegli tra diverse opzioni di colore per il supporto, la resistenza e i livelli di obiettivo per una migliore organizzazione del grafico.

Ideale per:

  • Trader che cercano un'identificazione automatica dei livelli di supporto e resistenza su qualsiasi periodo.
  • Scalper e swing trader che necessitano di segnali rapidi e precisi di ingresso/uscita basati su livelli di prezzo chiave.
  • Trader che si affidano ai ritracciamenti di Fibonacci per configurare i trade e prevedere i movimenti di mercato.

Questo indicatore semplifica il processo di individuazione dei livelli chiave e migliora il tuo grafico con strumenti visivi, consentendo una migliore presa di decisione e un'esecuzione dei trade più rapida.


Prodotti consigliati
Trade with Gann on your side!! MASTER CIRCLE 360 CIRCLE CHART, originally created by Gann admitted that this is “The Mother of all charts”. It is one of the last studies that this great trader left for us. The numeric tab le is apparently quite simple like all the tables and is based on square numbers, the SQUARE OF 12 and is by evolution, one of the most important square numbers. Here we can find CYCLE, PRICE AND TIME thanks to angles and grades, to show past and future support and resistance.
Master Scalping M1 è un indicatore innovativo che utilizza un algoritmo per determinare il trend in modo rapido e preciso. L'indicatore calcola il tempo di apertura e chiusura delle posizioni, gli algoritmi dell'indicatore consentono di trovare i momenti ideali per entrare in un trade (acquistare o vendere un asset), il che aumenta il successo delle transazioni per la maggior parte dei trader. Vantaggi dell'indicatore: Facile da usare, non sovraccarica il grafico con informazioni inutili. Può es
EZZ Elite Zig Zag is an indicator for the MetaTrader 4 terminal. This indicator traces the peak of the trend based on the market reversal, thus showing various opportunities in the financial market. EZZ Elite Zig Zag is a visual tool, intuitive, and easy to understand and use.  Test it Yourself by Downloading it for Free. Author Paulo Rocha all rights reserved
Owl smart levels
Sergey Ermolov
4.28 (36)
Versione MT5  |  FAQ L' indicatore Owl Smart Levels   è un sistema di trading completo all'interno dell'unico indicatore che include strumenti di analisi di mercato popolari come i   frattali avanzati di Bill Williams , Valable ZigZag che costruisce   la corretta struttura a onde   del mercato, e i   livelli di Fibonacci che segnano i livelli esatti di entrata nel mercato e luoghi per prendere profitti. Descrizione dettagliata della strategia Istruzioni per lavorare con l'indicatore Consulente-
Point61 Indicator
Evgeniy Machok
5 (1)
The Point61 indicator is the result of many years of monitoring of price behavior of currency pairs and metals. It is not a secret, that in times of uncertainty, traders are looking for possible levels of support and resistance - the point, where price should stop its movement. There are 2 possible scenarios at these points: 1. Reverse (correction) to the opposite direction; 2. Breakthrough to continue movement. Very often these points are used to set stop orders - TakeProfit or StopLoss
Noize Absorption Index MT4
Ekaterina Saltykova
5 (1)
Noize Absorption Index - is the manual trading system that measures the difference of pressure between bears forces and bulls forces. Green line - is a noize free index that showing curent situation. Zero value of index shows totally choppy/flat market.Values above zero level shows how powerfull bullish wave is and values below zero measures bearish forces.Up arrow appears on bearish market when it's ready to reverse, dn arrow appears on weak bullish market, as a result of reverse expectation. S
Gann Square of 144
Taras Slobodyanik
5 (5)
The Gann Box (or Gann Square) is a market analysis method based on the "Mathematical formula for market predictions" article by W.D. Gann. This indicator can plot three models of Squares: 90, 52(104), 144. There are six variants of grids and two variants of arcs. You can plot multiple squares on one chart simultaneously. Parameters Square — selection of a square model: 90 — square of 90 (or square of nine); 52 (104) — square of 52 (or 104); 144 — universal square of 144; 144 (full) — "full" v
We present you the indicator "Candle closing counter", which will become your indispensable assistant in the world of trading. That’s why knowing when the candle will close can help: If you like to trade using candle patterns, you will know when the candle will be closed. This indicator will allow you to check if a known pattern has formed and if there is a possibility of trading. The indicator will help you to prepare for market opening and market closure. You can set a timer to create a pre
The Th3Eng PipFinite indicator is based on a very excellent analysis of the right trend direction with perfect custom algorithms. It show the true direction and the best point to start trading. With StopLoss point and Three Take Profit points. Also it show the right pivot of the price and small points to order to replace the dynamic support and resistance channel, Which surrounds the price. And Finally it draws a very helpful Box on the left side on the chart includes (take profits and Stop loss
Kangaroo Tailz
Brenden Caleb Luebeck
Looking for an indicator that identifies high-probability price action patterns? Love counter-trend trading? The Kangaroo Tailz indicator might be just for you. This indicator is meant to be used as a reversal detector. I personally would rather enter a position at the beginning of a trend rather than catch the last couple of moves. This indicator does a good job of alerting when price may reverse by identifying price action patterns that occur frequently in markets. Even though this indicator i
Forex Gump
Andrey Kozak
2.4 (5)
Forex Gump is a fully finished semi-automatic trading system. In the form of arrows, signals are displayed on the screen for opening and closing deals. All you need is to follow the instructions of the indicator. When the indicator shows a blue arrow, you need to open a buy order. When the indicator shows a red arrow, you need to open a sell order. Close orders when the indicator draws a yellow cross. In order to get the most effective result, we recommend using the timeframes H1, H4, D1. There
Are you tired of the uncertainty that arises when your orders fail to stop at a specific line due to the spread? Look no further! Introducing our  indicator that plots candlesticks based on the Ask price instead of the traditional bid-based chart commonly used in MQL4. With this indicator, you can say goodbye to the frustrations caused by the bid-based chart, as it provides you with a more accurate representation of market movements. By utilizing the Ask price, which represents the price at whic
HMA Trend Professional MT4
Pavel Zamoshnikov
4.57 (7)
Improved version of the free HMA Trend indicator (for MetaTrader 4) with statistical analysis. HMA Trend is a trend indicator based on the Hull Moving Average (HMA) with two periods. HMA with a slow period identifies the trend, while HMA with a fast period determines the short-term movements and signals in the trend direction. The main differences from the free version: Ability to predict the probability of a trend reversal using analysis of history data. Plotting statistical charts for analyzi
VR Cub
Vladimir Pastushak
VR Cub è un indicatore per ottenere punti di ingresso di alta qualità. L'indicatore è stato sviluppato per facilitare i calcoli matematici e semplificare la ricerca dei punti di ingresso in una posizione. La strategia di trading per la quale è stato scritto l'indicatore ha dimostrato la sua efficacia per molti anni. La semplicità della strategia di trading è il suo grande vantaggio, che consente anche ai trader alle prime armi di commerciare con successo con essa. VR Cub calcola i punti di apert
L'indicatore "Two Moving Average Crossover" per MetaTrader 4 (MT4) è uno strumento di analisi tecnica che visualizza due medie mobili e notifica quando le medie mobili si incrociano. L'indicatore calcola e traccia due medie mobili, una più veloce e l'altra più lenta. Quando la media mobile più veloce incrocia quella più lenta, viene considerato un segnale rialzista, che indica una potenziale inversione di tendenza o l'inizio di un nuovo trend rialzista. Al contrario, quando la media mobile più
Stratos Pali
Michela Russo
5 (1)
Stratos Pali Indicator   is a revolutionary tool designed to enhance your trading strategy by accurately identifying market trends. This sophisticated indicator uses a unique algorithm to generate a complete histogram, which records when the trend is Long or Short. When a trend reversal occurs, an arrow appears, indicating the new direction of the trend. Important Information Revealed Leave a review and contact me via mql5 message to receive My Top 5 set files for Stratos Pali at no cost! Dow
Signal trend indicator. Detects the direction of the trend and is coloured accordingly.  Has built in audible and visual alerts when trends change. Can send notifications to your phone or email. Allows Trend and Counter-Trend trading. Works on all timeframes, all currency pairs, metals, indices and cryptocurrencies. Can be used with binary options. Distinctive features No re-drawing; Simple and clear settings; Four types of alerts; Works on all timeframes and all trading tools; Suitable
Trendiness Index
Libertas LLC
5 (3)
"The trend is your friend" is one of the best known sayings in investing, because capturing large trendy price movements can be extremely profitable. However, trading with the trend is often easier said than done, because many indicators are based on price reversals not trends. These aren't very effective at identifying trendy periods, or predicting whether trends will continue. We developed the Trendiness Index to help address this problem by indicating the strength and direction of price trend
The indicator displays the data of the Stochastic oscillator from a higher timeframe on the chart. The main and signal lines are displayed in a separate window. The stepped response is not smoothed. The indicator is useful for practicing "manual" forex trading strategies, which use the data from several screens with different timeframes of a single symbol. The indicator uses the settings that are identical to the standard ones, and a drop-down list for selecting the timeframe. Indicator Paramet
Infinity Trend Pro
Yaroslav Varankin
1 (1)
This is a trend indicator without redrawing Developed instead of the binary options strategy (by the color of the Martingale candlestick) Also works well in forex trading When to open trades (binary options) A signal will appear in the place with a candle signaling the current candle It is recommended to open a deal for one candle of the current timeframe M1 and M5 When a blue dot appears, open a deal up When a red dot appears, open a trade down. How to open trades on Forex. When a signal is rec
Fibonacci retracement and extension line drawing tool Fibonacci retracement and extended line drawing tool for MT4 platform is suitable for traders who use  golden section trading Advantages: There is no extra line, no too long line, and it is easy to observe and find trading opportunities Trial version: https://www.mql5.com/zh/market/product/35884 Main functions: 1. Multiple groups of Fibonacci turns can be drawn directly, and the relationship between important turning points can be seen
Super Reversal Pattern
Parfait Mujinga Ndalika
Super Reversal Pattern Indicator Unlock the power of advanced pattern recognition with our Super Reversal Pattern Indicator. Designed for traders seeking precision and reliability, this indicator identifies one of the most effective reversal patterns in technical analysis, offering a significant edge in your trading strategy. Key Features: Non-Repainting Accuracy: Enjoy the confidence of non-repainting technology. Once a Super Reversal Pattern is detected, it remains static, providing consiste
Indicator function This index buys and sells according to the color, using time is one hour,Please run the test on a 30-minute cycle It is best to use 1H for testing   About update questions In order to be more suitable for market fluctuations, the company regularly updates the indicators   Product cycle and trading time applicable to indicators Applicable mainstream currency pair EUR/USD GBP/USD NZD/USD AUD/USD USD/JPY USD/CAD USD/CHF Applicable mainstream cross currency pair EUR/JPY EUR/GBP E
Sto Signal AM
Andriy Matviyevs'kyy
This indicator displays Stochastic osc signals on the price chart and allows the user to receive notifications of such signals. The Stochastic indicator is a classic and proven indicator of the technical analysis of the markets. Despite its age, it is still relevant today. Depending on the settings, the indicator allows you to work effectively on various TFs and any markets. Signals are given on fully formed bars and are not redrawn. Custom Parameters: Stochastic_Price (0-1) - The applied price
Questo è un indicatore MTF dei livelli di supporto e resistenza basato sugli   estremi dell'indicatore Advanced ZigZag Dynamic   e/o   Extended Fractals   con etichette dei prezzi (può essere disabilitato). È possibile selezionare TF più alti per la modalità MTF. Per impostazione predefinita, i livelli vengono generati in base ai punti indicatori ZigZag. I punti indicatori frattali possono essere utilizzati anche insieme a ZigZag o al suo posto. Per semplificare l'uso e risparmiare tempo di CPU,
Gold Bricks FX USES THE TREND WAVE INDICATOR AND IT CAN IDENTIFY THE BEGINNING AND THE END OF A NEW WAVE TREND MOVEMENT. AS AN OSCILLATOR, THE INDICATOR IDENTIFIES THE OVERBOUGHT AND OVERSOLD ZONES. IT WORKS GREAT TO CATCH THE SHORT TERM PRICE REVERSALS AND USES A MARTINGALE STRATEGY TO CLOSE ALL TRADES IN PROFIT. USE DEFAULT SETTINGS ON H1 OR HIGHER TIME FRAME ON ANY PAIR FOR MORE ACCURATE TRADES WHY THIS EA : Smart entries calculated by 4 great strategies The EA can be run on even a $300
What are Heiken Ashi Candles? Heiken Ashi, derived from the Japanese term 'Heikin Ashi,' translates to average price bars. It's an indicator depicting price bars on a chart. Formula for Heiken Ashi candles: - Heiken Ashi opening price: (previous candle's opening + closing price) / 2 - Closing price Heiken Ashi: (opening + high + low + closing) / 4 - Heiken Ashi peak: Max of high, opening, or closing price - Heiken Ashi bottom price: Min of low, opening, or closing price How to Read Heiken A
Support and Resistance is a very important reference for trading.  This indicator provides customized support and resistance levels, automatic draw line and play music functions.  In addition to the custom RS, the default RS includes Pivot Point, Fibonacci, integer Price, MA, Bollinger Bands. Pivot Point is a resistance and support system. It has been widely used at froex,stocks, futures, treasury bonds and indexes. It is an effective support resistance analysis system. Fibonacci also known as t
L'indicatore DYJ BoS MT4 identifica e contrassegna automaticamente gli elementi essenziali dei cambiamenti nella struttura del mercato, tra cui: Breakout of Structure (BoS): rilevato quando il prezzo effettua una mossa significativa, rompendo un precedente punto di struttura. Segna possibili linee di tendenza al rialzo e al ribasso (UP e DN, ovvero nuovi massimi e nuovi minimi continui) e una volta che il prezzo sfonda queste linee, segna frecce rosse (ORSO) e verdi (TORO) Il BoS si verifica
TWO PAIRS SQUARE HEDGE METER INDICATOR Try this brilliant 2 pairs square indicator It draws a square wave of the relation between your two inputs symbols when square wave indicates -1 then it is very great opportunity to SELL pair1 and BUY Pair2 when square wave indicates +1 then it is very great opportunity to BUY pair1 and SELL Pair2 the inputs are : 2 pairs of symbols         then index value : i use 20 for M30 charts ( you can try other values : 40/50 for M15 , : 30 for M30 , : 10 for H1 ,
Gli utenti di questo prodotto hanno anche acquistato
Gann Made Easy
Oleg Rodin
4.79 (109)
Gann Made Easy è un sistema di trading Forex professionale e facile da usare che si basa sui migliori principi del trading utilizzando la teoria di mr. WD Gann. L'indicatore fornisce segnali ACQUISTA e VENDI accurati, inclusi i livelli di Stop Loss e Take Profit. Puoi fare trading anche in movimento utilizzando le notifiche PUSH. Vi prego di contattarmi dopo l'acquisto! Condividerò i miei consigli di trading con te e fantastici indicatori bonus gratuitamente! Probabilmente hai già sentito parlar
Scalper Inside PRO
Alexey Minkov
4.75 (61)
!SPECIAL SALE!  An exclusive indicator that utilizes an innovative algorithm to swiftly and accurately determine the market trend. The indicator automatically calculates opening, closing, and profit levels, providing detailed trading statistics. With these features, you can choose the most appropriate trading instrument for the current market conditions. Additionally, you can easily integrate your own arrow indicators into Scalper Inside Pro to quickly evaluate their statistics and profitability
-   Real price is 80$   - 40% Discount ( It is 49$ now ) - Lifetime update free Contact me for instruction, add group and any questions! Related Products:  Bitcoin Expert , Gold Expert - Non-repaint - I just sell my products in Elif Kaya profile, any other websites are stolen old versions, So no any new updates or support. Introduction The breakout and retest strategy is traded support and resistance levels. it involves price breaking through a previous level.  The break and retest strategy is
FX Volume
Daniel Stein
4.59 (34)
FX Volume: Scopri il Vero Sentimento di Mercato dalla Prospettiva di un Broker Panoramica Rapida Vuoi portare la tua strategia di trading a un livello superiore? FX Volume ti offre informazioni in tempo reale su come i trader retail e i broker sono posizionati—molto prima che compaiano report in ritardo come il COT. Che tu miri a guadagni costanti o desideri semplicemente un vantaggio più solido sui mercati, FX Volume ti aiuta a individuare grandi squilibri, confermare i breakout e perfezionar
Dynamic Forex28 Navigator
Bernhard Schweigert
5 (4)
Dynamic Forex28 Navigator - Lo strumento di trading Forex di nuova generazione. ATTUALMENTE SCONTATO DEL 49%. Dynamic Forex28 Navigator è l'evoluzione dei nostri indicatori popolari di lunga data, che combinano la potenza di tre in uno: Advanced Currency Strength28 Indicator (695 recensioni) + Advanced Currency IMPULSE con ALERT (520 recensioni) + CS28 Combo Signals (Bonus). Dettagli sull'indicatore https://www.mql5.com/en/blogs/post/758844 Cosa offre l'indicatore di forza di nuova generazione?
FX Levels MT4
Daniel Stein
5 (2)
FX Levels: Supporti e Resistenze di Precisione Eccezionale per Tutti i Mercati Panoramica Rapida Cercate un modo affidabile per individuare livelli di supporto e resistenza in ogni mercato—coppie di valute, indici, azioni o materie prime? FX Levels fonde il metodo tradizionale “Lighthouse” con un approccio dinamico all’avanguardia, offrendo una precisione quasi universale. Basato sulla nostra esperienza reale con i broker e su aggiornamenti automatici giornalieri più quelli in tempo reale, FX
Scalper Vault
Oleg Rodin
5 (28)
Scalper Vault è un sistema di scalping professionale che ti fornisce tutto il necessario per scalping di successo. Questo indicatore è un sistema di trading completo che può essere utilizzato dai trader di forex e opzioni binarie. L'intervallo di tempo consigliato è M5. Il sistema fornisce segnali di freccia accurati nella direzione della tendenza. Ti fornisce anche i segnali più alti e più bassi e i livelli di mercato di Gann. Gli indicatori forniscono tutti i tipi di avvisi, comprese le notifi
FX Power MT4 NG
Daniel Stein
4.94 (18)
FX Power: Analizza la Forza delle Valute per Decisioni di Trading Più Intelligenti Panoramica FX Power è lo strumento essenziale per comprendere la reale forza delle principali valute e dell'oro in qualsiasi condizione di mercato. Identificando le valute forti da comprare e quelle deboli da vendere, FX Power semplifica le decisioni di trading e rivela opportunità ad alta probabilità. Che tu segua le tendenze o anticipi inversioni utilizzando valori estremi di Delta, questo strumento si adatta
Chart Patterns All in One
Davit Beridze
4.68 (19)
Prova "Chart Patterns All in One" in modalità demo e ricevi un bonus. Inviami un messaggio dopo averlo testato in modalità demo per ricevere il tuo bonus. Lascia un commento dopo l'acquisto per ricevere 8 indicatori di alta qualità come bonus. L'indicatore Chart Patterns All-in-One aiuta i trader a visualizzare vari modelli di grafici comunemente utilizzati nell'analisi tecnica. Questo indicatore supporta l'identificazione dei possibili comportamenti del mercato, ma non garantisce la redditivit
TPSpro RFI Levels
Roman Podpora
4.85 (26)
ISTRUZIONI       RUS   -   INGLESE       Si   consiglia di utilizzare con un indicatore       -       TPSpro   TENDENZA PRO -   Versione MT4         Un elemento chiave nel trading sono le zone o i livelli da cui vengono prese le decisioni di acquisto o vendita di uno strumento di trading. Nonostante i tentativi dei principali attori di nascondere la loro presenza sul mercato, lasciano inevitabilmente delle tracce. Il nostro compito era imparare a identificare queste tracce e interpretarle corre
IX Power MT4
Daniel Stein
4.67 (6)
IX Power: Scopri approfondimenti di mercato per indici, materie prime, criptovalute e forex Panoramica IX Power è uno strumento versatile progettato per analizzare la forza di indici, materie prime, criptovalute e simboli forex. Mentre FX Power offre la massima precisione per le coppie di valute utilizzando i dati di tutte le coppie disponibili, IX Power si concentra esclusivamente sui dati di mercato del simbolo sottostante. Questo rende IX Power una scelta eccellente per mercati non correlat
Advanced Supply Demand
Bernhard Schweigert
4.91 (294)
CURRENTLY 26% OFF !! Best Solution for any Newbie or Expert Trader! This indicator is a unique, high quality and affordable trading tool because we have incorporated a number of proprietary features and a new formula. With this update, you will be able to show double timeframe zones. You will not only be able to show a higher TF but to show both, the chart TF, PLUS the higher TF: SHOWING NESTED ZONES. All Supply Demand traders will love it. :) Important Information Revealed Maximize the potentia
Easy Breakout
Mohamed Hassan
5 (9)
After your purchase, feel free to contact me for more details on how to receive a bonus indicator called VFI, which pairs perfectly with Easy Breakout for enhanced confluence!   Easy Breakout is a powerful price action trading system built on one of the most popular and widely trusted strategies among traders: the Breakout strategy ! This indicator delivers crystal-clear Buy and Sell signals based on breakouts from key support and resistance zones. Unlike typical breakout indicators, it levera
Gold Stuff
Vasiliy Strukov
4.86 (247)
Gold Stuff è un indicatore di tendenza progettato specificamente per l'oro e può essere utilizzato anche su qualsiasi strumento finanziario. L'indicatore non ridisegna e non è in ritardo. Periodo consigliato H1. Su di esso l'indicatore funziona in modo completamente automatico Expert Advisor EA Gold Stuff. Lo trovi nel mio profilo. I risultati in tempo reale possono essere visualizzati qui.  Puoi ottenere una copia gratuita del nostro indicatore Strong Support e Trend Scanner, per favore scriv
TPSproTREND PrO
Roman Podpora
4.68 (25)
TPSpro TREND PRO   è un indicatore di tendenza che analizza automaticamente il mercato, fornisce informazioni sulla tendenza e sui rispettivi cambiamenti e fornisce segnali per entrare nelle operazioni senza ridisegnare. L'indicatore utilizza ciascuna candela e la analizza separatamente. Si riferisce a vari shock al rialzo o al ribasso. Punto di ingresso preciso per il trading di valute, criptovalute, metalli, azioni e indici! Versione MT5                   Descrizione completa dell'indicatore  
Gold Venamax MT4
Sergei Linskii
5 (1)
Gold Venamax : questo è il miglior indicatore tecnico azionario. L'algoritmo dell'indicatore analizza il movimento dei prezzi di un asset e riflette la volatilità e le potenziali zone di ingresso. Caratteristiche dell'indicatore: Questo è un super indicatore con Magic e due blocchi di frecce di tendenza per un trading comodo e redditizio. Sul grafico viene visualizzato il pulsante rosso per cambiare blocco. Magic è impostato nelle impostazioni dell'indicatore, in modo da poter installare l'in
Currency Strength Exotics
Bernhard Schweigert
4.87 (31)
ATTUALMENTE SCONTATO DEL 20%! La soluzione migliore per qualsiasi principiante o trader esperto! Questo indicatore è specializzato nel mostrare la forza della valuta per qualsiasi simbolo come coppie esotiche, materie prime, indici o futures. È il primo nel suo genere, qualsiasi simbolo può essere aggiunto alla nona riga per mostrare la vera forza della valuta di Oro, Argento, Petrolio, DAX, US30, MXN, TRY, CNH ecc. Si tratta di uno strumento di trading unico, di alta qualità e conveniente pe
Golden Trend Indicator
Noha Mohamed Fathy Younes Badr
4.9 (10)
Golden Trend indicator  is The best indicator for predicting trend movement this indicator never lags and never repaints and never back paints    and give  arrow buy and sell    before the candle appear  and it will help you and  will make your trading decisions clearer its work on all currencies and  gold and crypto and all time frame This unique  indicator uses very secret algorithms to catch the  trends, so you can trade using this indicator and see the trend clear on charts  manual guide and
Trend Screener
STE S.S.COMPANY
4.78 (93)
Indicatore di tendenza, soluzione unica rivoluzionaria per il trading di tendenze e il filtraggio con tutte le importanti funzionalità di tendenza integrate in un unico strumento! È un indicatore multi-timeframe e multi-valuta al 100% non ridipingibile che può essere utilizzato su tutti i simboli/strumenti: forex, materie prime, criptovalute, indici e azioni. OFFERTA A TEMPO LIMITATO: l'indicatore di screening di supporto e resistenza è disponibile a soli 50$ e a vita. (Prezzo originale 250$) (o
Innanzitutto, vale la pena sottolineare che questo Strumento di Trading è un Indicatore Non-Ridipingente, Non-Ridisegnante e Non-Laggante, il che lo rende ideale per il trading professionale. Corso online, manuale utente e demo. L'Indicatore Smart Price Action Concepts è uno strumento molto potente sia per i nuovi che per i trader esperti. Racchiude più di 20 utili indicatori in uno solo, combinando idee di trading avanzate come l'Analisi del Trader del Circolo Interno e le Strategie di Trading
ATTUALMENTE SCONTATO DEL 31%! La soluzione migliore per ogni principiante o trader esperto! Questo indicatore è uno strumento di trading unico, di alta qualità e conveniente perché abbiamo incorporato una serie di caratteristiche proprietarie e una formula segreta. Con un solo grafico fornisce avvisi per tutte le 28 coppie di valute. Immaginate come migliorerà il vostro trading perché sarete in grado di individuare l'esatto punto di innesco di una nuova tendenza o opportunità di scalping! Co
Presentazione       Quantum Trend Sniper Indicator   , l'innovativo indicatore MQL5 che sta trasformando il modo in cui identifichi e scambi le inversioni di tendenza! Sviluppato da un team di trader esperti con un'esperienza di trading di oltre 13 anni,       Indicatore Quantum Trend Sniper       è progettato per spingere il tuo viaggio di trading verso nuove vette con il suo modo innovativo di identificare le inversioni di tendenza con una precisione estremamente elevata. *** Acquista Quantum
TW Trend Scalper Indicator: The TW Scalper Shoot ti offre un'esperienza di trading unica utilizzando le ultime strategie di trading e la tecnologia dell'intelligenza artificiale. Questo prodotto soddisfa le diverse esigenze dei trader scalper fornendo due categorie distinte di segnali: Testa questo prodotto eccezionale oggi e inizia la tua esperienza unica per diventare un scalper di tendenze. Inoltre, ricevi un prodotto del valore di 37 $ come regalo. Categorie di segnali: 1. Segnali a lu
Beast Super Signal
Dustin Vlok
4.73 (89)
Alla ricerca di un potente indicatore di trading forex che possa aiutarti a identificare facilmente opportunità di trading redditizie? Non guardare oltre il Super Segnale Bestia. Questo indicatore basato sulle tendenze di facile utilizzo monitora continuamente le condizioni del mercato, cercando nuove tendenze in via di sviluppo o saltando su quelle esistenti. Il Beast Super Signal fornisce un segnale di acquisto o di vendita quando tutte le strategie interne sono allineate e sono al 100% in con
CONTACT US  after purchase to get a FREE Indicator Manual & Exclusive Trading Tips! Try Now—Limited 50% Discount for First 100 Buyers! Download the  Metatrader 5 Version Due to regulatory restrictions, our service is unavailable in certain countries such as India, Pakistan, and Bangladesh. William Delbert Gann (W.D. Gann) was an exceptional market analyst, whose trading technique was based on a complex blend of mathematics, geometry, astrology, and ancient mathematics which proved to be extr
Special offer : ALL TOOLS , just $35 each! New tools   will be   $30   for the   first week   or the   first 3 purchases !  Trading Tools Channel on MQL5 : Join my MQL5 channel to update the latest news from me Scopri la potenza del concetto di Inversion Fair Value Gap (IFVG) di ICT con l’ Indicatore Inversion Fair Value Gaps ! Questo strumento all’avanguardia porta i Fair Value Gaps (FVG) a un livello successivo, identificando e visualizzando le zone di FVG invertite – aree chiave di supporto
Special offer : ALL TOOLS , just $35 each! New tools   will be   $30   for the   first week   or the   first 3 purchases !  Trading Tools Channel on MQL5 : Join my MQL5 channel to update the latest news from me Presentiamo il rivoluzionario RSI Kernel Optimized with Scanner, uno strumento all'avanguardia che ridefinisce l'analisi RSI tradizionale integrando il potente algoritmo di stima della densità del nucleo (KDE). Questo indicatore avanzato non solo fornisce informazioni in tempo reale sull
Legacy of Gann
Pavel Zamoshnikov
4.83 (12)
The indicator very accurately determines the levels of the possible end of the trend and profit fixing. The method of determining levels is based on the ideas of W.D.Gann, using an algorithm developed by his follower Kirill Borovsky. Extremely high reliability of reaching levels (according to K. Borovsky  - 80-90%) Indispensable for any trading strategy – every trader needs to determine the exit point from the market! Precisely determines targets on any timeframes and any instruments (forex, met
Automated Trendlines
Georgios Kalomoiropoulos
5 (16)
Le linee di tendenza sono lo strumento più essenziale di analisi tecnica nel forex trading. Sfortunatamente, la maggior parte dei trader non li disegna correttamente. L'indicatore automatizzato delle linee di tendenza è uno strumento professionale per i trader seri che ti aiuta a visualizzare il movimento di tendenza dei mercati. Esistono due tipi di linee di tendenza, linee di tendenza rialziste e linee di tendenza ribassiste. Nella tendenza rialzista, la linea di tendenza Forex viene tracci
ATTUALMENTE SCONTATO DEL 26% La soluzione migliore per ogni principiante o trader esperto! Questo indicatore è uno strumento di trading unico, di alta qualità e conveniente perché abbiamo incorporato una serie di caratteristiche proprietarie e una nuova formula. Con un solo grafico è possibile leggere la forza delle valute per 28 coppie Forex! Immaginate come migliorerà il vostro trading perché sarete in grado di individuare l'esatto punto di innesco di una nuova tendenza o di un'opportunità
Altri dall’autore
Coloured MACD
Moegamat Luqmaan Titus
The Colored MACD indicator is a versatile and powerful tool designed to enhance your technical analysis by providing an intuitive visualization of market momentum and trend changes. Built on the foundation of the popular Moving Average Convergence Divergence (MACD) indicator, this version introduces color-coded histograms to easily distinguish between bullish and bearish momentum. Key Features: Color-Coded Visualization : The indicator features a lime-colored histogram when the MACD is above the
FREE
Coloured Parabolic SAR
Moegamat Luqmaan Titus
Overview: The Coloured Parabolic SAR Indicator is a visually enhanced trading tool designed to make trend-following and trade identification easier. This customizable indicator provides clear visual cues with color-coded signals for bullish (buy) and bearish (sell) trends directly on your MT4 chart. Key Features: Color-Coded Signals : Lime green "o" symbol for Buy signals. Red "o" symbol for Sell signals. Customizable Inputs : Adjustable Step and Maximum parameters to fine-tune the Parabolic SA
FREE
Coloured Bollinger Bands
Moegamat Luqmaan Titus
Coloured Bollinger Bands The Coloured Bollinger Bands indicator is an enhanced version of the standard Bollinger Bands, offering customizable features to suit your trading needs. It uses the classic Simple Moving Average (SMA) as the middle band, and allows you to easily change the appearance of the bands, including the option to select colors and line types, ensuring better visual clarity and adaptability on your charts
FREE
Bull and Bear Strength
Moegamat Luqmaan Titus
Indicatore di Forza dei Tori e degli Orsi Aggiornamento 1.3 L'indicatore dei Tori e degli Orsi ora include un profilo di volume integrato per rilevare le aree di volume più forte all'interno di un dato intervallo di barre. Questo può essere ulteriormente modificato secondo le tue preferenze e impostazioni per una rilevazione esperta della forza dei tori e degli orsi con il volume più alto. Questo aiuta per: Rilevazione precoce e opportunità di ingresso precise Rilevazione dei cambiamenti di di
Dashboard Trade Manager
Moegamat Luqmaan Titus
Dashboard.mq4 - Gestore di Trading Semplice Progettato per coloro che amano il trading manuale e desiderano uno strumento per semplificare la gestione delle operazioni, questo potente strumento MQL4 migliora l'efficienza del trading fornendo una dashboard in tempo reale per gestire le proprie operazioni. Si integra perfettamente in MetaTrader, calcola la dimensione dei lotti e tiene traccia delle metriche di rischio senza sforzo. Funzionalità principali: Visualizzazione del Rischio e della Margi
Adjustable Volume Profile Indicator The Adjustable Volume Profile is a custom MetaTrader 4 (MT4) indicator designed to visually display the volume distribution of a financial instrument across a specific price range and time period. This indicator allows traders to analyze the volume profile based on either real volume or tick volume, helping to identify key levels of support, resistance, and market activity. Key Features: Customizable Timeframe: The indicator can be set to any available timefr
Trend Master ZA
Moegamat Luqmaan Titus
Indicatore Trend Master ZA Sfrutta la potenza dell'analisi delle tendenze con l'indicatore Trend Master ZA. Progettato per i trader che desiderano combinare più strategie tecniche in un singolo indicatore, questo strumento potente fornisce informazioni approfondite sulle tendenze di mercato e sulle fluttuazioni dei prezzi. Caratteristiche principali: Analisi delle tendenze con le Bande di Bollinger : Utilizza la potenza delle Bande di Bollinger per identificare le tendenze di mercato. Il period
Smarter Trend Channel
Moegamat Luqmaan Titus
Indicatore Smarter Trend Channel Descrizione: L'indicatore Smarter Trend Channel è uno strumento potente e flessibile progettato per aiutare i trader a identificare visivamente le principali tendenze di mercato tracciando dinamicamente linee di supporto e resistenza sui grafici dei prezzi. Utilizzando calcoli fractali avanzati, l'indicatore regola automaticamente le linee di tendenza in base alle condizioni di mercato, consentendo ai trader di individuare rotture e potenziali punti di inversion
Filtro:
Nessuna recensione
Rispondi alla recensione