• Overview
  • Reviews (6)
  • Comments (8)
  • What's new

Suleiman Levels

5

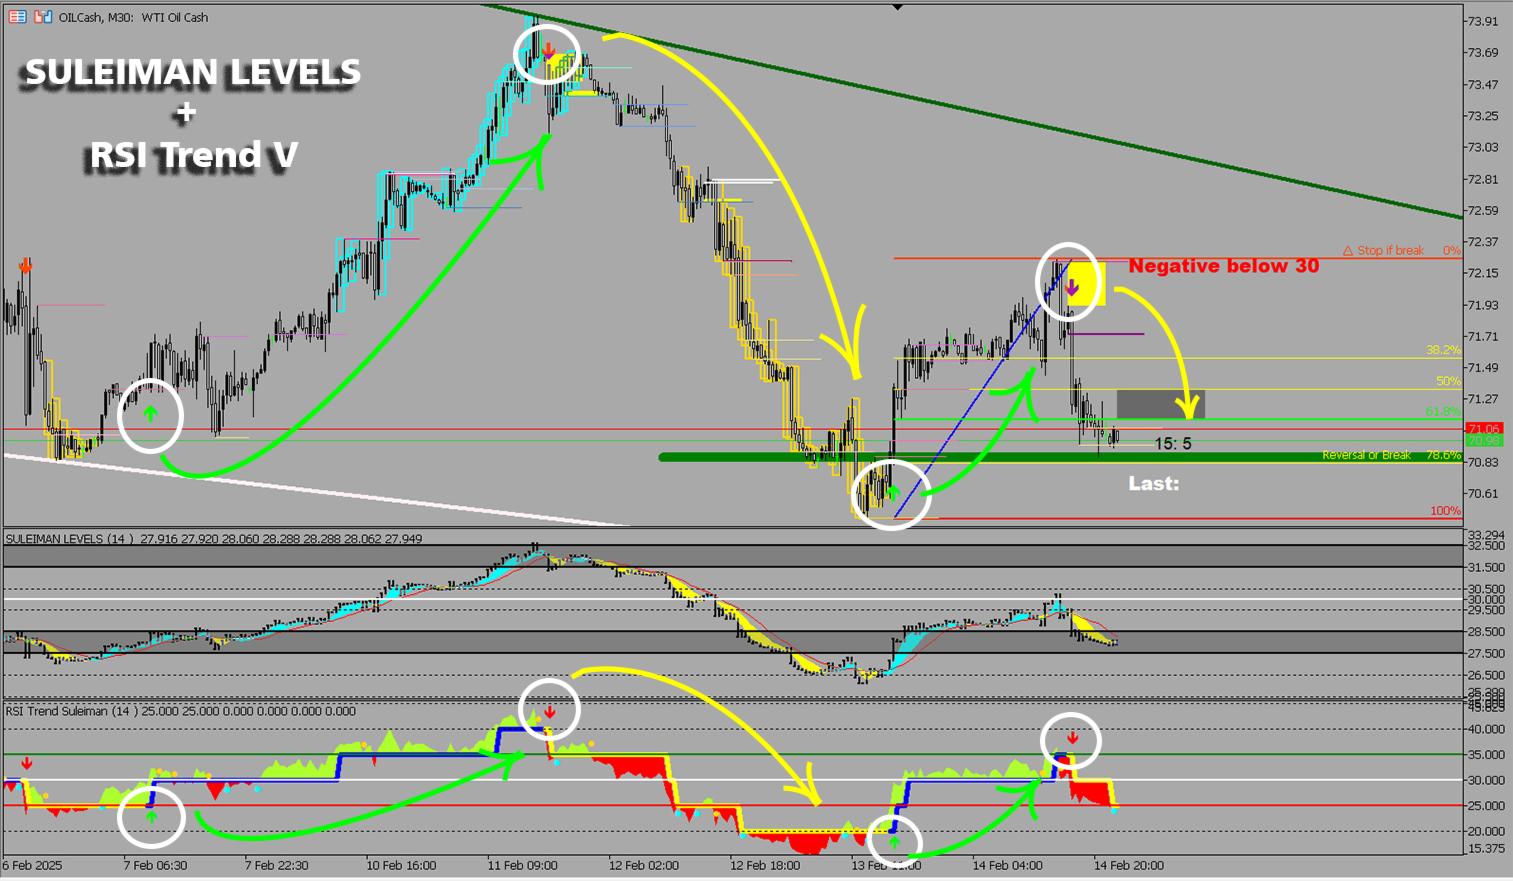
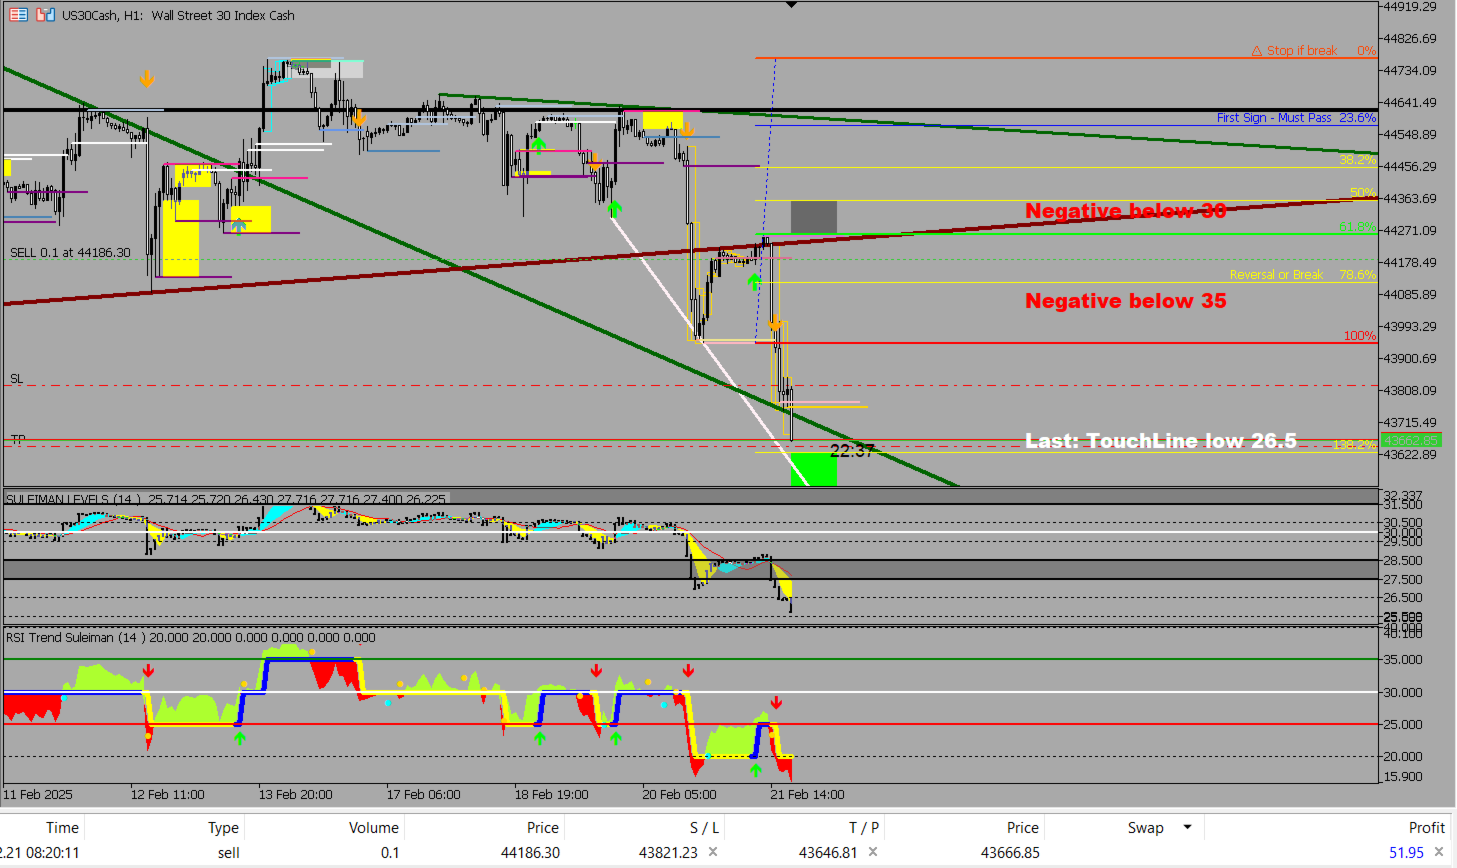
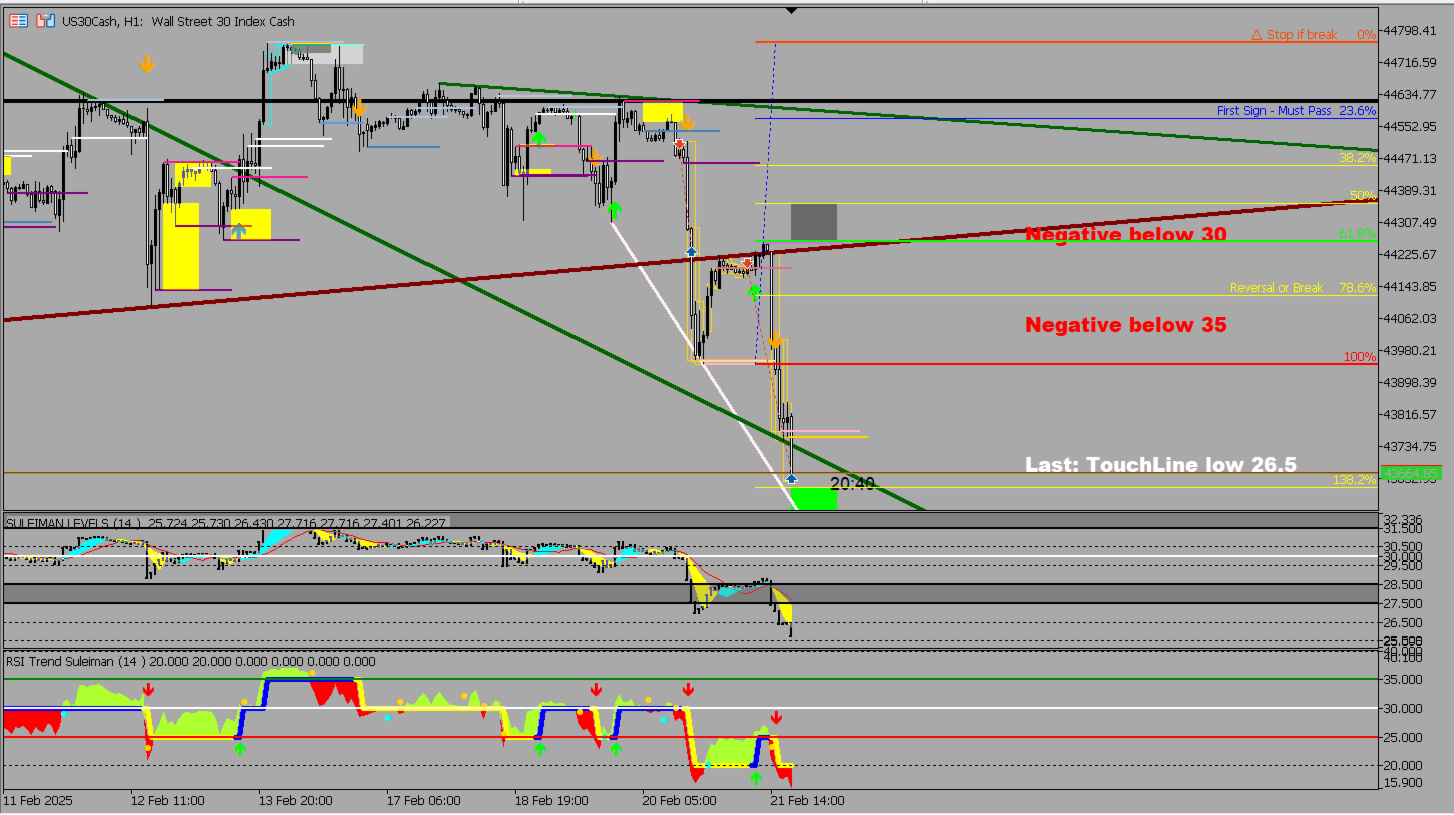
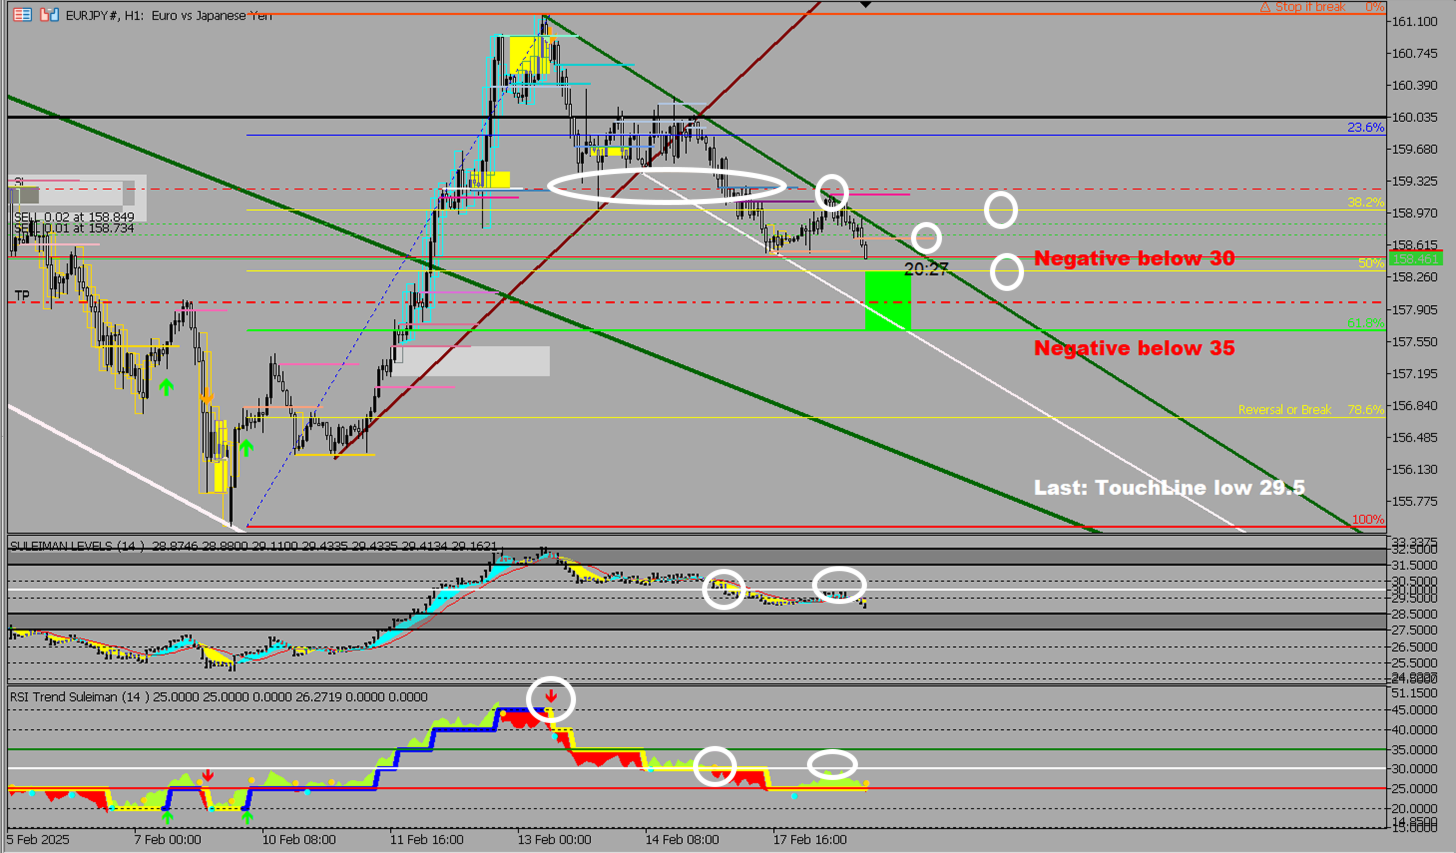
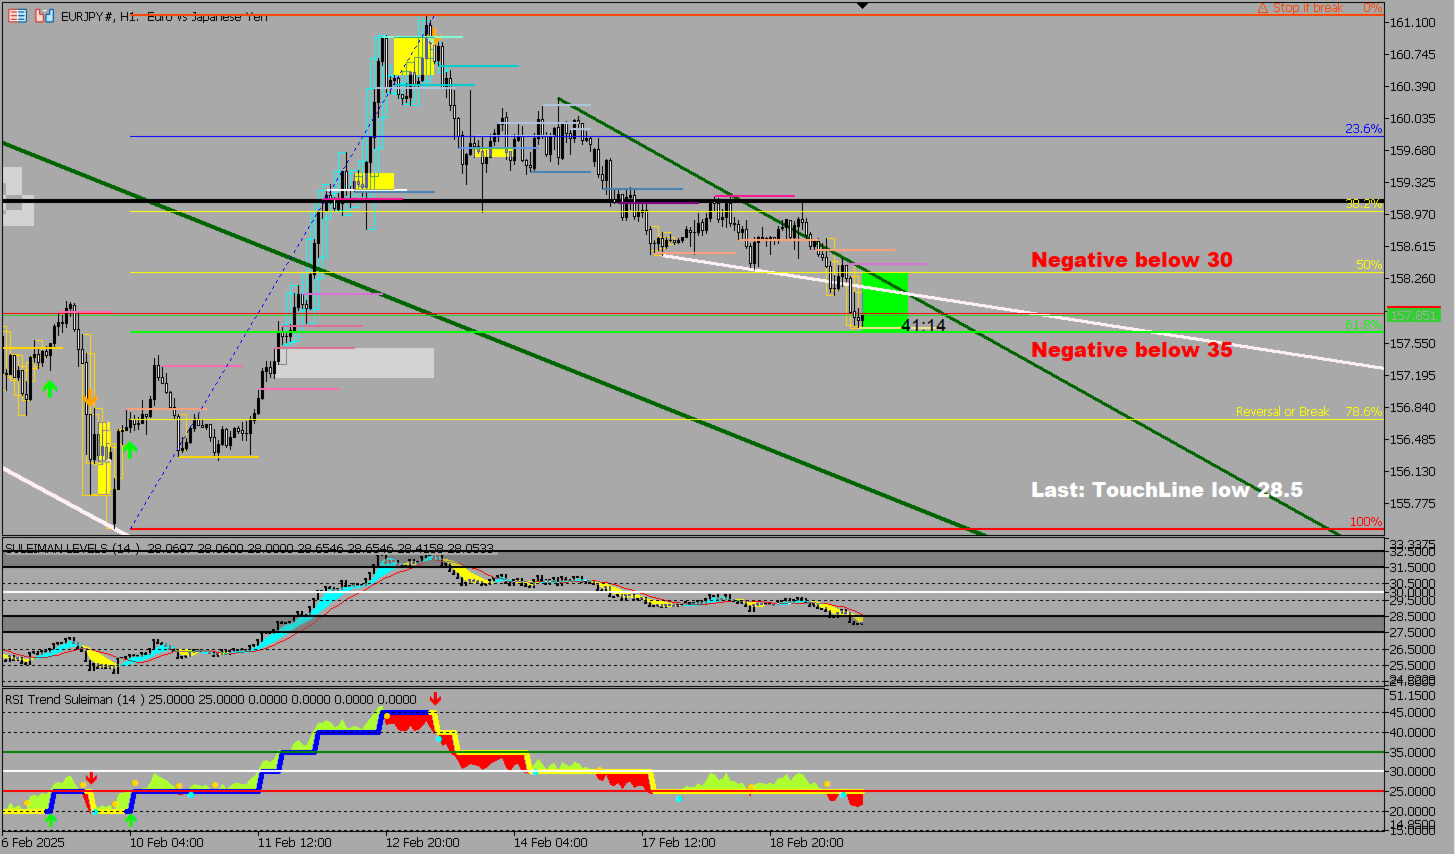
Important Note: The image shown in the Screenshots is of my 2 indicators, "Suleiman Levels" indicator and "RSI Trend V" indicator.

Suleiman Levels Indicator is an advanced, all-in-one professional analysis tool. With nearly 9,800 lines of code, this indicator combines innovation, precision, and simplicity to make your charts clearer than ever. It’s not just a Indicator. 

Powerful Features That Set Suleiman Levels Apart:

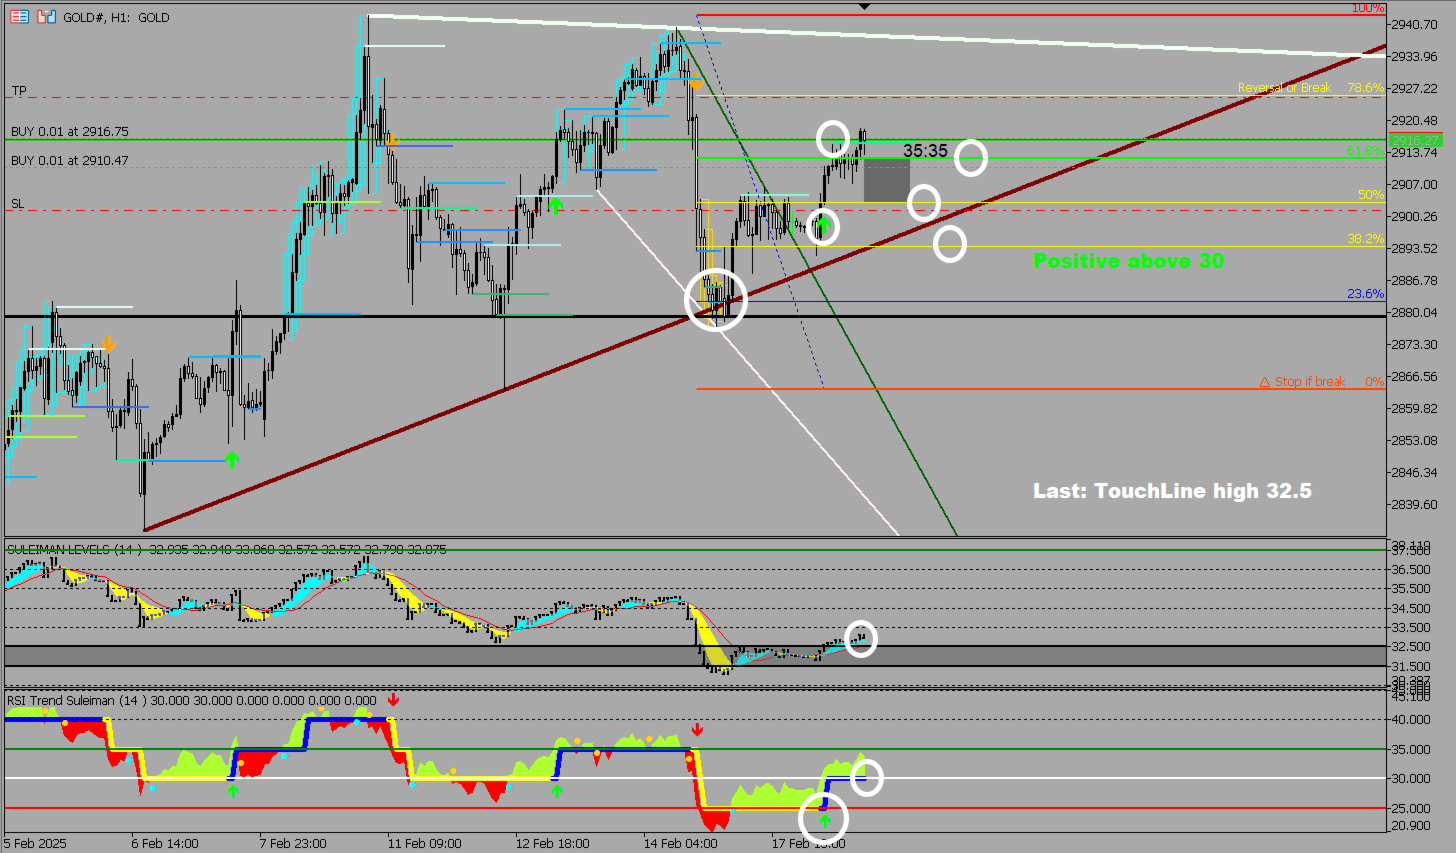
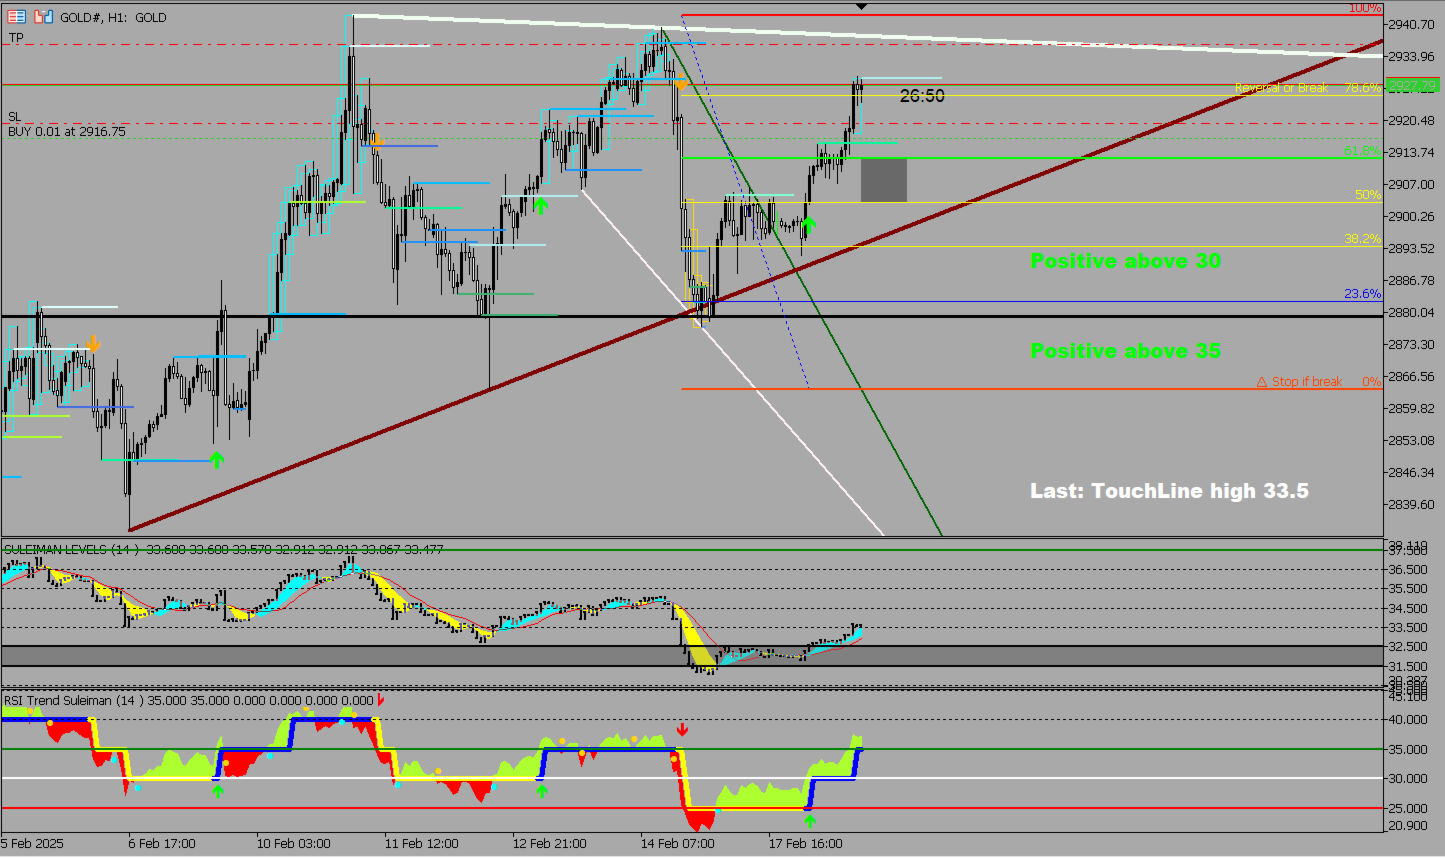
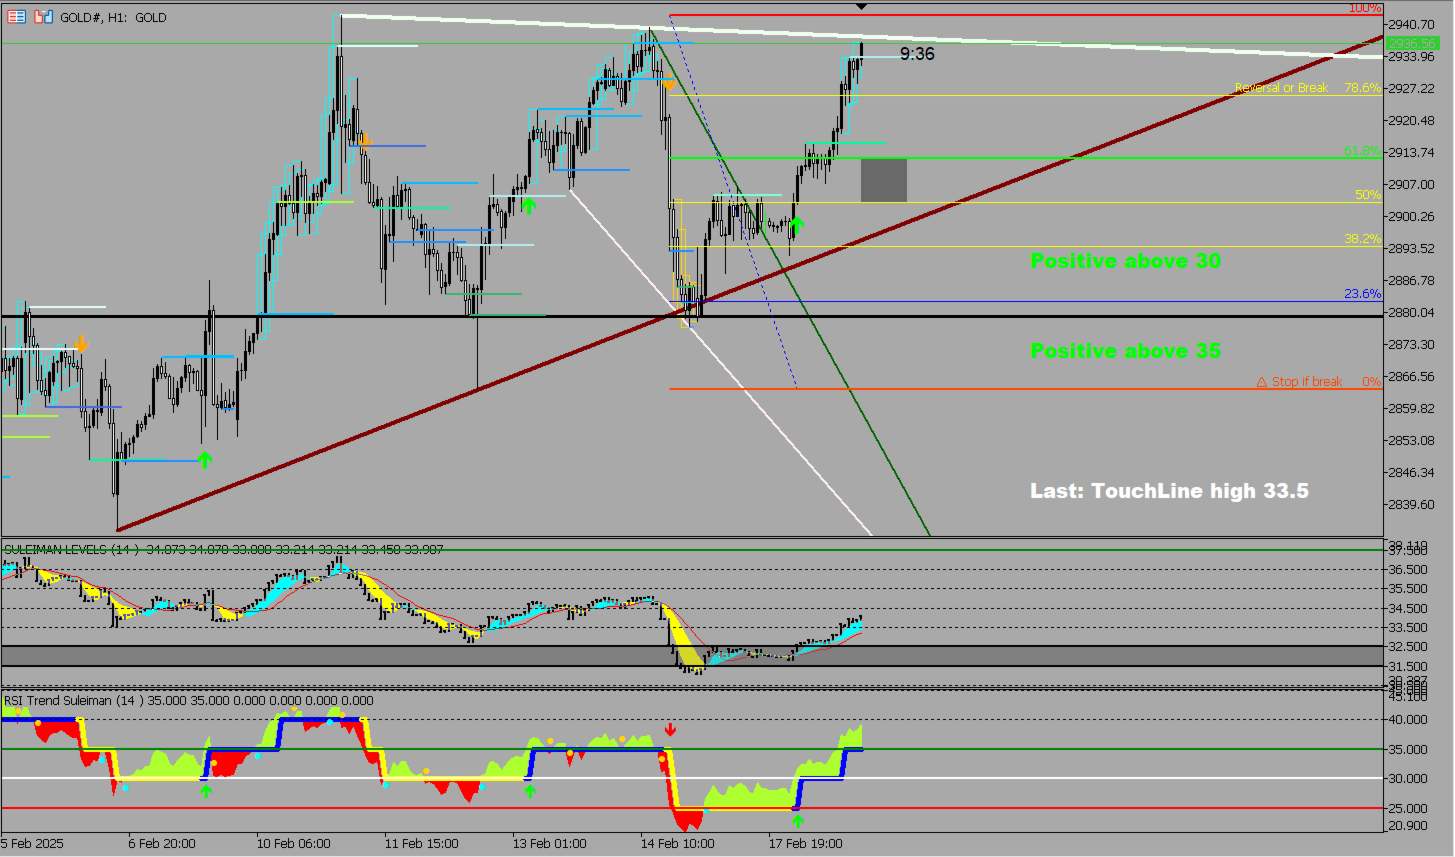
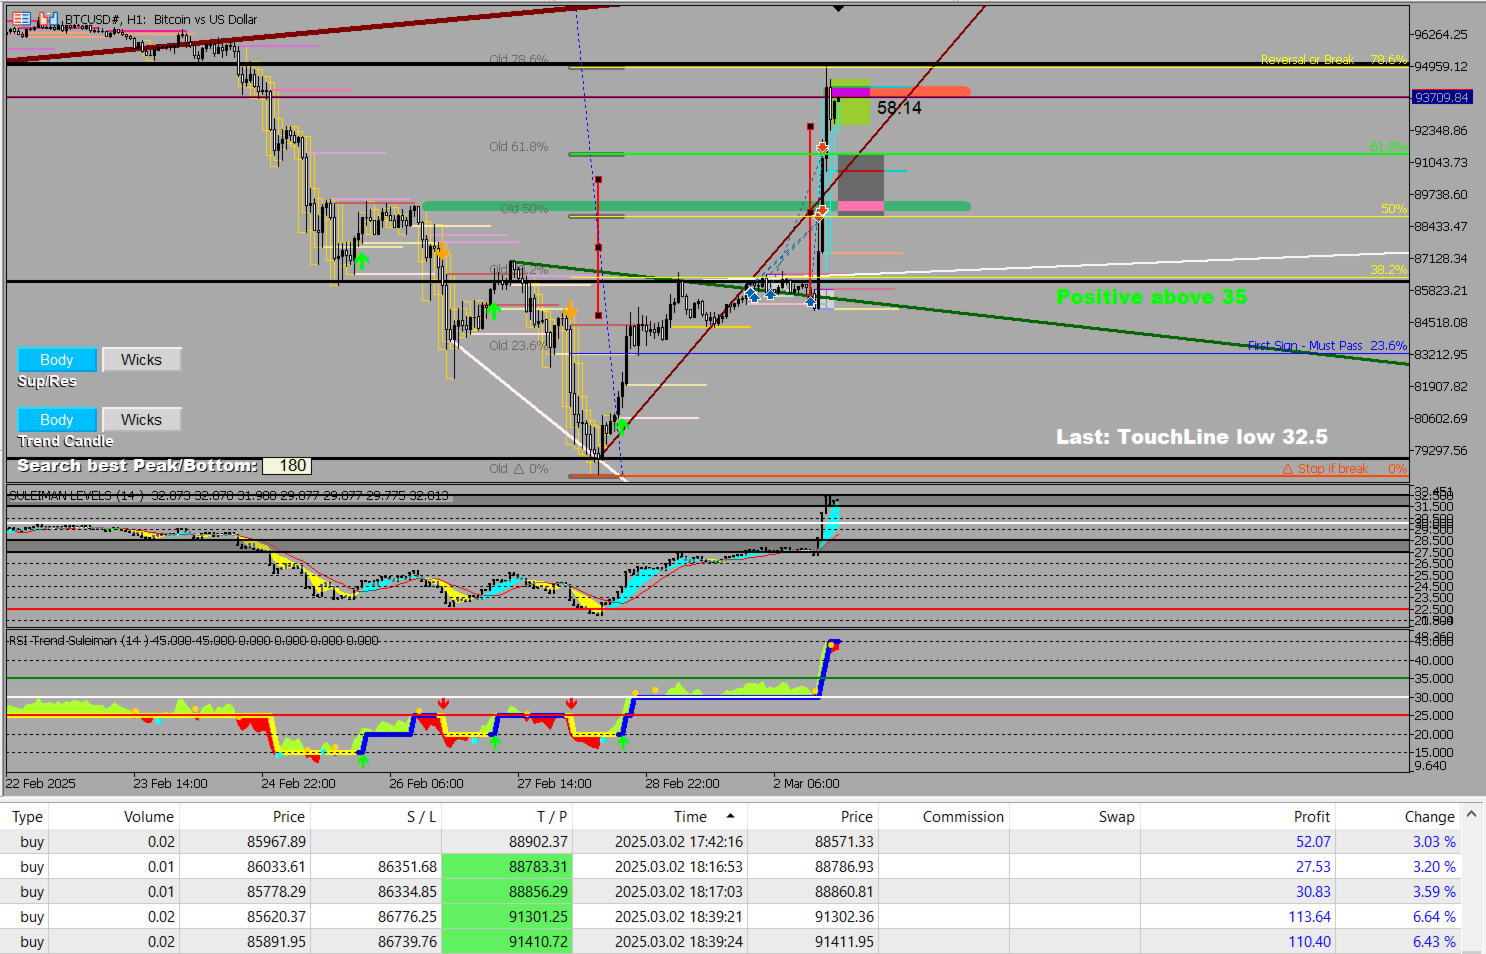
1-Yellow Boxes (Financial Flows Detection): Detect financial inflows from banks and institutions in specific candles.These boxes represent critical financial activity unique to this indicator.

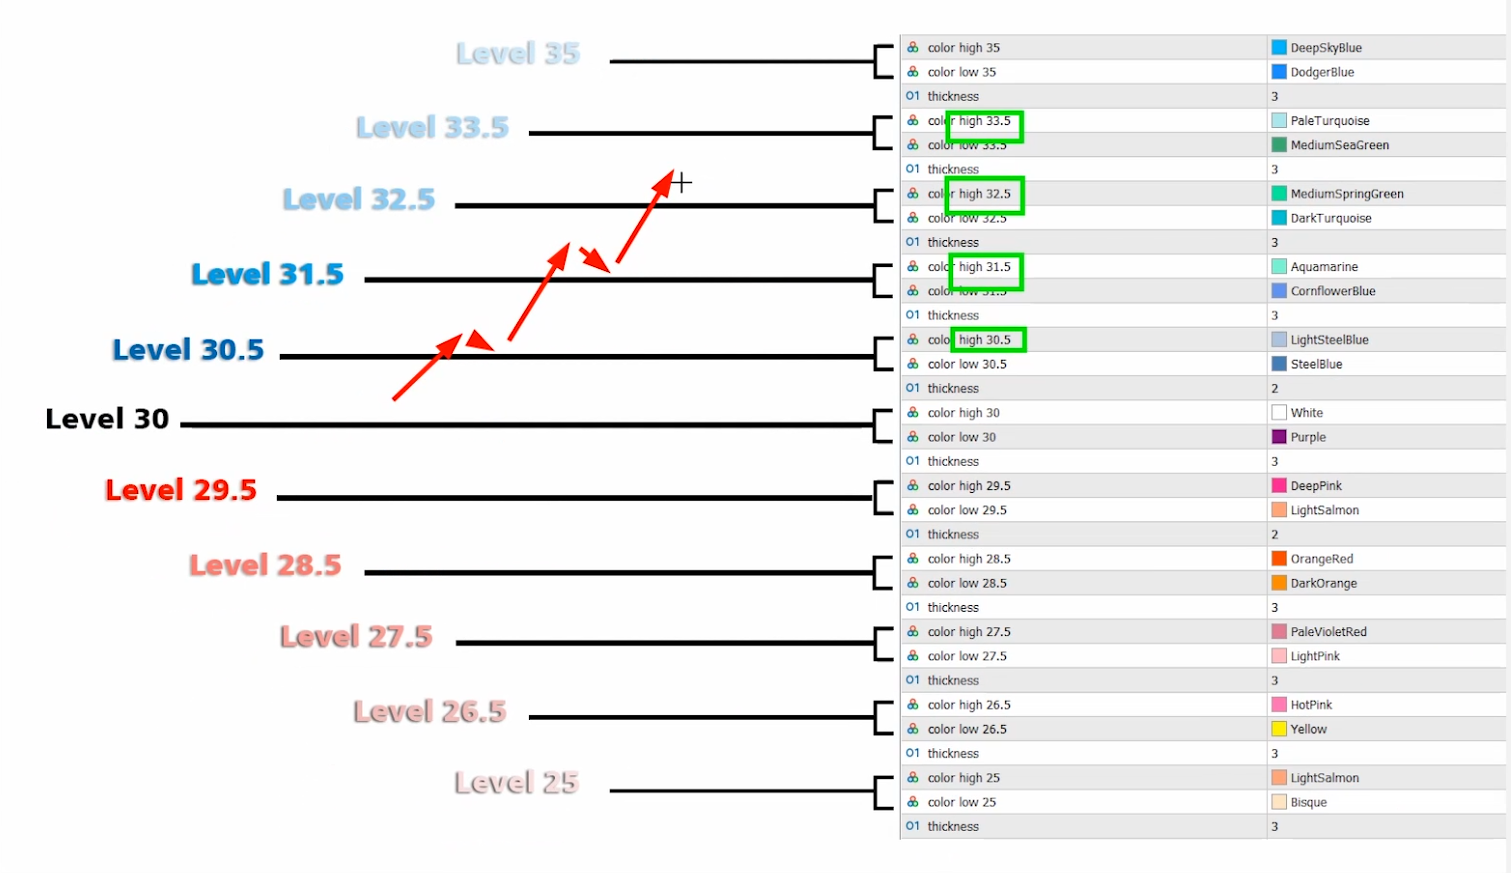
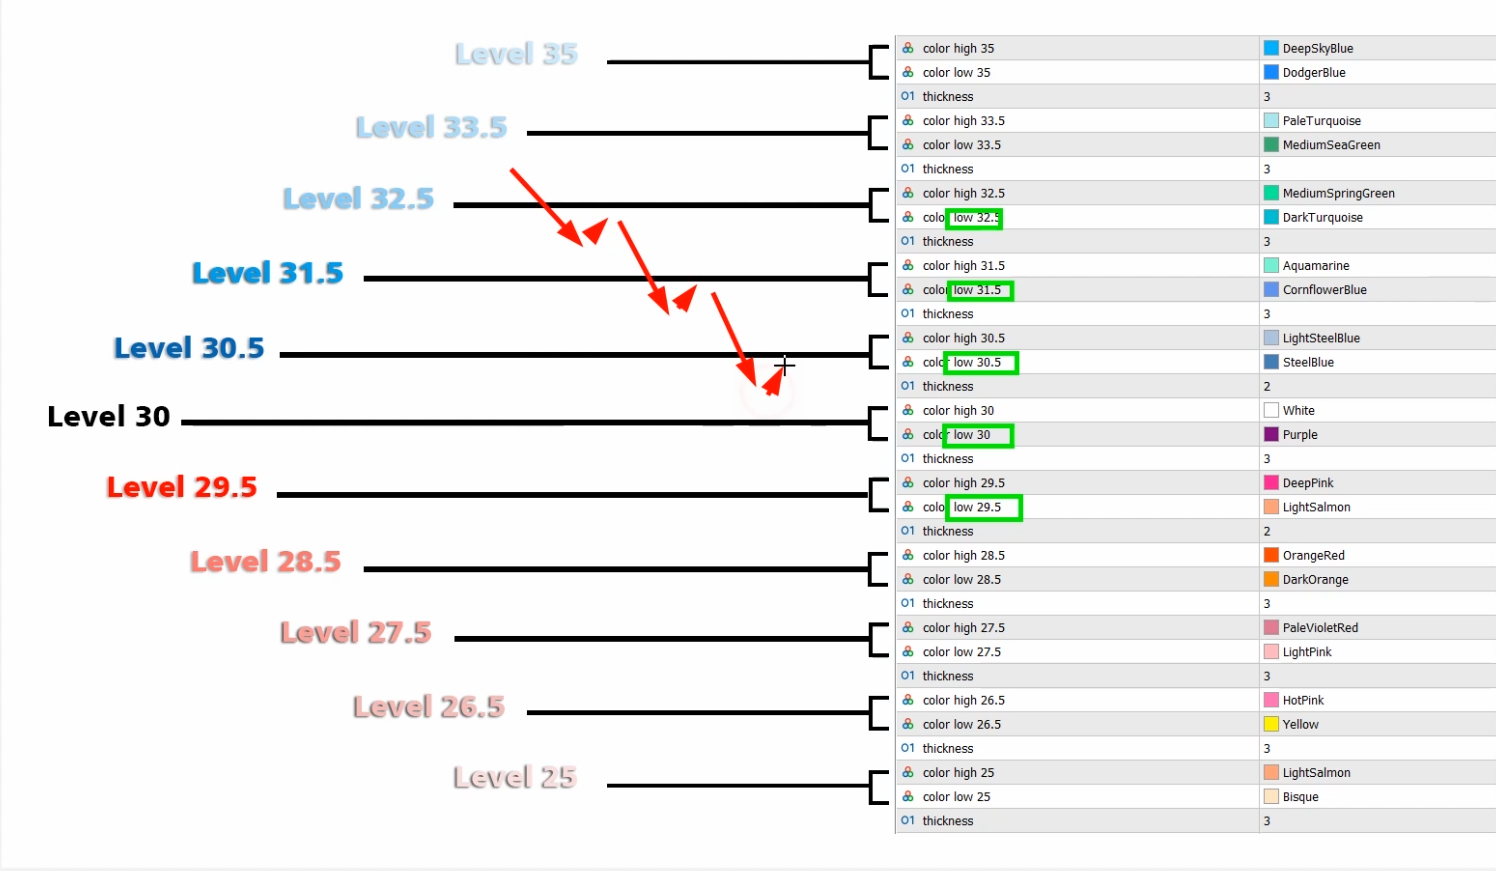
2-Colored levels on chart – Unmatched Accuracy: Exclusive Colored levels system that does not repaint.

3-Dynamic Side Trendlines: Automatically detect trends using candle wicks or bodies. Fully customizable to fit your chart analysis preferences.

4-Dynamic Support and Resistance Lines: Intelligent lines that adapt to price behavior... Switch easily between candle bodies or wicks.

5-Thick Colored Support and Resistance Lines: highly effective for major zones.

6-Rectangles for Sensitive RSI Levels: Highlight critical areas on RSI zones for added clarity.

7-Engulfing and Reversal Candle Patterns: Spot key reversal signals with fully customizable engulfing candles.

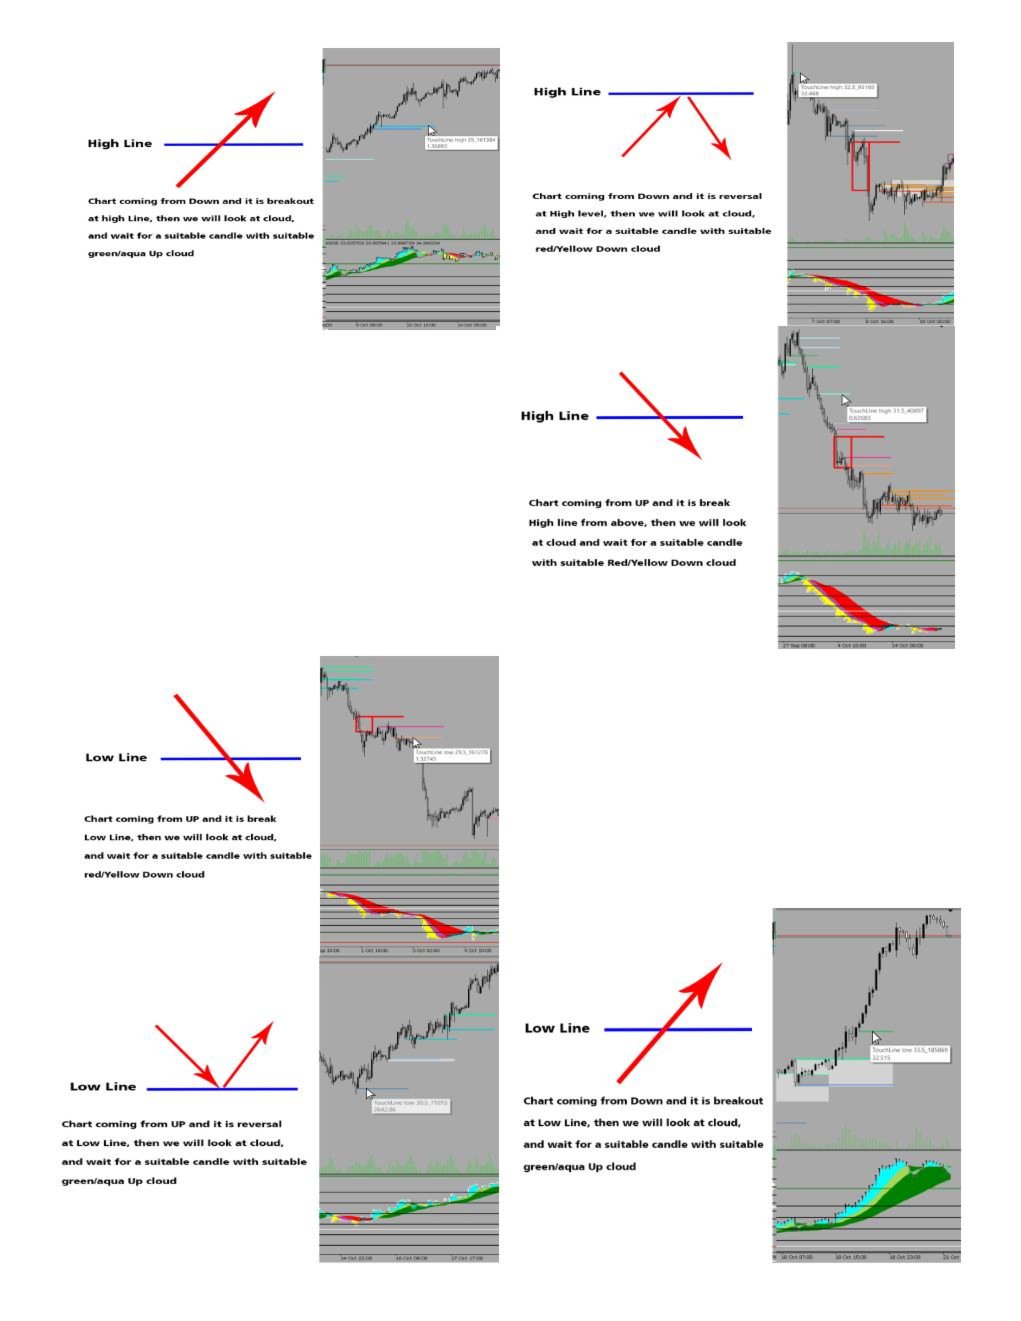
8- Advanced Cloud System: Quickly assess chart positivity or negativity for faster decision-making.

Complete Flexibility: Modify colors, widths, visibility, and settings for most elements easily.

Run tests and tests, watch the real images below, and watch the video, and see how it simplifies the way you analyze and trade.. Continuously monitor price action on the pairs' charts, observing how the level lines are formed, how the price interacts with them realistically, whether it bounces off, breaks through, or hovers around them, all in accordance with many other factors provided by the indicator.

Note: The default settings in the indicator are not necessarily the best. All settings are fully customizable based on your experience. Personally, I use settings that differ from the default ones, tailored to my own preferences for chart analysis.

Please make sure to read the explanation carefully and understand that the indicator is designed for analyzing, understanding, and studying the chart. The decision to open a trade remains entirely yours.


I recommended to use it alongside the "RSI Trend V1" indicator, especially to confirm and match the colored cloud and for arrow signals, in addition to the importance of the Fibonacci indicator and its attached outstanding levels:

https://www.mql5.com/en/market/product/132080


Wishing you all success and profitable trades. 


Reviews 6
purcemputpcp
57
purcemputpcp 2025.03.18 05:21 
 

Good indicator with helpful support 👍

Zone William
51
Zone William 2025.02.24 09:08 
 

I am completely satisfied with this indicator; there is effort and solid underlying content behind it. I am also satisfied with the creator; he is helpful.

David T
303
David T 2024.12.23 06:22 
 

After only 1 day of testing and now seeing this during live market conditions I can already see that this performs as intended . The Engulfing signals do align with the trend and multi time frame confluence is suggested to go with the higher TF...can be used for scalping as well . Seller was every responsive and welcomed my suggestion for an update...looking forward to that if it can be implemented due to the already complexity of the original code. Even though I am 99% on MT4 this indicator made me use my MT5 terminal more and more as I see the potential in this indicator. Got the full version at a great price. Highly recommended

Recommended products
Control Trading Support And Resistance Es un indicador independiente del TimeFrame que permite proyectar niveles más relevantes del mercado en función del plazo de tiempo de la operativa. Los colores del indicador están escogidos para diferenciar entre los diferentes tipos de niveles y destacar a los más relevantes. Este indicador permite visualizar en un mismo gráfico los posibles objetivos relevantes que los diferentes traders pueden emplear siguiendo diferentes tipos de operativas en funció
CandleBot
Mithlesh Kumar Mandal
Introducing CandleBot - Your Ultimate Free Tool for Identifying and Trading Candlestick Patterns! With CandleBot , seize the advantage in the markets by effortlessly recognizing bullish and bearish engulfing, morning and evening star, and hammer signals. Candlestick patterns, derived from open, high, low, and close prices over a specific period, serve as visual representations of price movements, aiding traders in analyzing market sentiment and predicting potential reversals or continuations. U
FREE
This indicator is stand alone version from  MP Pivot Levels  (All in one) containing Woodie Pivots. Woodie’s pivot points are made up of multiple key levels, calculated from past price points, in order to frame trades in a simplistic manner. The key levels include the ‘pivot’ itself, and multiple support and resistance levels (usually up to three each). Traders use these levels as a guide for future price movements when setting up trades. The pivot : (Previous high + previous low + 2 x previous
FREE
The   Pivot Point indicator   automatically calculates and displays the pivot point line and support and resistance levels. Pivot can be calculated according to the Classic, Floor, Fibonacci, Woodie, Camarilla or DeMark formula. It is also possible to select the period for calculating the indicator. A trader can choose from daily, weekly, monthly, or user-defined periods. Types of pivots Classic Floor Fibonacci Woodie Camarilla DeMark Main features The indicator shows the current and historic
FREE
Buy and Sell Power
Marco Engstermann
4 (2)
Simple Indicator that shows the Buy and Sell volume in percent. Settings: Font size for percentage labels Horizontal offset from right edge (pixels) Vertical offset for Signal label from bottom (pixels) Vertical offset for Buy label from bottom (pixels) Vertical offset for Sell label from bottom (pixels) Color for Buy label Color for Sell label Color for Strong Buy signal Color for Buy signal Color for Strong Sell signal Color for Sell signal Color for Neutral signal Default to every tick
FREE
Big Figure Indicator MT5
Vonjinirina Alfred Randrianiaina
4.33 (3)
"BIG FIGURE INDICATOR" automatically identifies and draws horizontal lines on price charts at specific levels, such as whole numbers or half-numbers (e.g., 1.0000 or 1.5000 in currency trading). These levels are considered psychologically significant because they represent round numbers that big traders and investors may focus on, leading to potential support or resistance levels. The big figure indicator can help traders identify important price levels and make trading decisions based on these
FREE
Free automatic Fibonacci is an indicator that automatically plots a Fibonacci retracement based on the number of bars you select on the BarsToScan setting in the indicator. The Fibonacci is automatically updated in real time as new highest and lowest values appears amongst the selected bars. You can select which level values to be displayed in the indicator settings. You can also select the color of the levels thus enabling the trader to be able to attach the indicator several times with differe
FREE
This Pivot Points Indicator can be switched between the following well-known types: Standard/Classic (7 levels)  Woodie (5 levels)  Fibonacci (7 levels)  DeMark (3 levels) Pivot Points are calculated based on the previous day's values - according to the most common formulas on the web - and serve as an important tool for many traders, especially in day trading. They indicate possible resistance and support where increased buyer and seller interest can be expected. A common trading approach, for
Pivot Points are used by Forex traders to find support and resistance levels based on the previous day's price action. There are various ways to calculate pivot points, including averaging the open, high, low, and close of the previous day's chart price. Forex Traders use a combination of pivot points with moving averages to find trading opportunities in the currency markets. Pivot points are very useful tools that use the previous bars' highs, lows and closings to project support and resist
FREE
Horizontal Level indicator - reflects, using a histogram, the horizontal volumes of transactions at a certain price without reference to time. At the same time, the histogram appears directly in the terminal window, and each column of the volume is easily correlated with the quote value of the currency pair. The volume of transactions is of great importance in exchange trading, usually an increase in the number of concluded contracts confirms the trend, and their reduction indicates an imminent
Camarilla Swing Trade Indicator is an Indicator. Support and resistance points are calculated from the High Low Close of the previous TF Week's price. What are Camarilla Pivot Points? 1.Camarilla Pivot Points is a modified version of the classic Pivot Point. 2.Camarilla Pivot Points was launched in 1989 by Nick Scott, a successful bond trader. 3.The basic idea behind Camarilla Pivot Points is that price tends to revert to its mean until it doesn't. 4.Camarilla Pivot Points is a mathematical pr
FREE
The Trend Catcher: The Trend Catcher Strategy with Alert Indicator is a versatile technical analysis tool that aids traders in identifying market trends and potential entry and exit points. It features a dynamic Trend Catcher Strategy , adapting to market conditions for a clear visual representation of trend direction. Traders can customize parameters to align with their preferences and risk tolerance. The indicator assists in trend identification, signals potential reversals, serves as a trail
FREE
Vertical Volume
Kim Yonghwa
4.83 (6)
Features Indicator for check volume for price. Mainly works for EURUSD, other currency fair can be no work or calculation takes long time. For smooth use, Turn on "Shift end of the chart border from right border" as shown in the screenshot When apear new bar Data reset Variables COlOR : Setting of indicator color WIDTH :  Setting of indicator width PERIOD :  Determine the time of period for calculating data
FREE
Auto Fib Retracements
Ross Adam Langlands Nelson
4.2 (5)
Automatic Fibonacci Retracement Line Indicator. This indicator takes the current trend and if possible draws Fibonacci retracement lines from the swing until the current price. The Fibonacci levels used are: 0%, 23.6%, 38.2%, 50%, 61.8%, 76.4%, 100%. This indicator works for all charts over all timeframes. The Fibonacci levels are also recorded in buffers for use by other trading bots. Any comments, concerns or additional feature requirements are welcome and will be addressed promptly. 
FREE
React Fibonacci Chart
Kim Yonghwa
4.91 (11)
Features Indicator for Fibonacci Retracement Trading A Fibonacci chart is drawn based on the previous bar selected among 1H, 4H, 1D, and 1W. When the market price touches the Fibonacci level, the color changes and the touch time is displayed. The Fibonacci graph is drawn at -23.6, 0, 23.6, 38.2, 50, 61.8, 76.4, 100, and 123.6 levels and the chart refreshes when the bar is updated. Variables Timeframe : A Fibonacci chart is drawn with the selected time frame among 1H, 4H, 1D, and 1W. FiboWid
FREE
Online Accounts Manager MT5
Kyra Nickaline Watson-gordon
5 (1)
OneClick Online Account Manager is a powerful utility that helps you to manage all your accounts from a centralized panel. It is suitable for all single account traders and specially for multiple accounts traders. The utility help you to : Monitor status of all accounts on a private web page. Some information such as account connection status, account profit, DD, Balance, Equity, Margin Level, Number of positions and orders, Daily and Weekly profit/loss and also overall summation of all these p
MT5 Sync Tools
Mohammad Reza Anari
Supercharge Your MetaTrader Analysis and Trading with Meta Sync Tools! Struggling to analyze price action across different timeframes? Meta Sync Tools eliminates the frustration of unsynced crosshairs and charts, allowing seamless multi-timeframe analysis. Missing key correlations between assets and constantly switching between charts? Meta Sync Tools empowers you to visualize relationships between instruments effortlessly.  Tired of wasting time on repetitive tasks? With 30+ Customizable Short
FaU fibo
Aleksandr Dementev
The indicator draws actual Fibonacci levels for your trading activity. The levels are redrawn every time after the price touches the low (0%) or the 100% fibonacci level. In the parameters, select the trading activity: Long term investor Medium term investor Medium-term investor active Short term investor Short-term investor active Speculator Speculator active Scalper Scalper active Try this indicator in action, and you will no longer have to look for coordinates for drawing fibonacci levels.
FREE
Volume Trade Levels
Mahmoud Sabry Mohamed Youssef
The idea behind this indicator is very simple , First it contains 2 mechanisms to place your trades: 1- Enter the Pips you want to duplicate to price levels. 2- Automatically let the indicator specify the largest Buy / Sell Volume Candle and place duplicated levels based on the candle itself. How it works: 1- Enter the Pips you want to duplicate to price levels:    1- once the indicator is loaded you will need first to Specify the number of pips in the indicator Configuration window ,you can g
Stop Loss with Profit Free Version*. Complete Version here. This utility / expert for MetaTrader 5 modifies the stop loss of all your operations dynamically and automatically to ensure the minimum benefits you want, and be able to operate with or without Take Profit. Maximize your benefits, by being able to trade with Unlimited Take Profit. You will ensure the number of minimum points you want to earn in each operation and the stop loss will be adjusted as long as the benefit of the operatio
FREE
AliPivot Points is a Meta Trader 5 Indicator that draws you the latest pivot points. You can choose from timeframes ranging from 1 Minute to 1 Month. Calculation methods for pivot points includes: Classic Pivot Points Camarilla Pivot Points Fibonacci Pivot Points Woodie Pivot Points You can personalize the line colors, style, and width to suit your preference. The indicator displays values on the right side of the chart. AliPivot Points values can also be utilized by developers for creating Expe
FREE
The Easy Trend Trading Indicator delivers quick and accurate BUY/SELL signals, ensuring that traders can make timely decisions. It works flawlessly across various timeframes and supports all symbols, making it a versatile tool for any market. Whether you're trading short-term or long-term, this indicator adapts to your needs with ease. Quick Setup: Simply "Enable" the indicator via input settings With a low memory footprint, the indicator is designed for efficiency, ensuring smooth performance e
CChart
Rong Bin Su
Overview In the fast-paced world of forex and financial markets, quick reactions and precise decision-making are crucial. However, the standard MetaTrader 5 terminal only supports a minimum of 1-minute charts, limiting traders' sensitivity to market fluctuations. To address this issue, we introduce the Second-Level Chart Candlestick Indicator , allowing you to effortlessly view and analyze market dynamics from 1 second to 30 seconds on a sub-chart. Key Features Support for Multiple Second-Level
TransitTrendlines
Bonginkosi Innocent Khumalo
TransitTrendlines this is a automatically trendline drawer, it draw both horizontal and diagonal trendlines. The horizontal trendlines are the pivot points of the day timeframe and the diagonal trendlines are based on the current time frames. You can adjust the diagonal trendlines by increasing the number of bars to draw the diagonal trendline and can also adjust the steepness. Note that the Horizontal trendlines are based on the day pivot points not currant time frame. Join mql5 transitbk98 cha
FREE
An indicator of pattern #54 ("Dead cat bounce") from Encyclopedia of Chart Patterns by Thomas N. Bulkowski. Parameters: Alerts - show alert when an arrow appears   Push - send a push notification when an arrow appears (requires configuration in the terminal) PeriodBars - indicator period ArrowType - a symbol from 1 to 17 ArrowVShift - vertical shift of arrows in pixels. Note. Arrows appear on a forming bar and do not disappear.   It cannot be guaranteed that the indicator recognizes the patter
Fibonacci automatically draws Fibonacci retracement, Because Fibonacci automatically draws Fibonacci retracement, you can know at a glance the price to buy at a push or sell back. Therefore, you can trade in favorable conditions in a trending market. We are live-streaming the actual operation of the system. Please check for yourself if it is usable. Please check it out for yourself. https://www.youtube.com/@ganesha_forex We do not guarantee your investment results. Investments should be made
The utility draws pivot levels for the selected timefram in classic method. Pivot = (high + close + low) / 3 R1 = ( 2 * Pivot) - low S1 = ( 2 * Pivot) - high R2 = Pivot + ( high - low ) R3 = high + ( 2 * (Pivot - low)) S2 = Pivot - (high - low) S3 = low - ( 2 * (high - Pivot)) you can change the timeframe, colors and fontsize. also you can change the text for the levels. Have fun and give feedback...
FREE
How the day starts
Sergio Antoni Escudero Tirado
This indicator draws the high intraday price and the low intraday price of the first n minutes of the day. The chart shows the days with vertical lines and two horizontal lines to indicate the max and the min close price of the n first minutes of the day. The max/min lines start and end with the day calculated. With this indicator you can see how starts the day compared with the previous days. It is valid for any market inasmuch as the start time is calculated with the data received. Parameter
FREE
TS Time Remaining
Aurelio Manuel Peral Garcia
TS Time Remaining - Indicador de Cuenta Regresiva para Velas en MetaTrader 5 El TS Time Remaining es un indicador gratuito diseñado para la plataforma MetaTrader 5 que permite a los traders visualizar en tiempo real el tiempo restante de la vela actual. Esta herramienta es especialmente útil para aquellos operadores que trabajan con estrategias basadas en la acción del precio y patrones de velas japonesas, ya que les permite anticiparse al cierre de la vela y tomar decisiones con mayor precisión
FREE
Pivot Points Levels Description The Pivot Points Levels indicator is an advanced and comprehensive tool for technical analysis based on support and resistance levels calculated from pivot points. This free indicator combines 6 different calculation methods with support for multiple timeframes, offering a robust solution for identifying key price reversal and continuation areas. Key Features 6 Calculation Methods : Traditional, Fibonacci, Woodie, Classic, DeMark (DM), and Camarilla Multi-Timefram
FREE
Buyers of this product also purchase
Divergence Bomber
Ihor Otkydach
5 (4)
Each buyer of this indicator also receives the following for free: The custom utility "Bomber Utility", which automatically manages every trade, sets Stop Loss and Take Profit levels, and closes trades according to the rules of this strategy Set files for configuring the indicator for various assets Set files for configuring Bomber Utility in the following modes: "Minimum Risk", "Balanced Risk", and "Wait-and-See Strategy" A step-by-step video manual to help you quickly install, configure, and s
Golden Trend Indicator MT5
Noha Mohamed Fathy Younes Badr
4.89 (18)
Golden Trend indicator  is The best indicator for predicting trend movement this indicator never lags and never repaints and never back paints    and give  arrow buy and sell    before the candle appear  and it will help you and  will make your trading decisions clearer its work on all currencies and  gold and crypto and all time frame This unique  indicator uses very secret algorithms to catch the  trends, so you can trade using this indicator and see the trend clear on charts  manual guide and
NOTE: CYCLEMAESTRO is distributed only on this website, there are no other distributors. Demo version is for reference only and is not supported. Full versione is perfectly functional and it is supported. CYCLEMAESTRO , the first and only indicator of Cyclic Analysis, useful for giving signals of TRADING, BUY, SELL, STOP LOSS, ADDING. Created on the logic of   Serghei Istrati   and programmed by   Stefano Frisetti ;   CYCLEMAESTRO   is not an indicator like the others, the challenge was to inter
Algo Pumping
Ihor Otkydach
5 (11)
PUMPING STATION – Your Personal All-inclusive strategy Introducing PUMPING STATION — a revolutionary Forex indicator that will transform your trading into an exciting and effective activity! This indicator is not just an assistant but a full-fledged trading system with powerful algorithms that will help you start trading more stable! When you purchase this product, you also get FOR FREE: Exclusive Set Files: For automatic setup and maximum performance. Step-by-step video manual: Learn how to tr
MonetTrend — Премиум-индикатор для торговли по тренду (M30, H1, H4) MonetTrend — это мощный и визуально понятный трендовый индикатор, созданный для торговли на таймфреймах M30, H1 и H4. Он идеально подходит для работы с волатильными инструментами, такими как: • Золото (XAUUSD) • Криптовалюты (BTCUSD) • Валютные пары (EURUSD, USDJPY и др.) Ключевые особенности MonetTrend: • Автоматическое отображение Take Profit 1 (TP1) и Stop Loss (SL): После появления сигнала индикатор сразу показывает: • TP
TPSproTREND PrO MT5
Roman Podpora
4.72 (18)
Entry points at the bar close,  without redrawing .  Trend scanner  across all assets,  MTF - mode  and much more in one tool. We recommend using it together with   RFI LEVELS. ИНСТРУКЦИЯ RUS   /   INSTRUCTIONS  ENG         /         VERSION MT4   Main functions: Accurate entry signals WITHOUT REPAINTING! Once a signal appears, it remains valid! This is a significant distinction from repainting indicators that might provide a signal and then alter it, potentially leading to deposit losses. Now,
RelicusRoad Pro MT5
Relicus LLC
4.79 (19)
How many times have you bought a trading indicator with great back-tests, live account performance proof with fantastic numbers and stats all over the place but after using it, you end up blowing your account? You shouldn't trust a signal by itself, you need to know why it appeared in the first place, and that's what RelicusRoad Pro does best! User Manual + Strategies + Training Videos + Private Group with VIP Access + Mobile Version Available A New Way To Look At The Market RelicusRoad is th
Quantum TrendPulse
Bogdan Ion Puscasu
5 (13)
Introducing Quantum TrendPulse , the ultimate trading tool that combines the power of SuperTrend , RSI , and Stochastic into one comprehensive indicator to maximize your trading potential. Designed for traders who seek precision and efficiency, this indicator helps you identify market trends, momentum shifts, and optimal entry and exit points with confidence. Key Features: SuperTrend Integration: Easily follow the prevailing market trend and ride the wave of profitability. RSI Precision: Detect
TPSpro RFI Levels MT5
Roman Podpora
4.55 (20)
Reversal zones / Peak volumes / Active zones of a major player =  TS TPSPROSYSTEM INSTRUCTIONS RUS  /  INSTRUCTIONS   ENG          /       Version MT4 Every buyer of this indicator additionally receives FREE: 3 months of access to trading signals from the RFI SIGNALS service - ready-made entry points according to the TPSproSYSTEM algorithm. Training materials with regular updates - immerse yourself in strategy and grow your professional level. 24/5 support on weekdays and access to a closed tra
MONEYTRON – ТВОЙ ЛИЧНЫЙ СИГНАЛ НА УСПЕХ! XAUUSD | AUDUSD | USDJPY | BTCUSD Поддержка таймфреймов: M5, M15, M30, H1 Почему трейдеры выбирают Moneytron? 82% успешных сделок — это не просто цифры, это результат продуманной логики, точного алгоритма и настоящей силы анализа. Автоматические сигналы на вход — не нужно гадать: когда покупать, когда продавать. 3 уровня Take Profit — ты сам выбираешь свой уровень прибыли: безопасный, уверенный или максимум. Четкий Stop Loss — контролируешь риск
FX Volume MT5
Daniel Stein
4.82 (17)
FX Volume: Experience Genuine Market Sentiment from a Broker’s Perspective Quick Overview Looking to elevate your trading approach? FX Volume provides real-time insights into how retail traders and brokers are positioned—long before delayed reports like the COT. Whether you’re aiming for consistent gains or simply want a deeper edge in the markets, FX Volume helps you spot major imbalances, confirm breakouts, and refine your risk management. Get started now and see how genuine volume data can
MetaForecast M5
Vahidreza Heidar Gholami
5 (3)
MetaForecast predicts and visualizes the future of any market using different powerful methods. While financial markets are not always predictable, if there are patterns in the past data, MetaForecast can learn and predict the future as accurately as possible. It features a complete implementation of neural networks embedded directly into the indicator, enabling traders to create and train AI models using data from multiple symbols to learn complex patterns. MetaForecast leverages your computer'
CBT Quantum Maverick High-Efficiency Binary Trading System CBT Quantum Maverick is a finely tuned, high-performance Binary Options Trading System designed for traders seeking precision, simplicity, non-repaint signals and disciplined trading. No customization is required—this system is optimized for effective results right out of the box. Simply follow the signals, which can be mastered with a bit of practice. Key Features: Signal Precision: New-bar-based trading signals—targeting the next ca
Best Solution for any Newbie or Expert Trader! This Indicator is a unique, high quality and affordable trading tool because we have incorporated a number of proprietary features and a new formula. With only ONE chart you can read Currency Strength for 28 Forex pairs! Imagine how your trading will improve because you are able to pinpoint the exact trigger point of a new trend or scalping opportunity? User manual:   click here That's the first one, the original! Don't buy a worthless wannabe clone
Gold Trend 5
Sergei Linskii
3.5 (2)
Gold Trend - this is a good stock technical indicator. The indicator algorithm analyzes the price movement of an asset and reflects volatility and potential entry zones. The best indicator signals: For SELL = red histogram + red SHORT pointer + yellow signal arrow in the same direction. For BUY = blue histogram + blue LONG pointer + aqua signal arrow in the same direction. Benefits of the indicator: The indicator produces signals with high accuracy. A confirmed arrow signal can only be redrawn
This dashboard shows the latest available   harmonic patterns   for the selected symbols, so you will save time and be more efficient /   MT4 version . Free Indicator:   Basic Harmonic Pattern Comparison of "Basic Harmonic Pattern" vs. "Basic Harmonic Patterns Dashboard" Indicators Feature Basic Harmonic Pattern Basic Harmonic Patterns Dashboard Functionality Detects and displays harmonic patterns on a single chart Searches multiple symbols and timeframes for harmonic patterns, displays res
MetaBands M5
Vahidreza Heidar Gholami
4.5 (2)
MetaBands uses powerful and unique algorithms to draw channels and detect trends so that it can provide traders with potential points for entering and exiting trades. It’s a channel indicator plus a powerful trend indicator. It includes different types of channels which can be merged to create new channels simply by using the input parameters. MetaBands uses all types of alerts to notify users about market events. Features Supports most of the channel algorithms Powerful trend detection algorith
Introducing   Quantum Breakout PRO , the groundbreaking MQL5 Indicator that's transforming the way you trade Breakout Zones! Developed by a team of experienced traders with trading experience of over 13 years,   Quantum Breakout PRO   is designed to propel your trading journey to new heights with its innovative and dynamic breakout zone strategy. Quantum Breakout Indicator will give you signal arrows on breakout zones with 5 profit target zones and stop loss suggestion based on the breakout b
First of all, it's worth emphasizing that this Trading Indicator is Non-Repainting, Non-Redrawing, and Non-Lagging, which makes it ideal for both manual and algorithmic trading. User manual, presets, and online support included. The AI Trend Pro Max is a sophisticated, all-in-one trading system designed for traders who seek precision , power , and simplicity . Built upon years of development through previous indicators, and this is the most advanced version yet — equipped with multiple signal la
Trend Forecaster
Alexey Minkov
5 (6)
The Trend Forecaster indicator utilizes a unique proprietary algorithm to determine entry points for a breakout trading strategy. The indicator identifies price clusters, analyzes price movement near levels, and provides a signal when the price breaks through a level. The Trend Forecaster indicator is suitable for all financial assets, including currencies (Forex), metals, stocks, indices, and cryptocurrencies. You can also adjust the indicator to work on any time frames, although it is recommen
Grabber System MT5
Ihor Otkydach
5 (6)
Let me introduce you to an excellent technical indicator – Grabber, which works as a ready-to-use "All-Inclusive" trading strategy. Within a single code, it integrates powerful tools for technical market analysis, trading signals (arrows), alert functions, and push notifications. Every buyer of this indicator also receives the following for free: Grabber Utility for automatic management of open orders Step-by-step video guide: how to install, configure, and trade with the indicator Custom set fi
IQ Gold Gann Levels a non-repainting, precision tool designed exclusively for XAUUSD/Gold intraday trading. It uses W.D. Gann’s square root method to plot real-time support and resistance levels, helping traders spot high-probability entries with confidence and clarity. William Delbert Gann (W.D. Gann) was an exceptional market analyst, whose trading technique was based on a complex blend of mathematics, geometry, astrology, and ancient mathematics which proved to be extremely accurate. Download
MTF Supply Demand Zones MT5
Georgios Kalomoiropoulos
5 (1)
Next Generation Of Automated Supply And Demand Zones. New and Innovative Algorithm that Works At Any Chart. All Zones Are Being Created Dynamically According To Price Action Of The Market. AMAZING OFFER --> Activations from 5 to 20 for "MTF Supply Demand Zones" and "Automated Trendlines" TWO TYPES OF ALERTS -->  1) WHEN PRICE HITS A ZONE    2)WHEN A NEW ZONE IS FORMED  If you get the MTF Supply Demand Zones you can join the " Trade Like Me " Video Series. It contains 14 Live Sessions where 
Top indicator for MT5   providing accurate signals to enter a trade without repainting! It can be applied to any financial assets:   forex, cryptocurrencies, metals, stocks, indices .  Watch  the video  (6:22) with an example of processing only one signal that paid off the indicator! MT4 version is here It will provide pretty accurate trading signals and tell you when it's best to open a trade and close it. Most traders improve their trading results during the first trading week with the help of
Best Solution for any Newbie or Expert Trader! This indicator is a unique, high quality and affordable trading tool because we have incorporated a number of proprietary features and a secret formula. With only ONE chart it gives Alerts for all 28 currency pairs. Imagine how your trading will improve because you are able to pinpoint the exact trigger point of a new trend or scalping opportunity! Built on new underlying algorithms it makes it even easier to identify and confirm potential trades.
Gold TMAF MTF  - this is a good stock technical indicator. The indicator algorithm analyzes the price movement of an asset and reflects volatility and potential entry zones. The best indicator signals: For SELL = red upper boundary of TMA2 above the red upper boundary of TMA1 + red fractal indicator above + yellow SR signal arrow in the same direction. For BUY = blue lower boundary of TMA2 below the blue lower boundary of TMA1 + blue fractal indicator from below + aqua SR signal arrow in the sam
FxaccurateLS
Shiv Raj Kumawat
WHY IS OUR FXACCCURATE LS MT5 THE PROFITABLE ? PROTECT YOUR CAPITAL WITH RISK MANAGEMENT Gives entry, stop and target levels from time to time. It finds Trading opportunities by analyzing what the price is doing during established trends. POWERFUL INDICATOR FOR A RELIABLE STRATEGIES We have made these indicators with a lot of years of hard work. It is made at a very advanced level. Established trends provide dozens of trading opportunities, but most trend indicators completely ignore them! The
Trade smarter, not harder: Empower your trading with Harmonacci Patterns This is arguably the most complete harmonic price formation auto-recognition indicator you can find for the MetaTrader Platform. It detects 19 different patterns, takes fibonacci projections as seriously as you do, displays the Potential Reversal Zone (PRZ) and finds suitable stop-loss and take-profit levels. [ Installation Guide | Update Guide | Troubleshooting | FAQ | All Products ] It detects 19 different harmonic pri
The starting price is $75. It will increase to $120 after 30 sales. After purchase, please contact me to get your trading tips + more information for a great bonus!   Lux Trend   is a professional strategy based on using Higher Highs and Lower Highs to identify and draw Trendline Breakouts!   Lux Trend  utilizes two Moving Averages to confirm the overall trend direction before scanning the market for high-quality breakout opportunities, ensuring more accurate and reliable trade signals. This
MACD Intraday Trend PRO is an Indicator developed through an adaptation made of the original MACD created by Gerald Appel in the 1960s. Through years of trading it was observed that by changing the parameters of the MACD with Fibonacci proportions we achieve a better presentation of the continuity of the trend movements, making that it is possible to more efficiently detect the beginning and end of a price trend. Due to its efficiency in detecting price trends, it is also possible to identify ve
More from author
Time Candle Suleiman
Suleiman Alhawamdah
5 (3)
Important Note: The image shown in Screenshots is of my indicators, Suleiman Levels indicator and RSI Trend V indicator, including of course attached "Time Candle", which is originally part of the comprehensive indicator for advanced analysis and exclusive levels, Suleiman Levels. if you like  try "RSI Trend V" Indicator: https://www.mql5.com/en/market/product/132080 and if you like try "Suleiman Levels" Indicator: https://www.mql5.com/en/market/product/128183 Time Candle Suleiman indicator is
FREE
RSI Trend V1
Suleiman Alhawamdah
"RSI Trend V" Indicator is designed for trend identification and is integrated with Fibonacci to determine target zones and potential reversals. It includes bullish and bearish arrows that appear in potential price movement reversal areas. However, the key elements to focus on are: -Thick blue line - Uptrend -Thick yellow line - Downtrend -Green cloud above the thick green line -Red cloud below the thick yellow line -Bullish and bearish arrows Important Note:   "Some of the images" shown in the
IMPORTANT: THIS EXPERT IS FOR DATA HISTORICAL DOWNLOAD ONLY DOES NOT EXECUTE ANY TRADING OPERATIONS - Expert Advisor Function : To download historical data accurately, correctly, and quickly. - Need for It : Sometimes, we notice that certain indicators containing drawings, graphics, lines, and arrows behave strangely when placed on the chart or when switching between timeframes. The drawings and lines may move unnaturally on the main screen. This issue arises due to a lack of necessary data th
FREE
Filter:
purcemputpcp
57
purcemputpcp 2025.03.18 05:21 
 

Good indicator with helpful support 👍

Suleiman Alhawamdah
6674
Reply from developer Suleiman Alhawamdah 2025.03.19 20:27
Thank you my friend.. You are welcome and I wish you all the best
Zone William
51
Zone William 2025.02.24 09:08 
 

I am completely satisfied with this indicator; there is effort and solid underlying content behind it. I am also satisfied with the creator; he is helpful.

Suleiman Alhawamdah
6674
Reply from developer Suleiman Alhawamdah 2025.02.24 15:02
All my thanks to you my friend Zone. Your words reflect your nobility and character... I wish you all the best.
Boluwatife_06
30
Boluwatife_06 2025.01.30 12:37 
 

User didn't leave any comment to the rating

Suleiman Alhawamdah
6674
Reply from developer Suleiman Alhawamdah 2025.01.30 14:10
thank you Boluwatife for your support and review.
I truly appreciate it. At the moment, I don’t have a group, as managing one requires time and responsibility. However, I think the idea of a group for sharing ideas is great, especially since using the indicator and Levels with certain trading and financial analysis methods, such as ICT or other, leads to very positive results.
Sebastian Schmidt
1266
Sebastian Schmidt 2025.01.20 12:59 
 

User didn't leave any comment to the rating

Suleiman Alhawamdah
6674
Reply from developer Suleiman Alhawamdah 2025.01.25 19:24
Thank you very much, Mr. Sebastian, for your kind review...truly appreciate your encouragement.
I wish you success and good luck in your chart analysis.
micllAblen
65
micllAblen 2025.01.12 19:06 
 

User didn't leave any comment to the rating

Suleiman Alhawamdah
6674
Reply from developer Suleiman Alhawamdah 2025.01.13 22:06
Thank you so much. I was pleased with your review. I wish you all the best with your strategy.
David T
303
David T 2024.12.23 06:22 
 

After only 1 day of testing and now seeing this during live market conditions I can already see that this performs as intended . The Engulfing signals do align with the trend and multi time frame confluence is suggested to go with the higher TF...can be used for scalping as well . Seller was every responsive and welcomed my suggestion for an update...looking forward to that if it can be implemented due to the already complexity of the original code. Even though I am 99% on MT4 this indicator made me use my MT5 terminal more and more as I see the potential in this indicator. Got the full version at a great price. Highly recommended

Suleiman Alhawamdah
6674
Reply from developer Suleiman Alhawamdah 2024.12.23 09:43
Thank David so much, for your kind review.
I will try to add the timeframes soon, but as I mentioned, this might take some time since the code for the levels is very large, complex, and interconnected with other codes.
I wish you all the best and success in your trading!
Reply to review
Version 7.7 2025.03.21
SULEIMAN LEVELS v 7.7:

A minor fix for the previous update v 7.6, related to two types of side trendlines.
Version 7.6 2025.03.21
SULEIMAN LEVELS v7.6:

1- Reconstruction of two types of side trendlines (which are usually in light colors: Uptrend in Honeydew color and Downtrend in LavenderBlush). These trendlines have been completely rebuilt to draw their lines using a different mechanism than before, based on new peak and trough detection rules.
The other dark trendlines (green or brown) still operate using the same mechanism.

2-Updates to the default settings for black support and resistance lines: The number of past candles will now be 20-30-40, with Line #3 enabled by default.."You can hide the third line or make any modifications through the control panel".

3-Various fixes and improvements.
Version 7.5 2025.03.14
SULEIMAN LEVELS v 7.5:

-Keeping the manual drawing of rectangles and trend lines without automatic deletion after changing the time frame or switching between pairs.
-Some improvements and fixes for minor issues.
Version 7.4 2025.03.09
SULEIMAN LEVELS v 7.4:

Some minor fixes and improvements.
Version 7.3 2025.03.07
SULEIMAN LEVELS v 7.3:

1-Added floating buttons for quick switching between candle bodies or wicks for side trendlines.
2-Added floating buttons for quick switching between candle bodies or wicks for support and resistance lines.
"There may sometimes be a very slight delay due to data processing" so Still under testing and improvements.

The market must be open for the switching to take effect.
The focus of switching is on side trendlines because the chart may sometimes rely on wicks for its movements or on the candle body.
3-Adjustments and Enhancements:
-Reset some default settings (All settings are adjustable according to your analysis preferences).
-Adjusted the previous candle check settings for side trendlines to 10-15-30-45.
-Adjusted the previous candle check settings for support and resistance lines to 20-30-50.
Note:
It is not necessary to enable all features in the indicator at once. Doing so may cause analysis confusion and overwhelm you. Essential elements such as colored level lines, side trendlines, support and resistance lines, pullbacks, and thick-colored support and resistance lines might be sufficient.

The remaining settings are optional—you can enable them and assess whether they add value to your analysis or serve as extra precautions for all possible scenarios.
Version 7.1 2025.02.24
SULEIMAN LEVELS v 7.1:

1- Updating the option related to "thick colored lines" for displaying Touching Sup/Res Line or Retesting Previous Top/Bottom.
2- Controlling the number of previous candles used to calculate Sup/Res Line or Retesting Previous Top/Bottom for "thick colored lines".
3- Option to display only the last two thick colored lines or all lines (default: last two thick lines, which is recommended).
- and Control over line colors.
- Adding explanatory notes about Modes for the Touch Line level types.
4- Changing the default settings for the number of previous candles used to calculate Support/Resistance Lines and Side Trend Lines from 15-30-60 to 10-15-30. Of course, you can choose different values as you see fit to display Support/Resistance Lines and Side Trend Lines.
5- General improvements.
Version 7.0 2025.02.16
SULEIMAN LEVELS v7.00:
Some improvements to enhance the efficiency and accuracy of the indicator.
Added an option to show or hide the "white text for tips."
Updated some default settings of the indicator.
Version 6.0 2025.01.16
SULEIMAN LEVELS v 6.00
Fixing some errors, and disappearance of some lines due to chart update.
Version 5.0 2025.01.14
SULEIMAN LEVELS v 5.00

Fixed some minor bugs.
Version 4.0 2025.01.11
SULEIMAN LEVELS v 4.00

Fixing some minor bugs, removing remnants of some old and accumulated touchline lines.


Version 3.0 2025.01.04
SULEIMAN LEVELS v 3.00
Now you can draw manual trend lines on the chart without them being automatically deleted after changing the time frame or switching to another pair.
Version 2.0 2024.12.17
SULEIMAN LEVELS v 2.00
Full control over lower cloud settings:
Line Cloud 1
Line Cloud 2
Line Cloud 3
Line Cloud 4