• Genel bakış
  • İncelemeler (6)
  • Yorumlar (8)
  • Yenilikler

Suleiman Levels

5

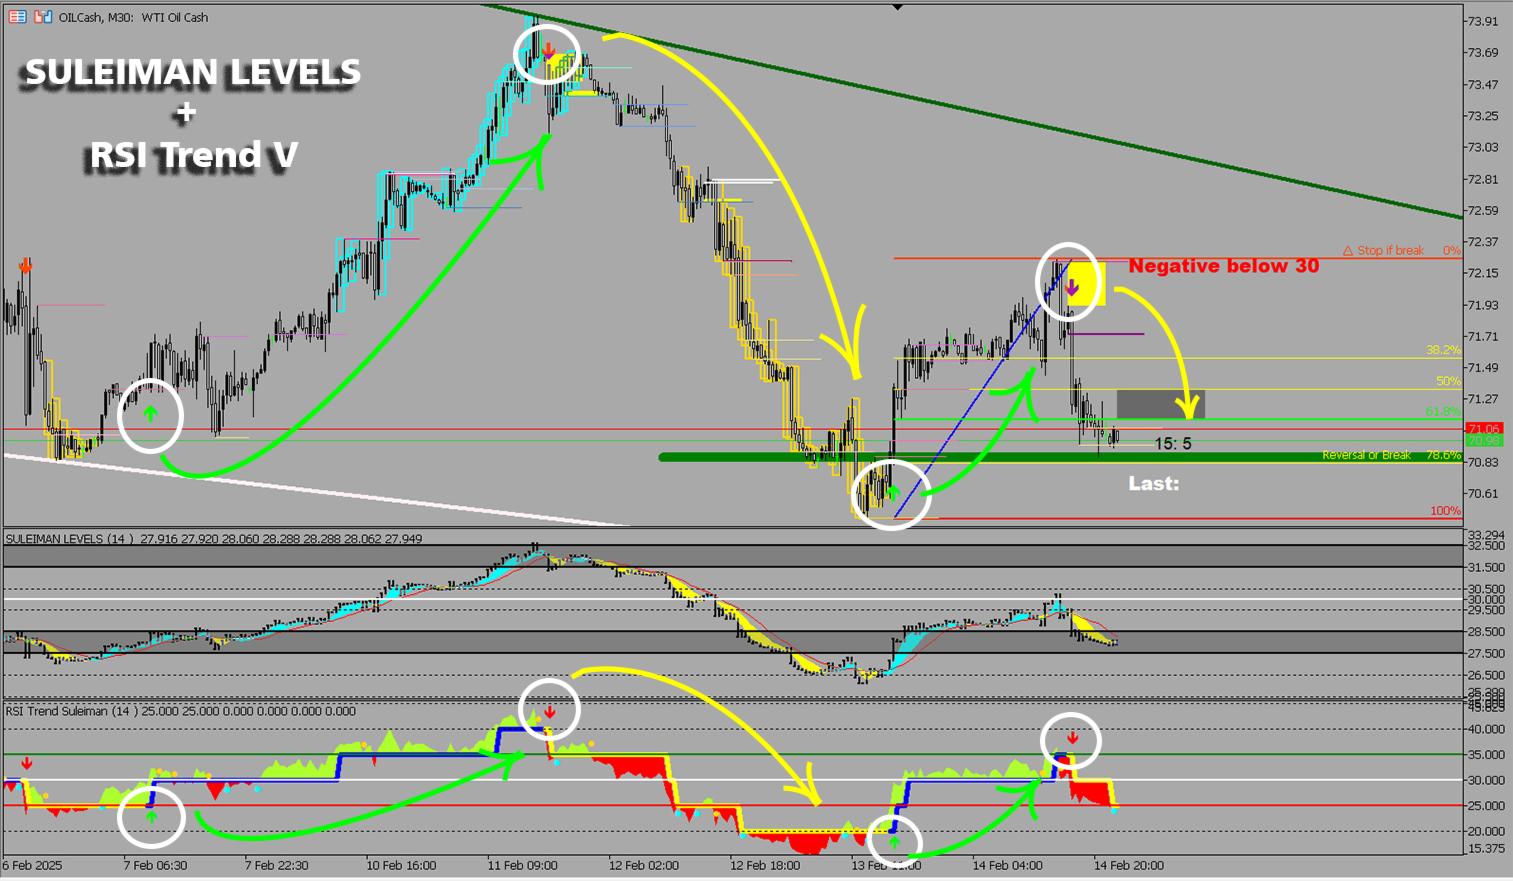
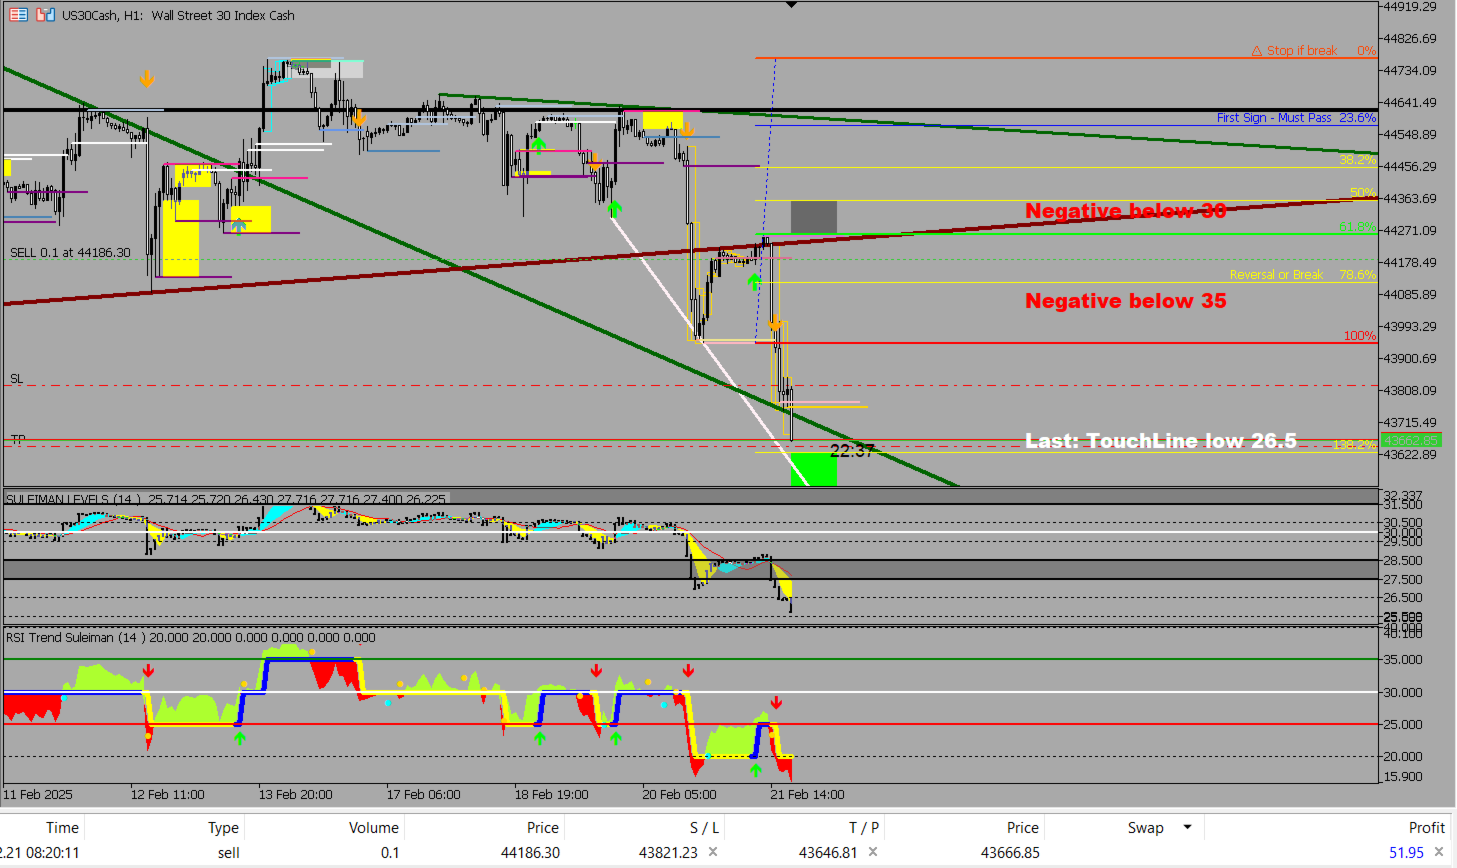
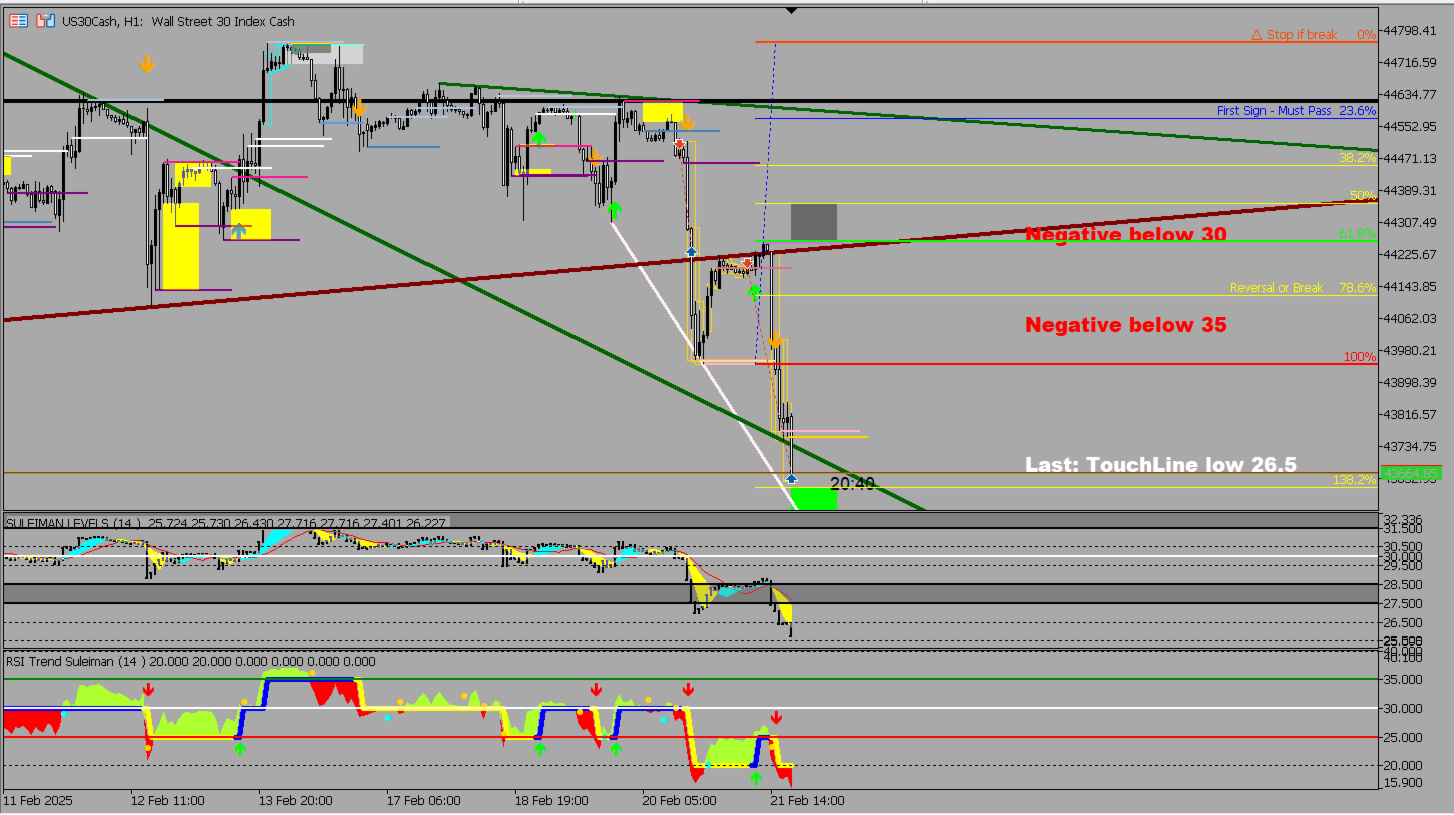
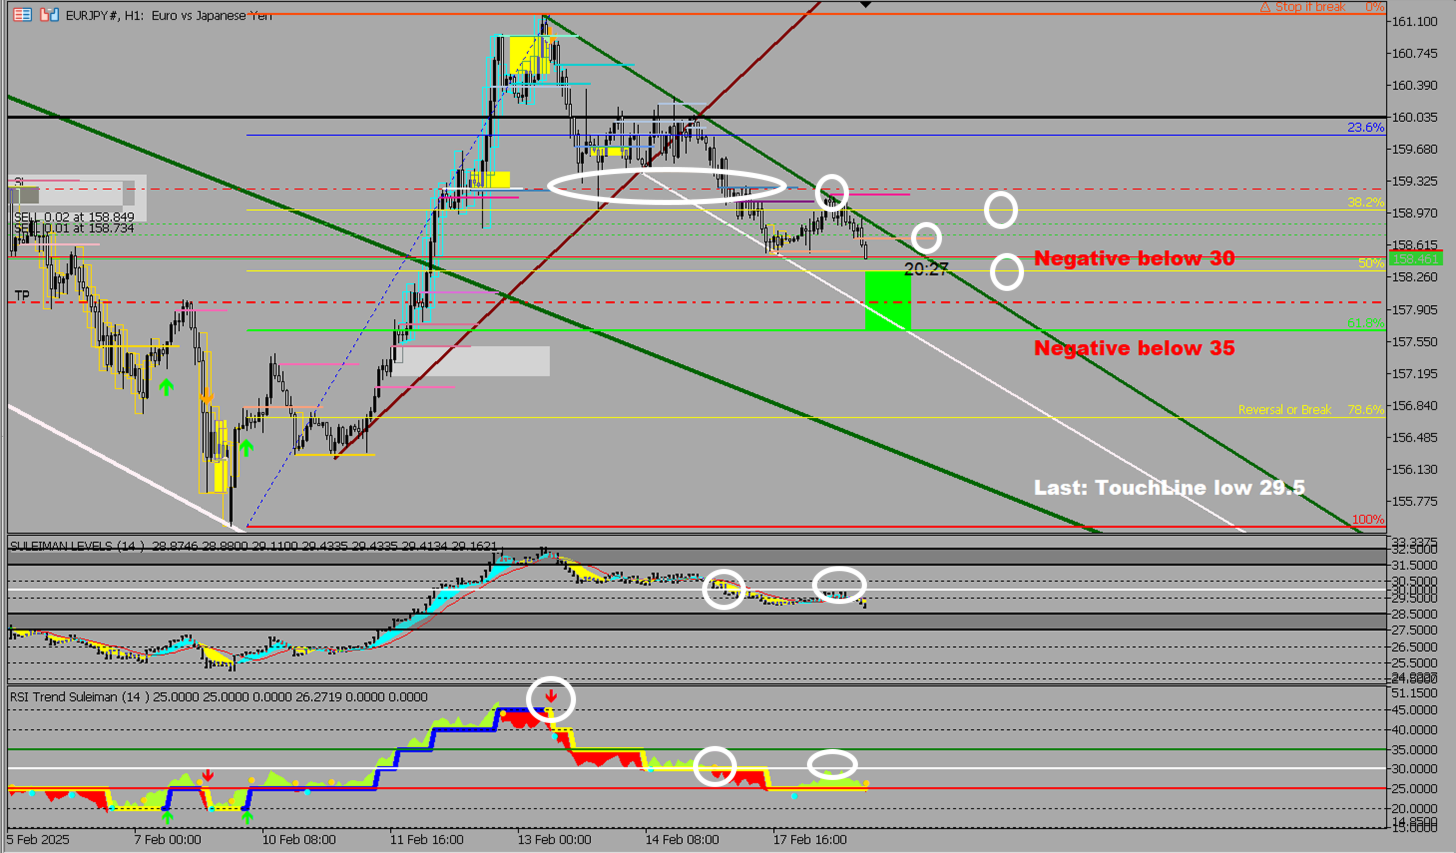
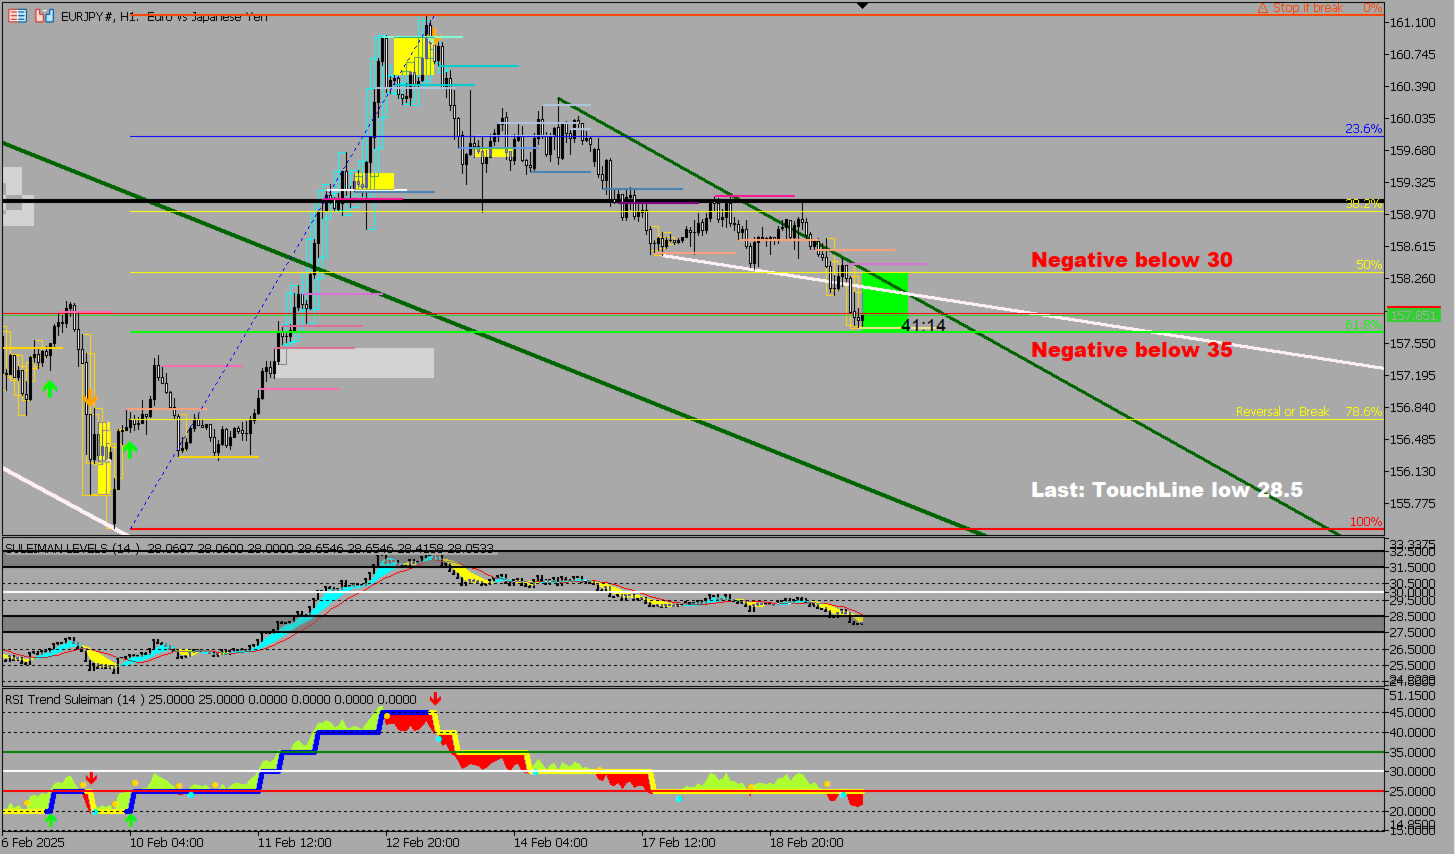
Önemli Not: Ekran görüntülerinde gösterilen resim, benim 2 göstergem olan "Süleyman Seviyeleri" göstergesi ve "RSI Trend V" göstergesine aittir.

"RSI Trend V1" göstergesiyle birlikte kullanılmasını önerdim, özellikle renkli bulutu doğrulamak ve eşleştirmek için, ayrıca ok sinyalleri için, bunun yanı sıra Fibonacci göstergesinin ve eklenen olağanüstü seviyelerinin önemini de vurguladım:

https://www.mql5.com/en/market/product/132080

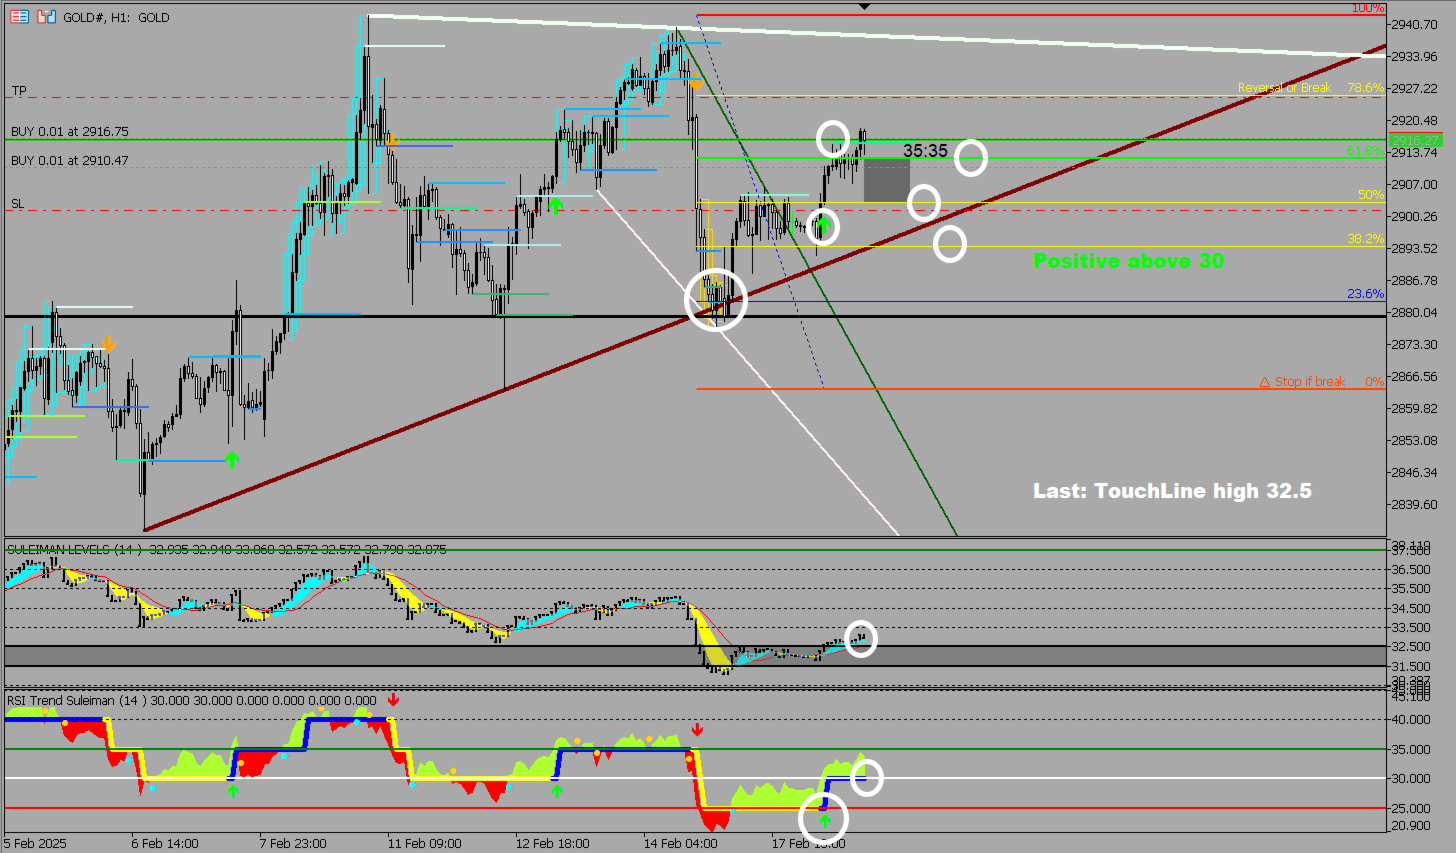
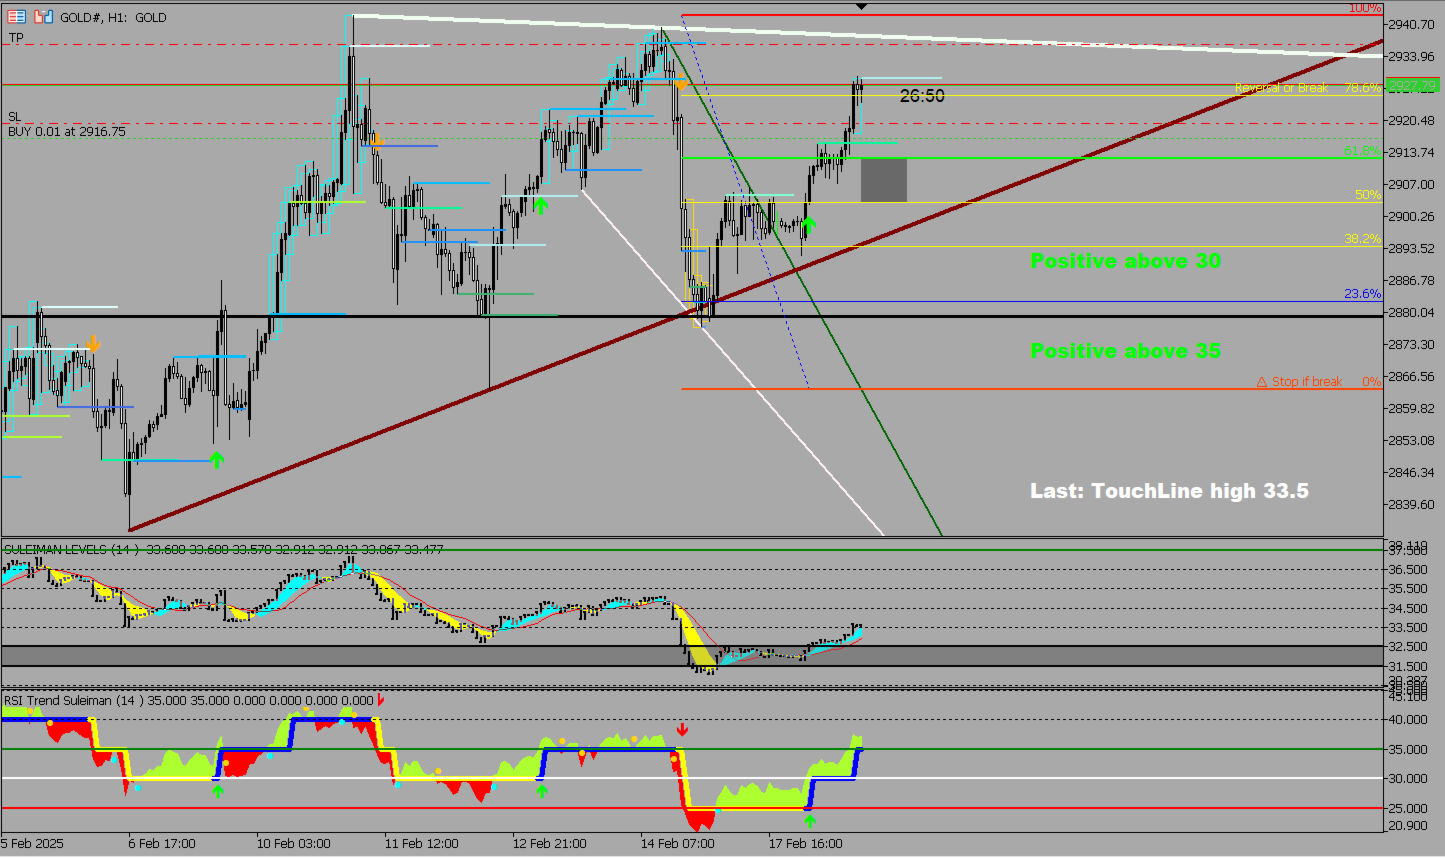
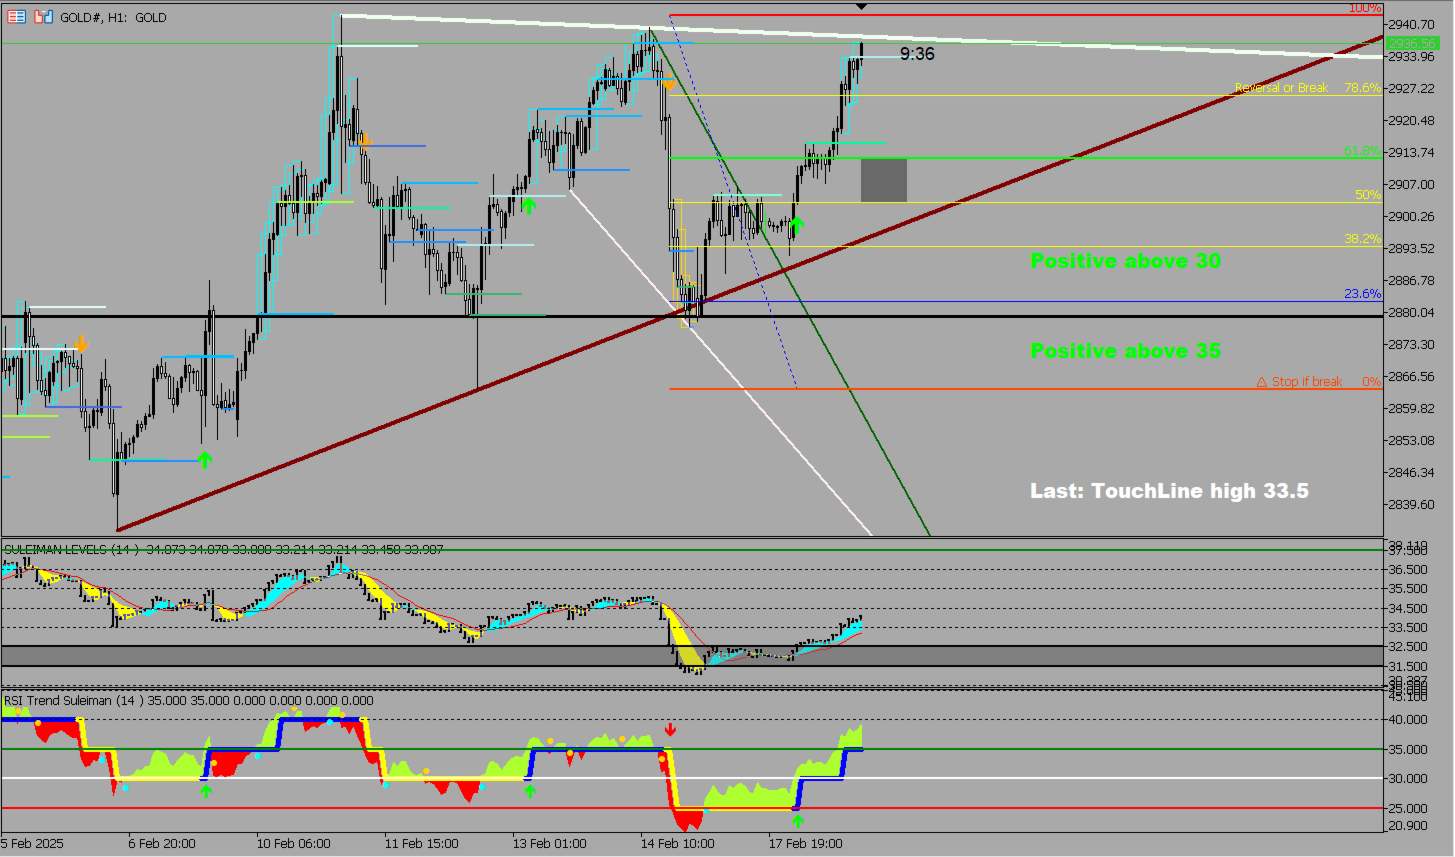
"Süleyman Seviyeleri" göstergesi, gelişmiş, hepsi bir arada profesyonel bir analiz aracıdır. Yaklaşık 9.800 satır koduyla bu gösterge, yenilik, hassasiyet ve sadeliği bir araya getirerek grafiklerinizi her zamankinden daha net hale getirir. Bu sadece bir gösterge değildir.

"Süleyman Seviyeleri"ni Öne Çıkaran Güçlü Özellikler:

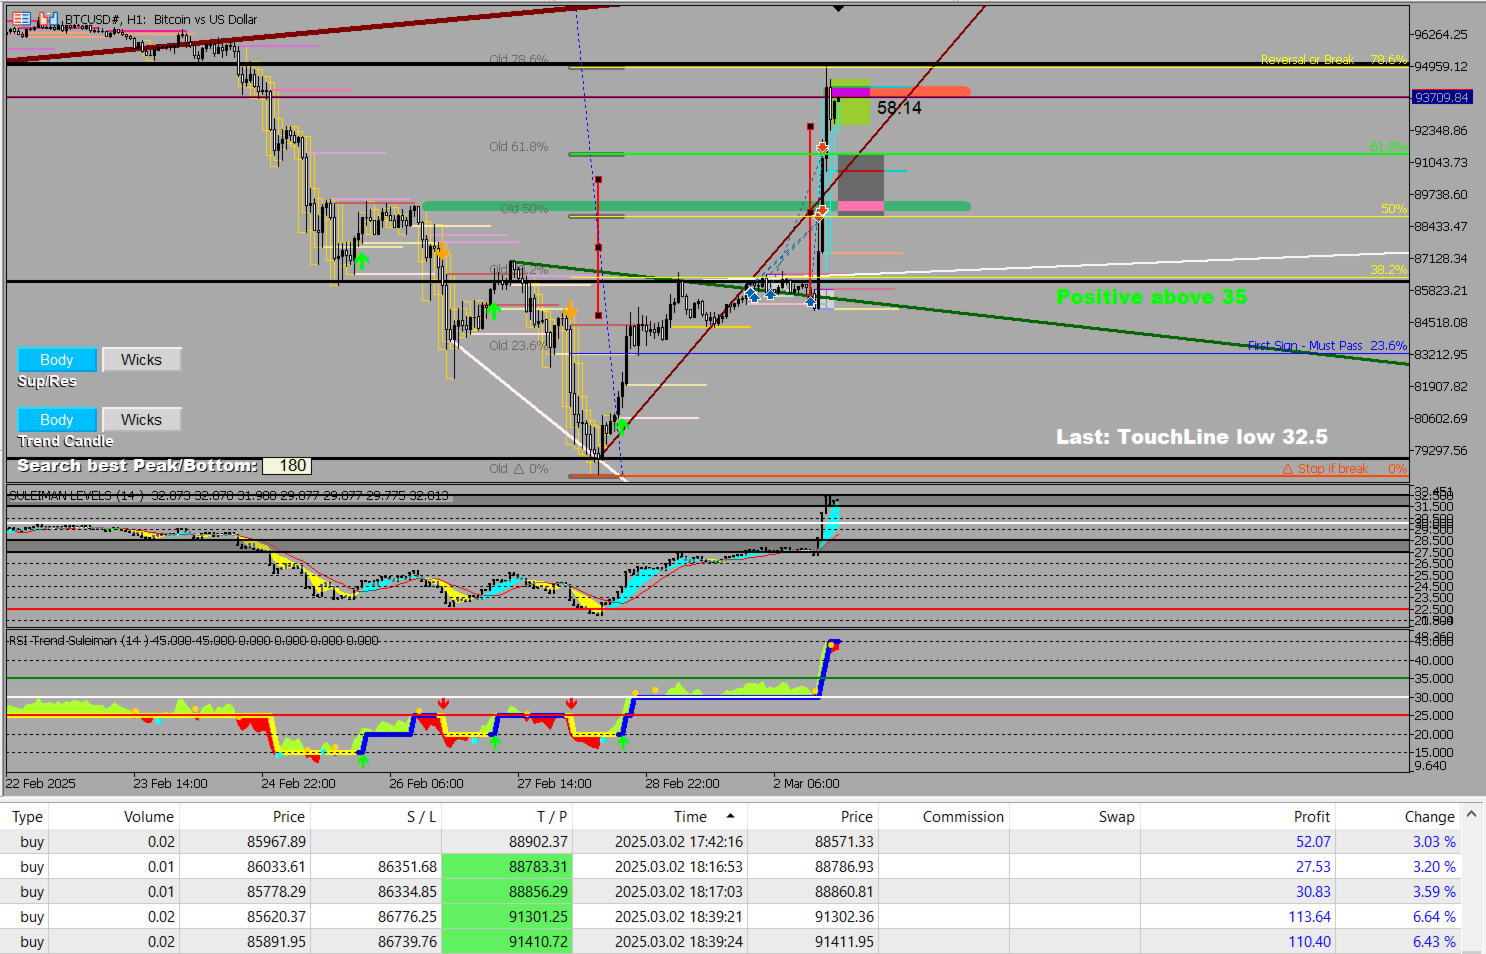
  1. Sarı Kutular (Finansal Akış Tespiti): Belirli mumlarda bankalar ve kurumlardan gelen para girişlerini tespit eder. Bu kutular, bu göstergeye özgü kritik finansal aktiviteyi temsil eder.

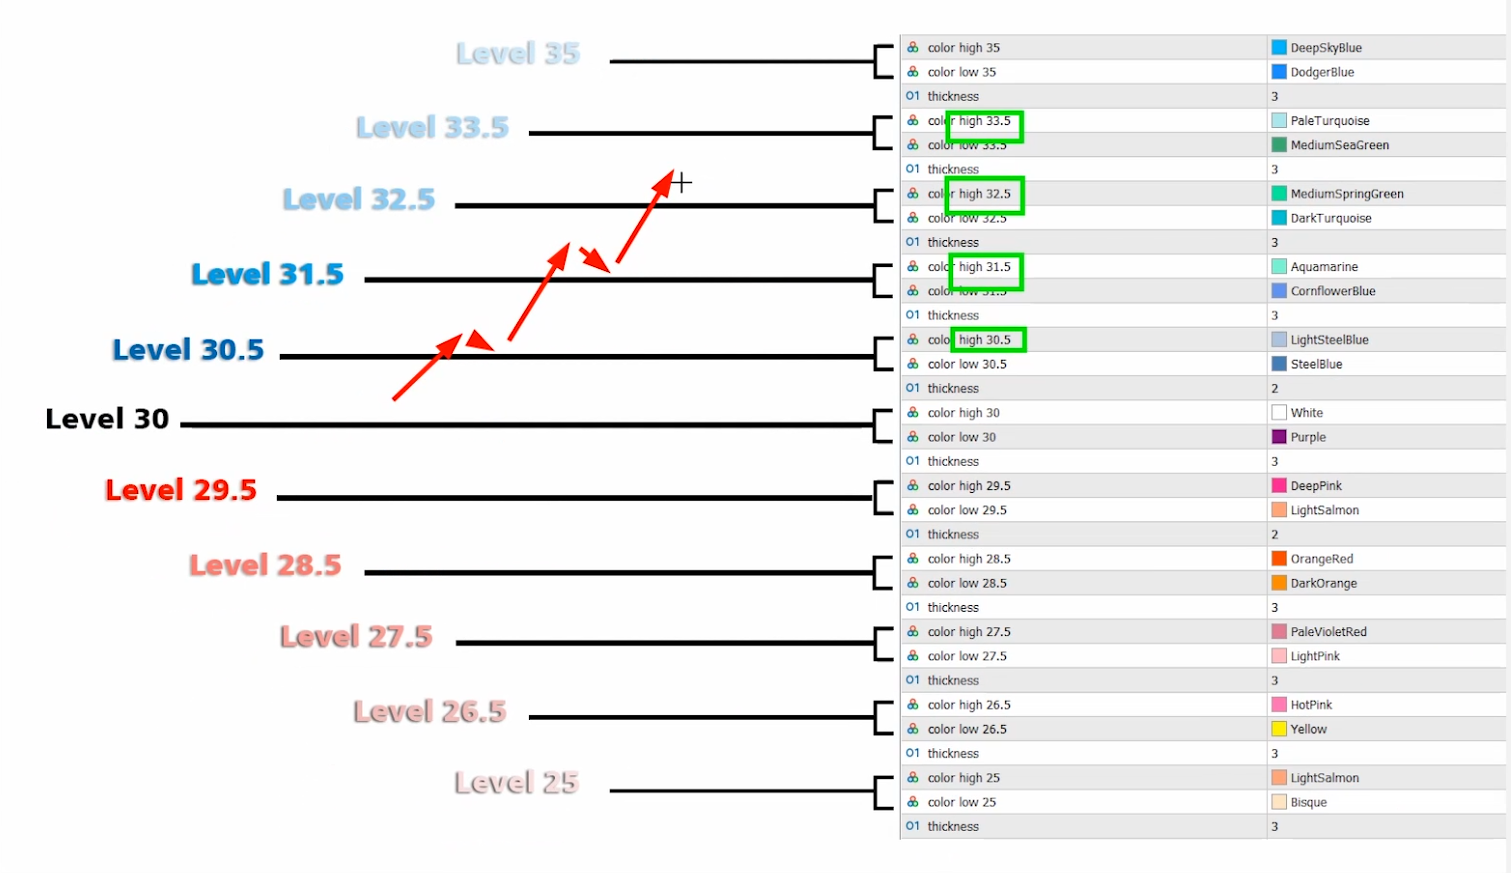
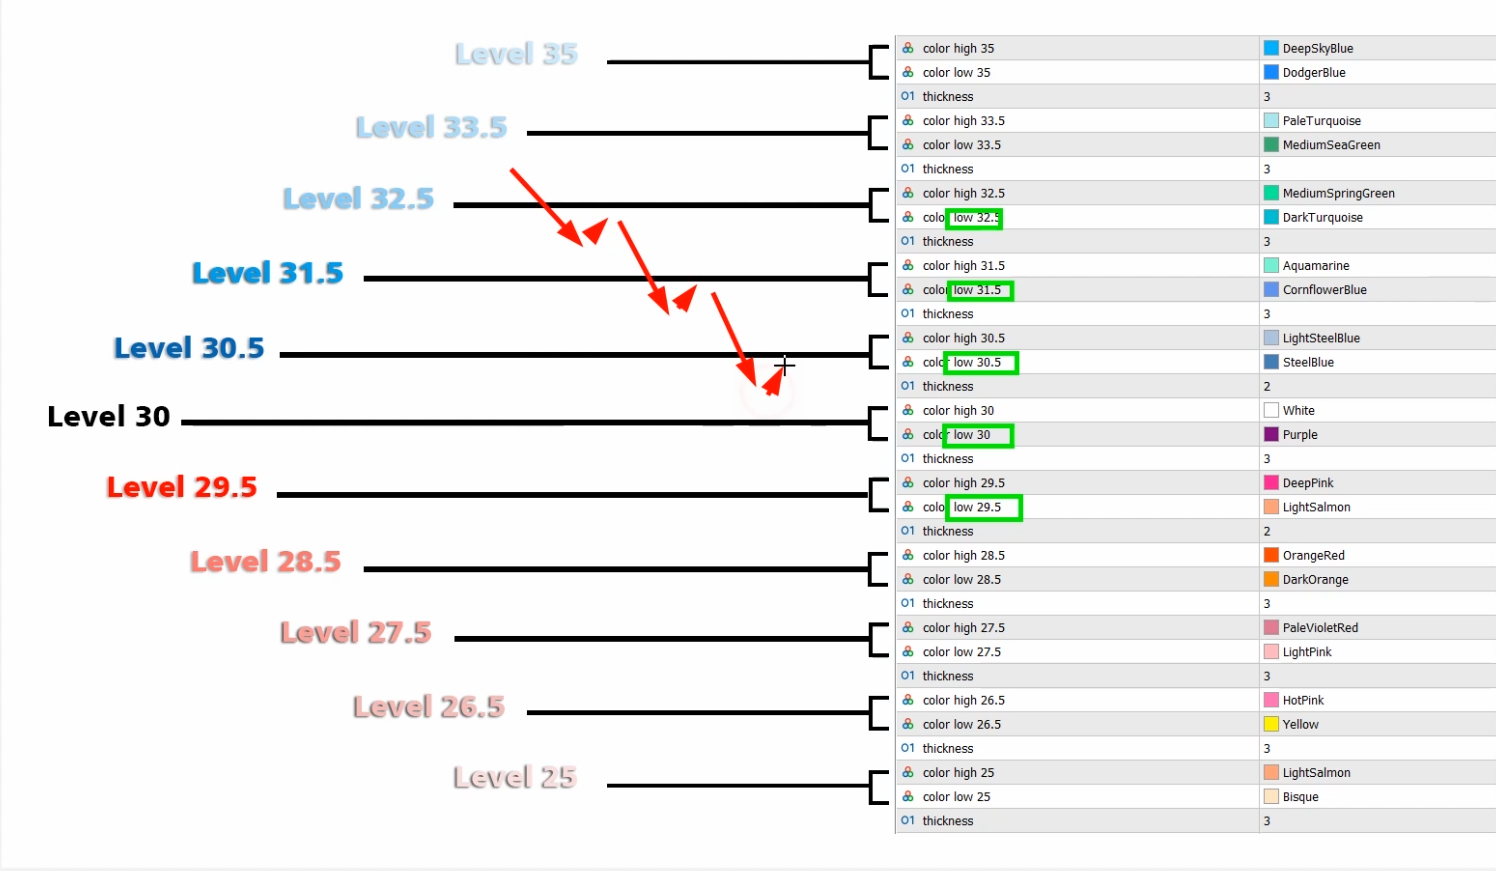
  2. Grafikte Renkli Seviyeler – Benzersiz Hassasiyet: Yeniden çizilmeyen özel renkli seviyeler sistemi.

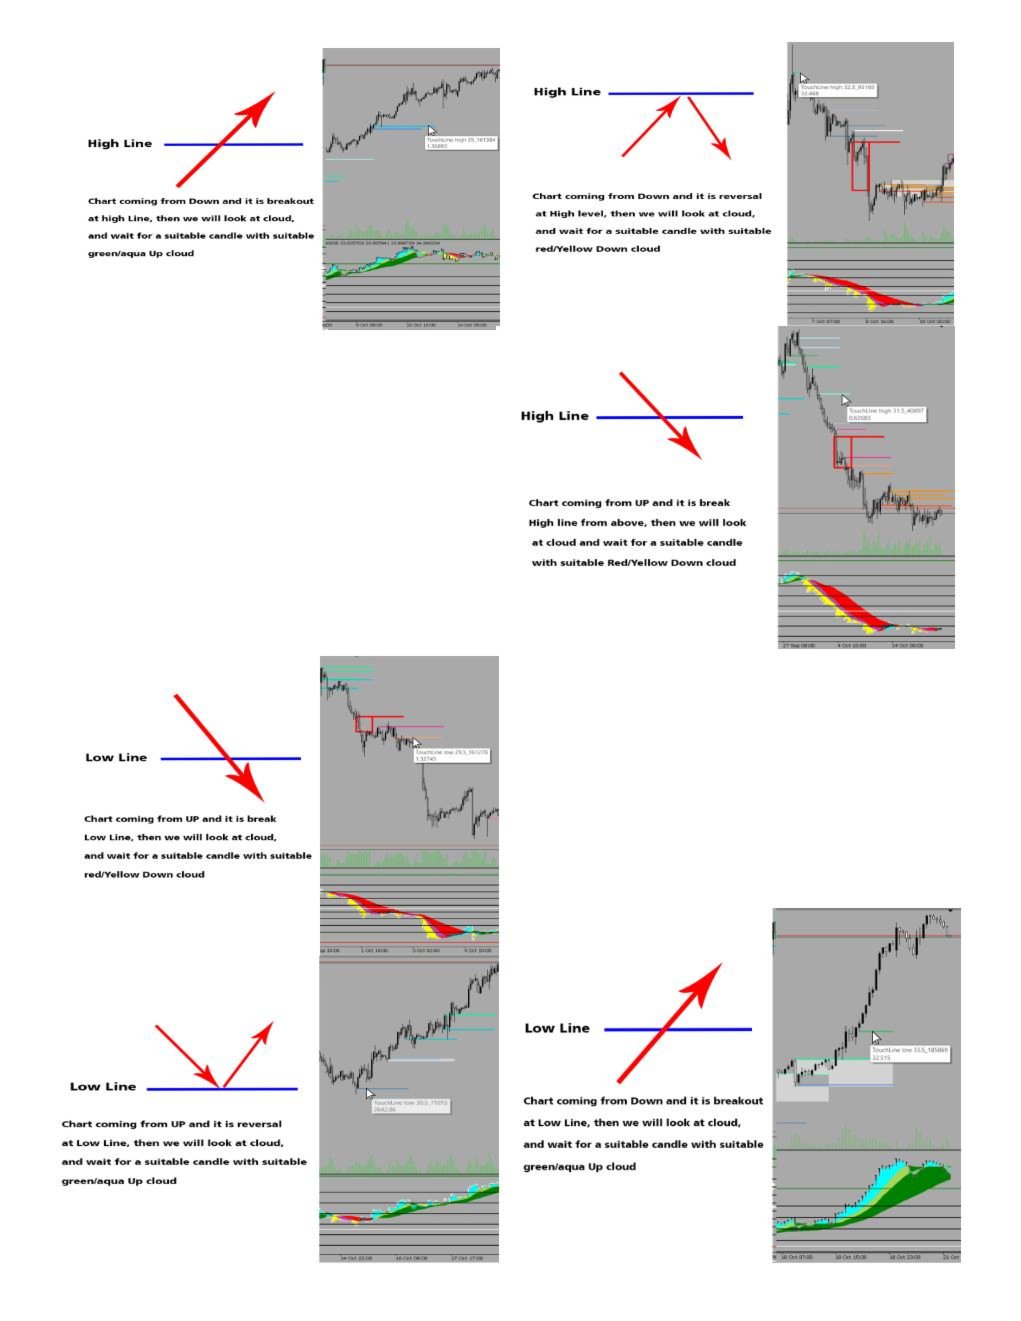
  3. Dinamik Yan Trend Çizgileri: Mumların fitillerini veya gövdelerini kullanarak trendleri otomatik olarak tespit eder. Grafik analiz tercihlerinize uyacak şekilde tamamen özelleştirilebilir.

  4. Dinamik Destek ve Direnç Çizgileri: Fiyat davranışına uyum sağlayan akıllı çizgiler... Mum gövdeleri veya fitilleri arasında kolayca geçiş yapın.

  5. Kalın Renkli Destek ve Direnç Çizgileri: Ana bölgeler için oldukça etkilidir.

  6. Hassas RSI Seviyeleri için Dikdörtgenler: RSI bölgelerindeki kritik alanları vurgulayarak netliği artırır.

  7. Engulfing ve Tersine Dönüş Mum Desenleri: Tamamen özelleştirilebilir engulfing mumlarla önemli tersine dönüş sinyallerini tespit edin.

  8. Gelişmiş Bulut Sistemi: Grafiğin pozitif veya negatif durumunu hızlı bir şekilde değerlendirerek daha hızlı karar vermeyi sağlar.

Tam Esneklik: Çoğu öğe için renkleri, kalınlıkları, görünürlüğü ve ayarları kolayca değiştirebilirsiniz.
Testler yapın, aşağıdaki gerçek resimlere bakın, videoyu izleyin ve analiz ve işlem yapma şeklinizi nasıl basitleştirdiğini görün. Paritelerin grafiklerindeki fiyat hareketini sürekli olarak izleyin, seviye çizgilerinin nasıl oluştuğunu, fiyatın bunlarla gerçekte nasıl etkileşime girdiğini (sekip geçtiğini, kırdığını veya etrafında dolandığını) gösterge tarafından sağlanan diğer birçok faktörle birlikte gözlemleyin.

Not: Göstergedeki varsayılan ayarlar mutlaka en iyisi değildir. Tüm ayarlar, deneyiminize göre tamamen özelleştirilebilir. Kişisel olarak, varsayılan ayarlardan farklı, kendi grafik analiz tercihlerime uyarlanmış ayarlar kullanıyorum.

Açıklamayı dikkatlice okuduğunuzdan ve göstergenin grafiği analiz etmek, anlamak ve incelemek için tasarlandığını anladığınızdan emin olun. İşlem açma kararı tamamen size aittir.

Herkese başarı ve karlı işlemler dilerim.


İncelemeler 6
purcemputpcp
57
purcemputpcp 2025.03.18 05:21 
 

Good indicator with helpful support 👍

Zone William
51
Zone William 2025.02.24 09:08 
 

I am completely satisfied with this indicator; there is effort and solid underlying content behind it. I am also satisfied with the creator; he is helpful.

David T
303
David T 2024.12.23 06:22 
 

After only 1 day of testing and now seeing this during live market conditions I can already see that this performs as intended . The Engulfing signals do align with the trend and multi time frame confluence is suggested to go with the higher TF...can be used for scalping as well . Seller was every responsive and welcomed my suggestion for an update...looking forward to that if it can be implemented due to the already complexity of the original code. Even though I am 99% on MT4 this indicator made me use my MT5 terminal more and more as I see the potential in this indicator. Got the full version at a great price. Highly recommended

Önerilen ürünler
Control Trading Support And Resistance Es un indicador independiente del TimeFrame que permite proyectar niveles más relevantes del mercado en función del plazo de tiempo de la operativa. Los colores del indicador están escogidos para diferenciar entre los diferentes tipos de niveles y destacar a los más relevantes. Este indicador permite visualizar en un mismo gráfico los posibles objetivos relevantes que los diferentes traders pueden emplear siguiendo diferentes tipos de operativas en funció
CandleBot
Mithlesh Kumar Mandal
Introducing CandleBot - Candlestick Formasyonlarını Tanımlama ve İşlem Yapma İçin Mükemmel ve Ücretsiz Aracınız! CandleBot ile piyasalarda avantajı ele geçirin; boğa ve ayı tüneli, sabah ve akşam yıldızı, çekiç gibi formasyonları kolayca tanıyarak işlem yapın. Belirli bir süre içinde açılış, yüksek, düşük ve kapanış fiyatlarından türetilen mum formasyonları, fiyat hareketlerinin görsel temsilcileri olarak işlev görür ve traderlara piyasa duyarlılığını analiz etme ve potansiyel tersine dönüşleri
FREE
This indicator is stand alone version from  MP Pivot Levels  (All in one) containing Woodie Pivots. Woodie’s pivot points are made up of multiple key levels, calculated from past price points, in order to frame trades in a simplistic manner. The key levels include the ‘pivot’ itself, and multiple support and resistance levels (usually up to three each). Traders use these levels as a guide for future price movements when setting up trades. The pivot : (Previous high + previous low + 2 x previous
FREE
The   Pivot Point indicator   automatically calculates and displays the pivot point line and support and resistance levels. Pivot can be calculated according to the Classic, Floor, Fibonacci, Woodie, Camarilla or DeMark formula. It is also possible to select the period for calculating the indicator. A trader can choose from daily, weekly, monthly, or user-defined periods. Types of pivots Classic Floor Fibonacci Woodie Camarilla DeMark Main features The indicator shows the current and historic
FREE
Buy and Sell Power
Marco Engstermann
4 (2)
Simple Indicator that shows the Buy and Sell volume in percent. Settings: Font size for percentage labels Horizontal offset from right edge (pixels) Vertical offset for Signal label from bottom (pixels) Vertical offset for Buy label from bottom (pixels) Vertical offset for Sell label from bottom (pixels) Color for Buy label Color for Sell label Color for Strong Buy signal Color for Buy signal Color for Strong Sell signal Color for Sell signal Color for Neutral signal Default to every tick
FREE
Big Figure Indicator MT5
Vonjinirina Alfred Randrianiaina
4.33 (3)
"BIG FIGURE INDICATOR", otomatik olarak fiyat grafiklerindeki belirli seviyelerde yatay çizgiler tanımlar ve çizer; örneğin, bütün sayılar veya yarım sayılar gibi (örneğin, para birimi işlemlerinde 1.0000 veya 1.5000). Bu seviyeler, büyük tüccarların ve yatırımcıların odaklanabileceği yuvarlak sayıları temsil ettikleri için psikolojik olarak önemli kabul edilir ve potansiyel destek veya direnç seviyelerine yol açabilir. Büyük rakam göstergesi, tüccarların önemli fiyat seviyelerini belirlemeleri
FREE
Free automatic Fibonacci is an indicator that automatically plots a Fibonacci retracement based on the number of bars you select on the BarsToScan setting in the indicator. The Fibonacci is automatically updated in real time as new highest and lowest values appears amongst the selected bars. You can select which level values to be displayed in the indicator settings. You can also select the color of the levels thus enabling the trader to be able to attach the indicator several times with differe
FREE
This Pivot Points Indicator can be switched between the following well-known types: Standard/Classic (7 levels)  Woodie (5 levels)  Fibonacci (7 levels)  DeMark (3 levels) Pivot Points are calculated based on the previous day's values - according to the most common formulas on the web - and serve as an important tool for many traders, especially in day trading. They indicate possible resistance and support where increased buyer and seller interest can be expected. A common trading approach, for
Pivot Points are used by Forex traders to find support and resistance levels based on the previous day's price action. There are various ways to calculate pivot points, including averaging the open, high, low, and close of the previous day's chart price. Forex Traders use a combination of pivot points with moving averages to find trading opportunities in the currency markets. Pivot points are very useful tools that use the previous bars' highs, lows and closings to project support and resist
FREE
Horizontal Level indicator - reflects, using a histogram, the horizontal volumes of transactions at a certain price without reference to time. At the same time, the histogram appears directly in the terminal window, and each column of the volume is easily correlated with the quote value of the currency pair. The volume of transactions is of great importance in exchange trading, usually an increase in the number of concluded contracts confirms the trend, and their reduction indicates an imminent
Camarilla Swing Trade Indicator is an Indicator. Support and resistance points are calculated from the High Low Close of the previous TF Week's price. What are Camarilla Pivot Points? 1.Camarilla Pivot Points is a modified version of the classic Pivot Point. 2.Camarilla Pivot Points was launched in 1989 by Nick Scott, a successful bond trader. 3.The basic idea behind Camarilla Pivot Points is that price tends to revert to its mean until it doesn't. 4.Camarilla Pivot Points is a mathematical pr
FREE
Trend Yakalayıcı: Alarm İndikatörü ile Trend Yakalayıcı Stratejisi, piyasa trendlerini ve potansiyel giriş ve çıkış noktalarını belirlemede yardımcı olan çok yönlü bir teknik analiz aracıdır. Piyasa koşullarına uyum sağlayarak trend yönünün net görsel temsili için dinamik bir Trend Yakalayıcı Stratejisi sunar. Tüccarlar tercihlerine ve risk toleranslarına göre parametreleri özelleştirebilirler. Gösterge, trendleri tanımlamaya yardımcı olur, potansiyel ters dönüşleri sinyaller, trailing stop me
FREE
Vertical Volume
Kim Yonghwa
4.83 (6)
Özellikler Fiyata göre işlem hacmini kontrol etmek için gösterge. Çoğunlukla EURUSD için çalışır, diğer para çiftlerinde işe yaramayabilir veya hesaplama uzun zaman alabilir. Düzgün bir kullanım için "Grafiğin sağ kenarından bitiş sınırını kaydır" seçeneğini açın (ekrandaki resimde gösterildiği gibi). Yeni bir çubuk verisi göründüğünde veriler sıfırlanır. Değişkenler COlOR: Gösterge rengini ayarlama WIDTH: Gösterge genişliğini ayarlama PERIOD: Verileri hesaplamak için zaman periyodunu belirl
FREE
Auto Fib Retracements
Ross Adam Langlands Nelson
4.2 (5)
Automatic Fibonacci Retracement Line Indicator. This indicator takes the current trend and if possible draws Fibonacci retracement lines from the swing until the current price. The Fibonacci levels used are: 0%, 23.6%, 38.2%, 50%, 61.8%, 76.4%, 100%. This indicator works for all charts over all timeframes. The Fibonacci levels are also recorded in buffers for use by other trading bots. Any comments, concerns or additional feature requirements are welcome and will be addressed promptly. 
FREE
Özellikler Fibonacci Retracement Ticareti için Gösterge 1S, 4S, 1G ve 1H arasında seçilen önceki çubuğa dayalı olarak Fibonacci grafiği çizilir. Piyasa fiyatı Fibonacci seviyesine dokunduğunda, renk değişir ve dokunma zamanı görüntülenir. Fibonacci grafiği -23.6, 0, 23.6, 38.2, 50, 61.8, 76.4, 100 ve 123.6 seviyelerinde çizilir ve çubuk güncellendiğinde grafik yenilenir. Değişkenler Zaman aralığı: Fibonacci grafiği, 1S, 4S, 1G ve 1H arasından seçilen zaman aralığıyla çizilir. FiboWidth: Sevi
FREE
Online Accounts Manager MT5
Kyra Nickaline Watson-gordon
5 (1)
OneClick Online Account Manager is a powerful utility that helps you to manage all your accounts from a centralized panel. It is suitable for all single account traders and specially for multiple accounts traders. The utility help you to : Monitor status of all accounts on a private web page. Some information such as account connection status, account profit, DD, Balance, Equity, Margin Level, Number of positions and orders, Daily and Weekly profit/loss and also overall summation of all these p
MT5 Sync Tools
Mohammad Reza Anari
Supercharge Your MetaTrader Analysis and Trading with Meta Sync Tools! Struggling to analyze price action across different timeframes? Meta Sync Tools eliminates the frustration of unsynced crosshairs and charts, allowing seamless multi-timeframe analysis. Missing key correlations between assets and constantly switching between charts? Meta Sync Tools empowers you to visualize relationships between instruments effortlessly.  Tired of wasting time on repetitive tasks? With 30+ Customizable Short
FaU fibo
Aleksandr Dementev
Gösterge, ticaret faaliyetleriniz için gerçek Fibonacci seviyelerini çizer. Seviyeler, fiyat düşük (%0) veya %100 fibonacci seviyesine dokunduktan sonra her seferinde yeniden çizilir. Parametrelerde ticaret etkinliğini seçin: Uzun vadeli yatırımcı Orta vadeli yatırımcı Orta vadeli yatırımcı aktif Kısa vadeli yatırımcı Kısa vadeli yatırımcı aktif Spekülatör Spekülatör aktif Kafa derisi yüzücü Kafa derisi aktif Bu göstergeyi çalışırken deneyin ve artık fibonacci seviyeleri çizmek için koordinat
FREE
Volume Trade Levels
Mahmoud Sabry Mohamed Youssef
The idea behind this indicator is very simple , First it contains 2 mechanisms to place your trades: 1- Enter the Pips you want to duplicate to price levels. 2- Automatically let the indicator specify the largest Buy / Sell Volume Candle and place duplicated levels based on the candle itself. How it works: 1- Enter the Pips you want to duplicate to price levels:    1- once the indicator is loaded you will need first to Specify the number of pips in the indicator Configuration window ,you can g
Stop Loss with Profit Free Version*. Complete Version here. This utility / expert for MetaTrader 5 modifies the stop loss of all your operations dynamically and automatically to ensure the minimum benefits you want, and be able to operate with or without Take Profit. Maximize your benefits, by being able to trade with Unlimited Take Profit. You will ensure the number of minimum points you want to earn in each operation and the stop loss will be adjusted as long as the benefit of the operatio
FREE
AliPivot Points is a Meta Trader 5 Indicator that draws you the latest pivot points. You can choose from timeframes ranging from 1 Minute to 1 Month. Calculation methods for pivot points includes: Classic Pivot Points Camarilla Pivot Points Fibonacci Pivot Points Woodie Pivot Points You can personalize the line colors, style, and width to suit your preference. The indicator displays values on the right side of the chart. AliPivot Points values can also be utilized by developers for creating Expe
FREE
The Easy Trend Trading Indicator delivers quick and accurate BUY/SELL signals, ensuring that traders can make timely decisions. It works flawlessly across various timeframes and supports all symbols, making it a versatile tool for any market. Whether you're trading short-term or long-term, this indicator adapts to your needs with ease. Quick Setup: Simply "Enable" the indicator via input settings With a low memory footprint, the indicator is designed for efficiency, ensuring smooth performance e
Overview In the fast-paced world of forex and financial markets, quick reactions and precise decision-making are crucial. However, the standard MetaTrader 5 terminal only supports a minimum of 1-minute charts, limiting traders' sensitivity to market fluctuations. To address this issue, we introduce the Second-Level Chart Candlestick Indicator , allowing you to effortlessly view and analyze market dynamics from 1 second to 30 seconds on a sub-chart. Key Features Support for Multiple Second-Level
TransitTrendlines
Bonginkosi Innocent Khumalo
TransitTrendlines this is a automatically trendline drawer, it draw both horizontal and diagonal trendlines. The horizontal trendlines are the pivot points of the day timeframe and the diagonal trendlines are based on the current time frames. You can adjust the diagonal trendlines by increasing the number of bars to draw the diagonal trendline and can also adjust the steepness. Note that the Horizontal trendlines are based on the day pivot points not currant time frame. Join mql5 transitbk98 cha
FREE
An indicator of pattern #54 ("Dead cat bounce") from Encyclopedia of Chart Patterns by Thomas N. Bulkowski. Parameters: Alerts - show alert when an arrow appears   Push - send a push notification when an arrow appears (requires configuration in the terminal) PeriodBars - indicator period ArrowType - a symbol from 1 to 17 ArrowVShift - vertical shift of arrows in pixels. Note. Arrows appear on a forming bar and do not disappear.   It cannot be guaranteed that the indicator recognizes the patter
Fibonacci automatically draws Fibonacci retracement, Because Fibonacci automatically draws Fibonacci retracement, you can know at a glance the price to buy at a push or sell back. Therefore, you can trade in favorable conditions in a trending market. We are live-streaming the actual operation of the system. Please check for yourself if it is usable. Please check it out for yourself. https://www.youtube.com/@ganesha_forex We do not guarantee your investment results. Investments should be made
The utility draws pivot levels for the selected timefram in classic method. Pivot = (high + close + low) / 3 R1 = ( 2 * Pivot) - low S1 = ( 2 * Pivot) - high R2 = Pivot + ( high - low ) R3 = high + ( 2 * (Pivot - low)) S2 = Pivot - (high - low) S3 = low - ( 2 * (high - Pivot)) you can change the timeframe, colors and fontsize. also you can change the text for the levels. Have fun and give feedback...
FREE
How the day starts
Sergio Antoni Escudero Tirado
This indicator draws the high intraday price and the low intraday price of the first n minutes of the day. The chart shows the days with vertical lines and two horizontal lines to indicate the max and the min close price of the n first minutes of the day. The max/min lines start and end with the day calculated. With this indicator you can see how starts the day compared with the previous days. It is valid for any market inasmuch as the start time is calculated with the data received. Parameter
FREE
TS Time Remaining
Aurelio Manuel Peral Garcia
TS Time Remaining - Indicador de Cuenta Regresiva para Velas en MetaTrader 5 El TS Time Remaining es un indicador gratuito diseñado para la plataforma MetaTrader 5 que permite a los traders visualizar en tiempo real el tiempo restante de la vela actual. Esta herramienta es especialmente útil para aquellos operadores que trabajan con estrategias basadas en la acción del precio y patrones de velas japonesas, ya que les permite anticiparse al cierre de la vela y tomar decisiones con mayor precisión
FREE
Pivot Points Levels Description The Pivot Points Levels indicator is an advanced and comprehensive tool for technical analysis based on support and resistance levels calculated from pivot points. This free indicator combines 6 different calculation methods with support for multiple timeframes, offering a robust solution for identifying key price reversal and continuation areas. Key Features 6 Calculation Methods : Traditional, Fibonacci, Woodie, Classic, DeMark (DM), and Camarilla Multi-Timefram
FREE
Bu ürünün alıcıları ayrıca şunları da satın alıyor
Divergence Bomber
Ihor Otkydach
5 (4)
Bu göstergeyi satın alan herkese aşağıdaki ekstra içerikler ücretsiz olarak sunulmaktadır: Her işlemi otomatik olarak yöneten, Stop Loss ve Take Profit seviyelerini ayarlayan ve işlemleri strateji kurallarına göre kapatan özel yardımcı araç: "Bomber Utility" Göstergenin farklı varlıklar üzerinde kullanılmasına yönelik ayar dosyaları (set dosyaları) Bomber Utility için 3 farklı modda kullanım sunan ayar dosyaları: "Minimum Risk", "Dengeli Risk" ve "Bekle-Gör Stratejisi" Bu ticaret stratejisini hı
Golden Trend Indicator MT5
Noha Mohamed Fathy Younes Badr
4.89 (18)
Golden Trend indicator  is The best indicator for predicting trend movement this indicator never lags and never repaints and never back paints    and give  arrow buy and sell    before the candle appear  and it will help you and  will make your trading decisions clearer its work on all currencies and  gold and crypto and all time frame This unique  indicator uses very secret algorithms to catch the  trends, so you can trade using this indicator and see the trend clear on charts  manual guide and
NOTE: CYCLEMAESTRO is distributed only on this website, there are no other distributors. Demo version is for reference only and is not supported. Full versione is perfectly functional and it is supported. CYCLEMAESTRO , the first and only indicator of Cyclic Analysis, useful for giving signals of TRADING, BUY, SELL, STOP LOSS, ADDING. Created on the logic of   Serghei Istrati   and programmed by   Stefano Frisetti ;   CYCLEMAESTRO   is not an indicator like the others, the challenge was to inter
Algo Pumping
Ihor Otkydach
5 (11)
PUMPING STATION – Kişisel “her şey dahil” stratejiniz Karşınızda PUMPING STATION — forex dünyasında işlem yapma şeklinizi heyecan verici ve etkili bir sürece dönüştürecek devrim niteliğinde bir gösterge. Bu sadece bir yardımcı değil, güçlü algoritmalarla donatılmış tam teşekküllü bir ticaret sistemidir ve daha istikrarlı işlem yapmanıza yardımcı olur. Bu ürünü satın aldığınızda ŞUNLARI ÜCRETSİZ olarak alırsınız: Özel ayar dosyaları: Otomatik kurulum ve maksimum performans için. Adım adım video e
MonetTrend — Премиум-индикатор для торговли по тренду (M30, H1, H4) MonetTrend — это мощный и визуально понятный трендовый индикатор, созданный для торговли на таймфреймах M30, H1 и H4. Он идеально подходит для работы с волатильными инструментами, такими как: • Золото (XAUUSD) • Криптовалюты (BTCUSD) • Валютные пары (EURUSD, USDJPY и др.) Ключевые особенности MonetTrend: • Автоматическое отображение Take Profit 1 (TP1) и Stop Loss (SL): После появления сигнала индикатор сразу показывает: • TP
TPSproTREND PrO MT5
Roman Podpora
4.72 (18)
VERSION MT4        —        ИНСТРУКЦИЯ RUS           —        INSTRUCTIONS  ENG Ana işlevler: VERME OLMADAN doğru giriş sinyalleri! Bir sinyal belirirse, alakalı kalır! Bu, bir sinyal sağlayıp daha sonra onu değiştirebilen ve mevduatta fon kaybına yol açabilen yeniden çekme göstergelerinden önemli bir farktır. Artık pazara daha büyük bir olasılık ve doğrulukla girebilirsiniz. Ayrıca, ok göründükten sonra hedefe ulaşılıncaya kadar (kar al) veya bir geri dönüş sinyali görünene kadar mumları renkle
RelicusRoad Pro MT5
Relicus LLC
4.79 (19)
Şimdi 147 $ (birkaç güncellemeden sonra 499 $ 'a yükseliyor) - Sınırsız Hesaplar (PC'ler veya Mac'ler) RelicusRoad Kullanım Kılavuzu + Eğitim Videoları + Özel Discord Grubuna Erişim + VIP Durumu PİYASAYA BAKMAK İÇİN YENİ BİR YOL RelicusRoad, forex, vadeli işlemler, kripto para birimleri, hisse senetleri ve endeksler için dünyanın en güçlü ticaret göstergesidir ve yatırımcılara kârlı kalmaları için ihtiyaç duydukları tüm bilgileri ve araçları sağlar. Başlangıç ​​seviyesinden ileri seviyeye ka
Quantum TrendPulse
Bogdan Ion Puscasu
5 (13)
SuperTrend   ,   RSI   ve   Stochastic'in   gücünü tek bir kapsamlı göstergede birleştirerek işlem potansiyelinizi en üst düzeye çıkaran nihai işlem aracı olan   Quantum TrendPulse'u   tanıtıyoruz. Hassasiyet ve verimlilik arayan yatırımcılar için tasarlanan bu gösterge, piyasa trendlerini, momentum değişimlerini ve en uygun giriş ve çıkış noktalarını güvenle belirlemenize yardımcı olur. Temel Özellikler: SuperTrend Entegrasyonu:   Güncel piyasa trendlerini kolayca takip edin ve karlılık dalgası
TPSpro RFI Levels MT5
Roman Podpora
4.55 (20)
Geri dönüş bölgeleri / Tepe hacimleri / Önemli bir oyuncunun aktif bölgeleri =       TS TPSPROSİSTEMİ TALİMATLAR RUS       /       TALİMATLAR       ENG       /           Sürüm MT4        Bu göstergenin her alıcısı ayrıca ÜCRETSİZ şunları elde eder: RFI SIGNALS servisinden işlem sinyallerine 6 ay erişim - TPSproSYSTEM algoritmasına göre hazır giriş noktaları. Düzenli olarak güncellenen eğitim materyalleri - stratejiye dalın ve profesyonel seviyenizi yükseltin. Hafta içi 7/24 destek ve kapalı ya
MONEYTRON – ТВОЙ ЛИЧНЫЙ СИГНАЛ НА УСПЕХ! XAUUSD | AUDUSD | USDJPY | BTCUSD Поддержка таймфреймов: M5, M15, M30, H1 Почему трейдеры выбирают Moneytron? 82% успешных сделок — это не просто цифры, это результат продуманной логики, точного алгоритма и настоящей силы анализа. Автоматические сигналы на вход — не нужно гадать: когда покупать, когда продавать. 3 уровня Take Profit — ты сам выбираешь свой уровень прибыли: безопасный, уверенный или максимум. Четкий Stop Loss — контролируешь риск
FX Volume MT5
Daniel Stein
4.82 (17)
FX Volume: Bir Broker’ın Perspektifinden Gerçek Piyasa Duyarlılığını Deneyimleyin Kısa Özet Trading yaklaşımınızı bir adım öteye taşımak ister misiniz? FX Volume , perakende traderlar ile brokerların nasıl konumlandığını gerçek zamanlı olarak sunar—COT gibi gecikmeli raporlardan çok daha önce. İster istikrarlı kazançları hedefliyor olun, ister piyasada daha güçlü bir avantaj arayın, FX Volume önemli dengesizlikleri belirlemenize, kırılmaları (breakout) doğrulamanıza ve risk yönetiminizi iyileş
MetaForecast M5
Vahidreza Heidar Gholami
5 (3)
MetaForecast, fiyat verilerindeki harmonileri kullanarak herhangi bir piyasanın geleceğini tahmin eder ve görselleştirir. Piyasa her zaman tahmin edilemezken, fiyatlarda bir desen varsa, MetaForecast geleceği mümkün olduğunca doğru bir şekilde tahmin edebilir. Benzer ürünlere göre, MetaForecast piyasa eğilimlerini analiz ederek daha kesin sonuçlar üretebilir. Giriş Parametreleri Past size (Geçmiş boyut) MetaForecast'ın gelecekteki tahminler oluşturmak için kullandığı çubuk sayısını belirtir. Mo
CBT Quantum Maverick Yüksek Verimli İkili Opsiyon Ticaret Sistemi CBT Quantum Maverick, hassasiyet, basitlik ve disiplinli ticaret arayan yatırımcılar için tasarlanmış yüksek performanslı bir ikili opsiyon ticaret sistemidir. Özelleştirme gerekmez—bu sistem, ilk kullanımda etkili sonuçlar için optimize edilmiştir. Sinyalleri kolayca anlamak için biraz pratik yapmak yeterlidir. Ana Özellikler: Hassas Sinyaller: Yeni mum bazlı ticaret sinyalleri—mevcut mumdan sonra gelecek mum hedeflenir ve sık
Yeni Başlayanlar veya Uzman Tüccarlar için En İyi Çözüm! Bu Gösterge benzersiz, yüksek kaliteli ve uygun fiyatlı bir ticaret aracıdır çünkü bir dizi tescilli özellik ve yeni bir formül ekledik. Sadece BİR grafik ile 28 Forex çifti için Döviz Gücünü okuyabilirsiniz! Yeni bir trendin veya scalping fırsatının tam tetik noktasını belirleyebildiğiniz için ticaretinizin nasıl gelişeceğini hayal edin? Kullanım kılavuzu:   buraya tıklayın Bu ilk olan, orijinal! Değersiz bir özenti klonunu almayın.
Gold Trend 5
Sergei Linskii
3.5 (2)
Altın Trend - bu iyi bir hisse senedi teknik göstergesidir. Gösterge algoritması, bir varlığın fiyat hareketini analiz eder ve oynaklığı ve potansiyel giriş bölgelerini yansıtır. En iyi gösterge sinyalleri: - SATIŞ için = kırmızı histogram + kırmızı KISA işaretçi + aynı yönde sarı sinyal oku. - AL için = mavi histogram + mavi UZUN işaretçi + aynı yönde aqua sinyal oku. Göstergenin faydaları: 1. Gösterge yüksek doğrulukta sinyaller üretir. 2. Onaylanmış bir ok sinyali yalnızca trend değişt
Bu gösterge paneli, seçilen semboller için mevcut en son   harmonik kalıpları   gösterir, böylece zamandan tasarruf edersiniz ve daha verimli olursunuz /   MT4 sürümü . Ücretsiz Gösterge:   Basic Harmonic Pattern Gösterge sütunları Symbol :   seçilen semboller görünecektir Trend:   yükseliş veya düşüş Pattern :   desen türü (gartley, kelebek, yarasa, yengeç, köpekbalığı, cypher veya ABCD) Entry :   giriş fiyatı SL:   zararı durdur fiyatı TP1:   1. kar alma fiyatı TP2:   2. kar alma fiyatı TP
MetaBands M5
Vahidreza Heidar Gholami
4.5 (2)
MetaBands uses powerful and unique algorithms to draw channels and detect trends so that it can provide traders with potential points for entering and exiting trades. It’s a channel indicator plus a powerful trend indicator. It includes different types of channels which can be merged to create new channels simply by using the input parameters. MetaBands uses all types of alerts to notify users about market events. Features Supports most of the channel algorithms Powerful trend detection algorith
Tanıtım       Quantum Breakout PRO   , Breakout Bölgeleri ile ticaret yapma şeklinizi değiştiren çığır açan MQL5 Göstergesi! 13 yılı aşkın ticaret tecrübesine sahip deneyimli tüccarlardan oluşan bir ekip tarafından geliştirilmiştir.       Kuantum Breakout PRO       yenilikçi ve dinamik koparma bölgesi stratejisiyle ticaret yolculuğunuzu yeni zirvelere taşımak için tasarlanmıştır. Kuantum Breakout Göstergesi, size 5 kar hedefi bölgesi ile kırılma bölgelerinde sinyal okları ve kırılma kutusuna da
Öncelikle, bu Ticaret Göstergesi'nin yeniden çizilme, yeniden gösterim yapmama ve gecikme olmama gibi özelliklere sahip olduğunu vurgulamak önemlidir, bu da hem manuel hem de algoritmik ticaret için mükemmel hale getirir. Kullanıcı kılavuzu, ön ayarlar ve çevrimiçi destek dahildir. AI Trend Pro Max, doğruluk, güç ve sadelik arayan tüccarlar için tasarlanmış sofistike, hepsi bir arada bir ticaret sistemidir. Önceki göstergelerle yapılan yıllarca süren geliştirmelere dayanarak, şimdiye kadar geliş
Trend Forecaster
Alexey Minkov
5 (6)
The Trend Forecaster indicator utilizes a unique proprietary algorithm to determine entry points for a breakout trading strategy. The indicator identifies price clusters, analyzes price movement near levels, and provides a signal when the price breaks through a level. The Trend Forecaster indicator is suitable for all financial assets, including currencies (Forex), metals, stocks, indices, and cryptocurrencies. You can also adjust the indicator to work on any time frames, although it is recommen
Size mükemmel bir teknik gösterge olan Grabber’ı tanıtıyorum. Bu araç, kullanıma hazır bir “her şey dahil” işlem stratejisi olarak çalışır. Tek bir yazılım kodu içinde güçlü piyasa teknik analiz araçları, işlem sinyalleri (oklar), uyarı işlevleri ve push bildirimleri entegre edilmiştir. Bu göstergeyi satın alan herkes aşağıdaki hediyeleri ücretsiz olarak alır: Açık emirleri otomatik yönetmek için Grabber Yardımcı Aracı Kurulum, yapılandırma ve nasıl işlem yapılacağını adım adım anlatan video kıl
IQ Gold Gann Levels a non-repainting, precision tool designed exclusively for XAUUSD/Gold intraday trading. It uses W.D. Gann’s square root method to plot real-time support and resistance levels, helping traders spot high-probability entries with confidence and clarity. William Delbert Gann (W.D. Gann) was an exceptional market analyst, whose trading technique was based on a complex blend of mathematics, geometry, astrology, and ancient mathematics which proved to be extremely accurate. Download
MTF Supply Demand Zones MT5
Georgios Kalomoiropoulos
5 (1)
Yeni Nesil Otomatik Arz ve Talep Bölgeleri. Her Grafikte Çalışan Yeni ve Yenilikçi Algoritma. Tüm Bölgeler Piyasanın Fiyat Hareketine Göre Dinamik Olarak Oluşturulmaktadır. İKİ TÜR UYARI --> 1) FİYAT BİR BÖLGEYE ÇIKTIĞINDA 2) YENİ BİR BÖLGE OLUŞTURDUĞUNDA Bir tane daha işe yaramaz gösterge almazsın. Kanıtlanmış Sonuçlarla eksiksiz bir Ticaret Stratejisi elde edersiniz.     Yeni özellikler:     Fiyat Arz/Talep Bölgesine ulaştığında uyarılar     Yeni bir Arz/Talep Bölgesi oluşturulduğunda
Top indicator for MT5   providing accurate signals to enter a trade without repainting! It can be applied to any financial assets:   forex, cryptocurrencies, metals, stocks, indices .  Watch  the video  (6:22) with an example of processing only one signal that paid off the indicator! MT4 version is here It will provide pretty accurate trading signals and tell you when it's best to open a trade and close it. Most traders improve their trading results during the first trading week with the help of
Yeni Başlayanlar veya Uzman Tüccarlar için En İyi Çözüm! Bu gösterge benzersiz, yüksek kaliteli ve uygun fiyatlı bir ticaret aracıdır çünkü bir dizi tescilli özellik ve gizli bir formül ekledik. Yalnızca BİR grafikle 28 döviz çiftinin tümü için Uyarılar verir. Yeni bir trendin veya scalping fırsatının tam tetik noktasını belirleyebildiğiniz için ticaretinizin nasıl gelişeceğini hayal edin! Yeni temel algoritmalar üzerine inşa edilen bu sistem, potansiyel işlemlerin belirlenmesini ve onaylanma
Gold TMAF MTF - bu en iyi hisse senedi teknik göstergesidir. Gösterge algoritması, bir varlığın fiyat hareketini analiz eder ve oynaklığı ve potansiyel giriş bölgelerini yansıtır. En iyi gösterge sinyalleri: SAT için = TMA2'nin kırmızı üst sınırı TMA1'in kırmızı üst sınırının üzerinde + yukarıdaki kırmızı fraktal gösterge + aynı yönde sarı SR sinyal oku. AL için = TMA2'nin mavi alt sınırı TMA1'in mavi alt sınırının altında + aşağıdan mavi fraktal gösterge + aynı yönde aqua SR sinyal oku. Göste
FxaccurateLS
Shiv Raj Kumawat
WHY IS OUR FXACCCURATE LS MT5 THE PROFITABLE ? PROTECT YOUR CAPITAL WITH RISK MANAGEMENT Gives entry, stop and target levels from time to time. It finds Trading opportunities by analyzing what the price is doing during established trends. POWERFUL INDICATOR FOR A RELIABLE STRATEGIES We have made these indicators with a lot of years of hard work. It is made at a very advanced level. Established trends provide dozens of trading opportunities, but most trend indicators completely ignore them! The
Trade smarter, not harder: Empower your trading with Harmonacci Patterns This is arguably the most complete harmonic price formation auto-recognition indicator you can find for the MetaTrader Platform. It detects 19 different patterns, takes fibonacci projections as seriously as you do, displays the Potential Reversal Zone (PRZ) and finds suitable stop-loss and take-profit levels. [ Installation Guide | Update Guide | Troubleshooting | FAQ | All Products ] It detects 19 different harmonic pri
The starting price is $75. It will increase to $120 after 30 sales. After purchase, please contact me to get your trading tips + more information for a great bonus!   Lux Trend   is a professional strategy based on using Higher Highs and Lower Highs to identify and draw Trendline Breakouts!   Lux Trend  utilizes two Moving Averages to confirm the overall trend direction before scanning the market for high-quality breakout opportunities, ensuring more accurate and reliable trade signals. This
MACD Gün İçi Trend PRO, 1960'larda Gerald Appel tarafından oluşturulan orijinal MACD'nin uyarlanmasıyla geliştirilen bir Göstergedir. Yıllarca süren ticaret sayesinde, MACD'nin parametrelerini Fibonacci oranlarıyla değiştirerek, trend hareketlerinin sürekliliğinin daha iyi bir sunumunu sağladığımız ve bir fiyat trendinin başlangıcını ve sonunu daha verimli bir şekilde tespit etmeyi mümkün kıldığımız gözlemlendi. Fiyat trendlerini tespit etmedeki etkinliği sayesinde, üst ve dip farklarını çok
Yazarın diğer ürünleri
Time Candle Suleiman
Suleiman Alhawamdah
5 (3)
Lütfen olumlu bir yorum bırakın. Önemli Not: Ekran görüntülerinde gösterilen resim, benim göstergelerim olan Suleiman Levels göstergesi ve RSI Trend V göstergesine aittir ve elbette bağlı olan "Time Candle" da dahildir. Bu "Time Candle", ileri düzey analiz ve özel seviyeler için kapsamlı bir gösterge olan Suleiman Levels'in orijinal bir parçasıdır. Beğenirseniz "RSI Trend V" göstergesini deneyin: https://www.mql5.com/en/market/product/132080 ve beğenirseniz "Suleiman Levels" göstergesini deneyi
FREE
RSI Trend V1
Suleiman Alhawamdah
Önemli Not: Ekran görüntülerinde gösterilen "Bazı görseller" benim indikatörlerim olan Suleiman Levels Indicator ve RSI Trend V Indicator 'dan alınmıştır. RSI Trend V Indicator trend belirleme amacıyla tasarlanmış olup, Fibonacci ile entegre edilerek hedef bölgeleri ve potansiyel geri dönüş noktalarını belirler. Bu, genel trend yönünü belirlemede son derece güçlü, katı ve kullanışlı bir indikatördür. Potansiyel fiyat hareketi geri dönüş bölgelerinde görünen yükseliş ve düşüş okları içerir. Anca
ÖNEMLİ: BU UZMAN YALNIZCA VERİ İNDİRME İÇİNDİR VE HERHANGİ BİR İŞLEM GERÇEKLEŞTİRMEZ Uzman Danışmanın İşlevi: Geçmiş verileri doğru, hatasız ve hızlı bir şekilde indirmek. Gereklilik: Bazen, çizimler, grafikler, çizgiler ve oklar içeren belirli göstergelerin grafiğe yerleştirildiğinde veya zaman dilimleri arasında geçiş yapıldığında garip davrandığını fark ederiz. Çizimler ve çizgiler ana ekranda doğal olmayan bir şekilde hareket edebilir. Bu sorun, bazı göstergelerin ihtiyaç duyabileceği gerekl
FREE
Filtrele:
purcemputpcp
57
purcemputpcp 2025.03.18 05:21 
 

Good indicator with helpful support 👍

Suleiman Alhawamdah
6674
Geliştiriciden yanıt Suleiman Alhawamdah 2025.03.19 20:27
Thank you my friend.. You are welcome and I wish you all the best
Zone William
51
Zone William 2025.02.24 09:08 
 

I am completely satisfied with this indicator; there is effort and solid underlying content behind it. I am also satisfied with the creator; he is helpful.

Suleiman Alhawamdah
6674
Geliştiriciden yanıt Suleiman Alhawamdah 2025.02.24 15:02
All my thanks to you my friend Zone. Your words reflect your nobility and character... I wish you all the best.
Boluwatife_06
30
Boluwatife_06 2025.01.30 12:37 
 

Kullanıcı incelemeye herhangi bir yorum bırakmadı

Suleiman Alhawamdah
6674
Geliştiriciden yanıt Suleiman Alhawamdah 2025.01.30 14:10
thank you Boluwatife for your support and review.
I truly appreciate it. At the moment, I don’t have a group, as managing one requires time and responsibility. However, I think the idea of a group for sharing ideas is great, especially since using the indicator and Levels with certain trading and financial analysis methods, such as ICT or other, leads to very positive results.
Sebastian Schmidt
1266
Sebastian Schmidt 2025.01.20 12:59 
 

Kullanıcı incelemeye herhangi bir yorum bırakmadı

Suleiman Alhawamdah
6674
Geliştiriciden yanıt Suleiman Alhawamdah 2025.01.25 19:24
Thank you very much, Mr. Sebastian, for your kind review...truly appreciate your encouragement.
I wish you success and good luck in your chart analysis.
micllAblen
65
micllAblen 2025.01.12 19:06 
 

Kullanıcı incelemeye herhangi bir yorum bırakmadı

Suleiman Alhawamdah
6674
Geliştiriciden yanıt Suleiman Alhawamdah 2025.01.13 22:06
Thank you so much. I was pleased with your review. I wish you all the best with your strategy.
David T
303
David T 2024.12.23 06:22 
 

After only 1 day of testing and now seeing this during live market conditions I can already see that this performs as intended . The Engulfing signals do align with the trend and multi time frame confluence is suggested to go with the higher TF...can be used for scalping as well . Seller was every responsive and welcomed my suggestion for an update...looking forward to that if it can be implemented due to the already complexity of the original code. Even though I am 99% on MT4 this indicator made me use my MT5 terminal more and more as I see the potential in this indicator. Got the full version at a great price. Highly recommended

Suleiman Alhawamdah
6674
Geliştiriciden yanıt Suleiman Alhawamdah 2024.12.23 09:43
Thank David so much, for your kind review.
I will try to add the timeframes soon, but as I mentioned, this might take some time since the code for the levels is very large, complex, and interconnected with other codes.
I wish you all the best and success in your trading!
İncelemeye yanıt
Sürüm 7.7 2025.03.21
SULEIMAN LEVELS v 7.7:

A minor fix for the previous update v 7.6, related to two types of side trendlines.
Sürüm 7.6 2025.03.21
SULEIMAN LEVELS v7.6:

1- Reconstruction of two types of side trendlines (which are usually in light colors: Uptrend in Honeydew color and Downtrend in LavenderBlush). These trendlines have been completely rebuilt to draw their lines using a different mechanism than before, based on new peak and trough detection rules.
The other dark trendlines (green or brown) still operate using the same mechanism.

2-Updates to the default settings for black support and resistance lines: The number of past candles will now be 20-30-40, with Line #3 enabled by default.."You can hide the third line or make any modifications through the control panel".

3-Various fixes and improvements.
Sürüm 7.5 2025.03.14
SULEIMAN LEVELS v 7.5:

-Keeping the manual drawing of rectangles and trend lines without automatic deletion after changing the time frame or switching between pairs.
-Some improvements and fixes for minor issues.
Sürüm 7.4 2025.03.09
SULEIMAN LEVELS v 7.4:

Some minor fixes and improvements.
Sürüm 7.3 2025.03.07
SULEIMAN LEVELS v 7.3:

1-Added floating buttons for quick switching between candle bodies or wicks for side trendlines.
2-Added floating buttons for quick switching between candle bodies or wicks for support and resistance lines.
"There may sometimes be a very slight delay due to data processing" so Still under testing and improvements.

The market must be open for the switching to take effect.
The focus of switching is on side trendlines because the chart may sometimes rely on wicks for its movements or on the candle body.
3-Adjustments and Enhancements:
-Reset some default settings (All settings are adjustable according to your analysis preferences).
-Adjusted the previous candle check settings for side trendlines to 10-15-30-45.
-Adjusted the previous candle check settings for support and resistance lines to 20-30-50.
Note:
It is not necessary to enable all features in the indicator at once. Doing so may cause analysis confusion and overwhelm you. Essential elements such as colored level lines, side trendlines, support and resistance lines, pullbacks, and thick-colored support and resistance lines might be sufficient.

The remaining settings are optional—you can enable them and assess whether they add value to your analysis or serve as extra precautions for all possible scenarios.
Sürüm 7.1 2025.02.24
SULEIMAN LEVELS v 7.1:

1- Updating the option related to "thick colored lines" for displaying Touching Sup/Res Line or Retesting Previous Top/Bottom.
2- Controlling the number of previous candles used to calculate Sup/Res Line or Retesting Previous Top/Bottom for "thick colored lines".
3- Option to display only the last two thick colored lines or all lines (default: last two thick lines, which is recommended).
- and Control over line colors.
- Adding explanatory notes about Modes for the Touch Line level types.
4- Changing the default settings for the number of previous candles used to calculate Support/Resistance Lines and Side Trend Lines from 15-30-60 to 10-15-30. Of course, you can choose different values as you see fit to display Support/Resistance Lines and Side Trend Lines.
5- General improvements.
Sürüm 7.0 2025.02.16
SULEIMAN LEVELS v7.00:
Some improvements to enhance the efficiency and accuracy of the indicator.
Added an option to show or hide the "white text for tips."
Updated some default settings of the indicator.
Sürüm 6.0 2025.01.16
SULEIMAN LEVELS v 6.00
Fixing some errors, and disappearance of some lines due to chart update.
Sürüm 5.0 2025.01.14
SULEIMAN LEVELS v 5.00

Fixed some minor bugs.
Sürüm 4.0 2025.01.11
SULEIMAN LEVELS v 4.00

Fixing some minor bugs, removing remnants of some old and accumulated touchline lines.


Sürüm 3.0 2025.01.04
SULEIMAN LEVELS v 3.00
Now you can draw manual trend lines on the chart without them being automatically deleted after changing the time frame or switching to another pair.
Sürüm 2.0 2024.12.17
SULEIMAN LEVELS v 2.00
Full control over lower cloud settings:
Line Cloud 1
Line Cloud 2
Line Cloud 3
Line Cloud 4