• Overview
  • Reviews
  • Comments

FVG for MT5

"Fair Value Gap" (FVG) Indicator - Unlock the Power of Market Imbalances

The world of trading is full of hidden opportunities, but only those with the right tools can identify and exploit them effectively. Our FVG Indicator is designed to help you do just that. If you’re a trader looking to enhance your market reading abilities and identify the best entry and exit points, the FVG Indicator is your perfect ally.

What is a Fair Value Gap (FVG)?

The concept of a Fair Value Gap refers to a discrepancy between supply and demand that creates a "gap" in the price chart. This gap represents an area where the price might return to fill that imbalance, making these zones potentially valuable for trading opportunities. These gaps are created during rapid price movements and can be a key to understanding future market behavior.

Why is the FVG Indicator Essential?

The FVG Indicator allows you to easily spot these imbalance areas on the chart, highlighting where the price might return to fill the gap. This information is crucial for any trading strategy, as it provides traders with the ability to identify significant price levels where retracements or accelerations may occur.

Key Features of the FVG Indicator

  • Automatic Gap Identification: The FVG Indicator automatically scans the chart to identify Fair Value Gaps, saving you time and reducing the chance of human error.
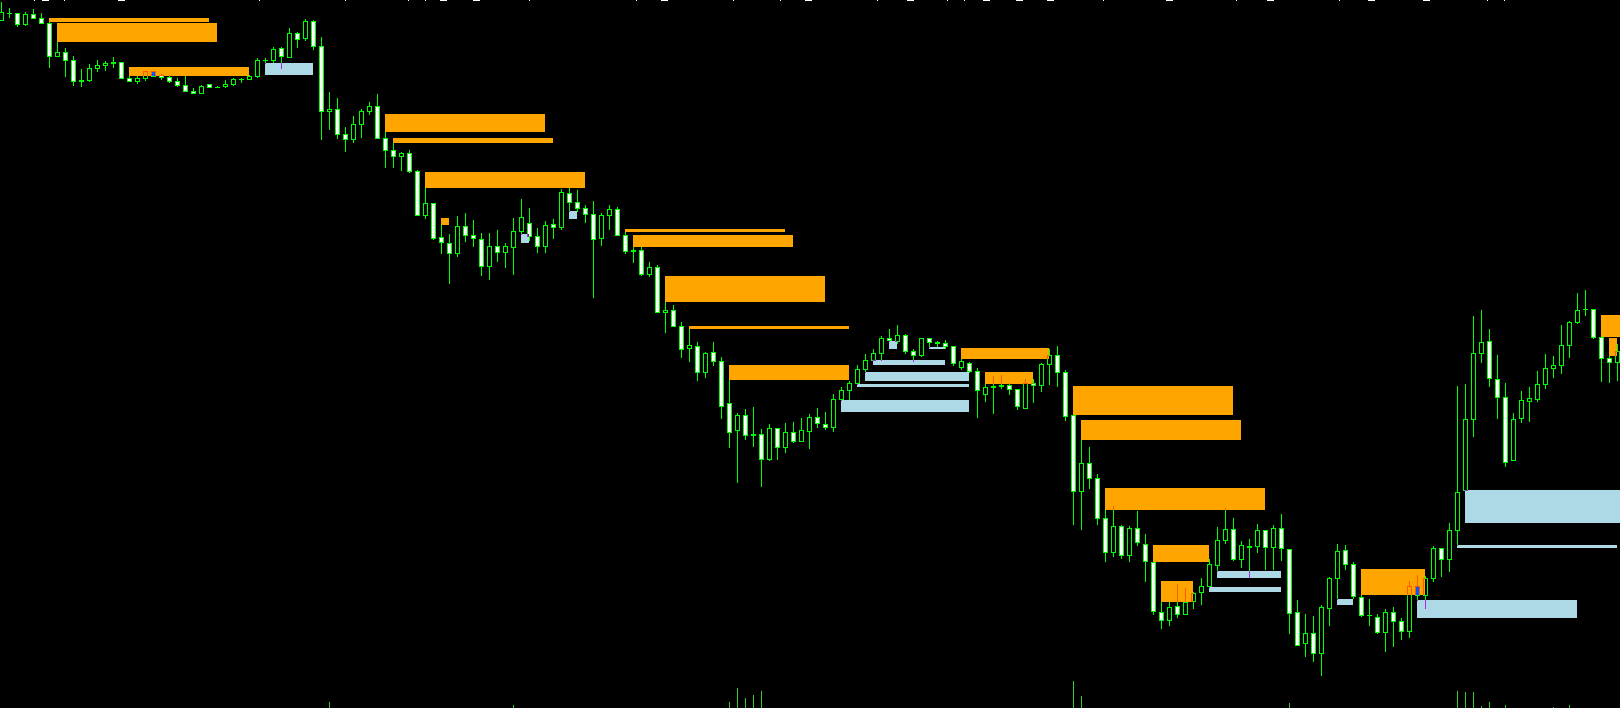
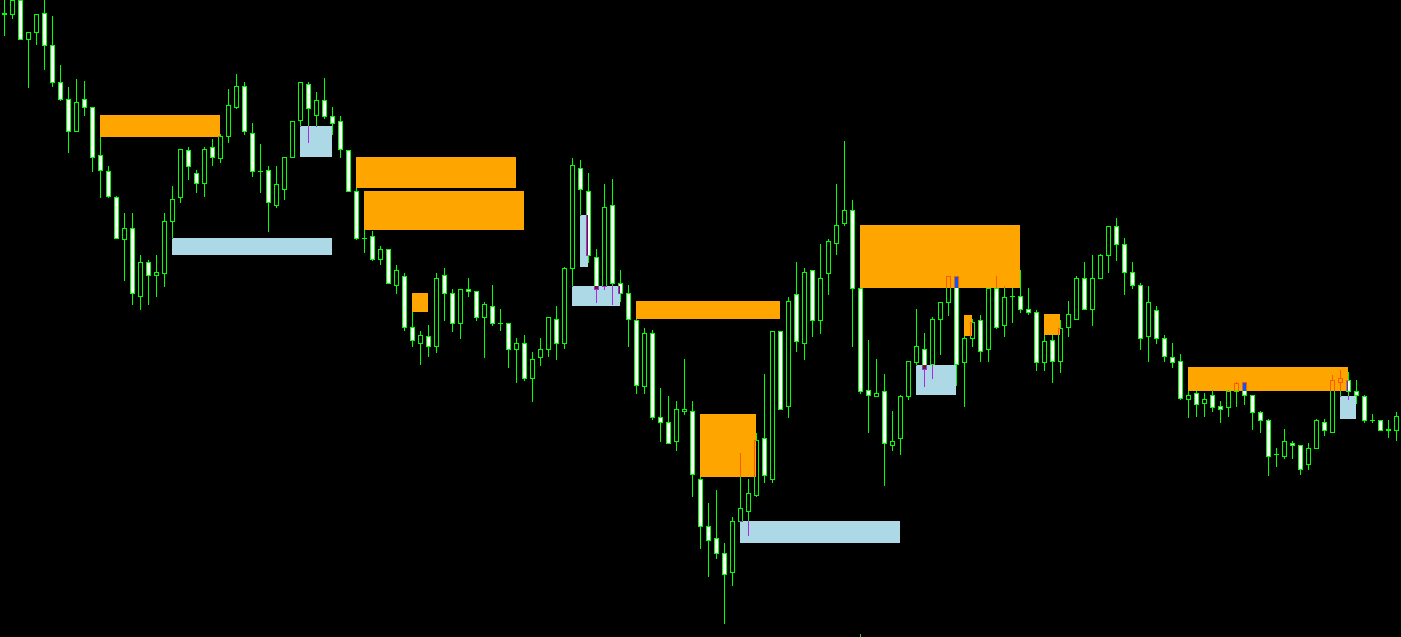
  • Clear Visual Signals: Gap areas are clearly marked on the chart with distinct indicators, allowing you to instantly see where potential trading opportunities lie.
  • Fully Customizable: You can configure the indicator to meet your specific needs, adjusting the parameters to suit your trading strategy. Whether you prefer short-term or long-term trading, the FVG Indicator adapts to your requirements.
  • Suitable for All Traders: Whether you’re a beginner or a professional, the FVG Indicator is easy to use and can be integrated into any trading style.
  • Cross-Platform Compatibility: The FVG Indicator is compatible with various trading platforms, allowing you to use it across multiple instruments and markets.

How to Use the FVG Indicator in Your Trading Strategy?

  1. Installation: Add the FVG Indicator to the chart of your chosen financial instrument.
  2. Configuration: Set the indicator’s parameters according to your preferences. You can adjust the gap sensitivity and other criteria to fine-tune the signals.
  3. Analysis: Observe the chart and note where the FVG Indicator has identified gap areas. These are the key points where you may want to focus your attention.
  4. Decision: Use the information provided by the indicator to decide when to enter or exit the market. The FVG Indicator not only helps you find the best opportunities but can also be used for risk management by identifying potential retracement zones.

Benefits of the FVG Indicator

  • Improved Precision: With the FVG Indicator, you will have a clearer view of where the market might be headed, improving your ability to anticipate future movements.
  • Risk Reduction: By identifying imbalance areas, you can avoid entering trades at the wrong time and improve your risk management.
  • Increased Opportunities: By detecting gaps, you will have access to more trading opportunities, allowing you to choose the best entry and exit points with greater confidence.


More from author
Enhance Your Trading Strategies with the "Order Block" Indicator for MT4 Discover the "Order Block" Indicator: The "Order Block" Indicator for MT4 is designed to help you precisely identify order blocks in the market by marking the highs and lows of the order block candles. This powerful tool enables you to understand where large institutions place their orders, improving your ability to predict market movements. Key Features: Precise Order Block Detection: Automatically highlights the highs and
FREE Spread indicator for MetaTrader 4 this indicator includes: -average spread -current spread -minimum spread -maximum spread If you are interested in my products I recommend you visit my page where you can find: Experts Advisors:  https://www.mql5.com/it/market/product/119456?source=Site+Profile indicators:  https://www.mql5.com/it/market/product/120038?source=Site+Profile I hope the spread indicator will be useful to you. https://www.mql5.com/it/users/kappa05
FREE
IMPORTANT: The indicator will remain at the price of $34.90 until the release of the update scheduled for July 16, 2024. The New Price will be $49.90 (taxes excluded) FVG indicator. If you are an SMC trader this indicator will be very useful to you, it automatically identifies the FVGs on the graph distinguishing them into 2 types: bearish FVGs and bullish FVGs (see the photos to understand better). This indicator works on any Timeframe and on any market you want to use it. If you are interested
Volume Profile Indicator for MT4 Gain a trading edge with the "Volume Profile" indicator for MetaTrader 4 (MT4). This advanced technical analysis tool allows you to precisely identify key support and resistance levels based on transaction volume. Easily visualize market areas of high interest, where trading volumes are highest, and use this information to make more informed trading decisions. Key Features: Clear and detailed visualization : The indicator displays volume histograms directly on th
Presentation of the "Color Range Indicator" The "Color Range Indicator" is a powerful technical analysis tool designed for the MT4 platform, perfect for traders who want a clear and immediate view of market trends. This indicator draws a colored line based on the current trend, making it easier to interpret price movements. Indicator Description: Green line : Indicates an uptrend. Use this signal to consider buying opportunities. Red line : Indicates a downtrend. Use this signal to consider sell
The Follow Line indicator is an essential tool for traders who want to identify and follow market trends with precision. This indicator dynamically adapts to price changes, drawing a line that smoothly and continuously tracks price movements. With its visual simplicity and effectiveness in signaling trend changes, Follow Line is a great addition to any trader’s strategy. Key Features: Trend Tracking: Follow Line closely follows the price, making it easy for traders to identify ongoing market tre
OB Indicator
Nicola Capatti
Order Block indicator, highs and lows; the indicator focuses mainly on OBs, on the chart they are represented with a horizontal line on the minimum and maximum of that candle. While for the maximums and minimums only one line is marked (see the images to understand better). The indicator is for MT5, it works on all Timeframes, on any Forex Pair, on any index and on crypto markets. (For any information on the indicator do not hesitate to contact me). Limited time discount (50%) 74.90$ -> 38.60$
Expert Advisor for scalping; This EA was built for monthly profitability. Works on any asset: Forex, Indices, Crypto and Stocks. Perfectly usable in MT5 tester and usable on any TimeFrame. The EA has various inputs available to customize operations: -Lots -Risk% (0 = Fix) -OrderDist (the distance between one order and another, the distance is calculated in points not pips) -TP (in points) -Sl (in points) -TrailingStopTrigger(the trailing stop trigger point in points) -TrailingStop(distance from
Highs, Lows and Bos Indicator for MT5; The indicator works on any type of market and on all TimeFrames. It also works on the MetaTrader5 Tester. the main function of the indicator is to identify the highs and lows by marking them with a point above/below the candle, then with a horizontal line it marks the Bos. It is very simple and intuitive, there are only 2 inputs: -the color of the maximums -the color of the minima For any other information do not hesitate to contact me.
Panel Info Trade For MT5; The indicator has 2 main objects: -An icon chart that you can change Timeframe, zoom, Forex Pair, crypto....the position of the graph can be modified via the (x;y) inputs. The chart is perfectly usable in the MT5 tester. If the graph isn't for you and doesn't help you with anything, you can press the button on the top right to make it smaller. -the second object is a dynamic control panel where you can change plots, place sl and tp, BE, close partial... (if you watch th
Currency Strength Index (CSI) Indicator BEFORE ACTIVATING THE INDICATOR, REMEMBER TO SET "TRUE" TO DISPLAY THE PAIRS The Currency Strength Index (CSI) Indicator is a powerful tool used in forex trading to measure the relative strength of major currencies. This indicator helps traders identify the strongest and weakest currencies at any given time, enabling them to make more informed trading decisions. Key Features: Comparative Analysis: Compares the strength of different currencies based on his
In the world of trading, the key to success lies in having the right tools at the right time. Our innovative Volume Profile indicator was developed with one goal in mind: to provide traders with unprecedented access to vital market activity information. This cutting-edge tool allows you to not only see where and when volumes are traded but also to understand market depth with clarity never seen before. Main Features: Temporal Flexibility: Set the analysis range up to 1800 minutes to perfectly ma
Maximize Your Trading Opportunities with the "Auto Trendlines" Indicator Discover the "Auto Trendlines" Indicator: "Auto Trendlines" is the essential tool for every technical trader. This indicator automatically plots trend lines, pinpointing support and resistance levels with surgical precision. It's ideal for those looking to capitalize on market breakouts and reversals. Key Features: Automatic Trendline Plotting: Identifies and draws crucial trend lines without manual intervention. Advanced C
Optimize Your Trading Decisions with the "autoFibo" Indicator Discover the "autoFibo" Indicator: "autoFibo" is the essential analysis tool for traders who want to fully leverage Fibonacci levels without the hassle of manual plotting. This indicator automates the Fibonacci retracement process, providing instant visual access to key support and resistance zones. Key Features: Automatic Fibonacci Retracement: Automatically plots Fibonacci levels, making it easy to identify support and resistance zo
Enhance Your Trading Performance with the "Better Volume" Indicator Discover the "Better Volume" Indicator: The "Better Volume" is the essential market volume analysis tool for traders aiming to stand out. It analyzes tick volumes with unprecedented accuracy, featuring an advanced moving average function (PERIOD_MA) and customizable buy and sell alerts. Key Features: Advanced Volume Analysis: Recognize volume peaks signaling crucial price movements. Intuitive Buy and Sell Alerts: Stay one step a
The SuperTrend is one of the most effective and widely used technical indicators in trading, ideal for identifying trend direction and generating entry and exit signals. Based on volatility and trend, this indicator dynamically adapts to market conditions, providing a clear visual reference for traders. Key Features: Trend Detection: The SuperTrend follows the market trend, drawing a line that positions above the price in a downtrend and below in an uptrend. Ease of Use: Thanks to its intuitive
New Combined Indicator - 3 in 1 Are you looking for trading tools that can enhance your market analysis and investment strategies? We have combined three of our best indicators into a single powerful and convenient solution, allowing you to get the most value for your trading. 1. Order Block Indicator (previously sold for $32.90) The Order Block Indicator is an essential tool for identifying areas of strong institutional interest within the market. This indicator marks the highs and lows of orde
Filter:
No reviews
Reply to review