• Genel bakış
  • İncelemeler
  • Yorumlar

FVG for MT5

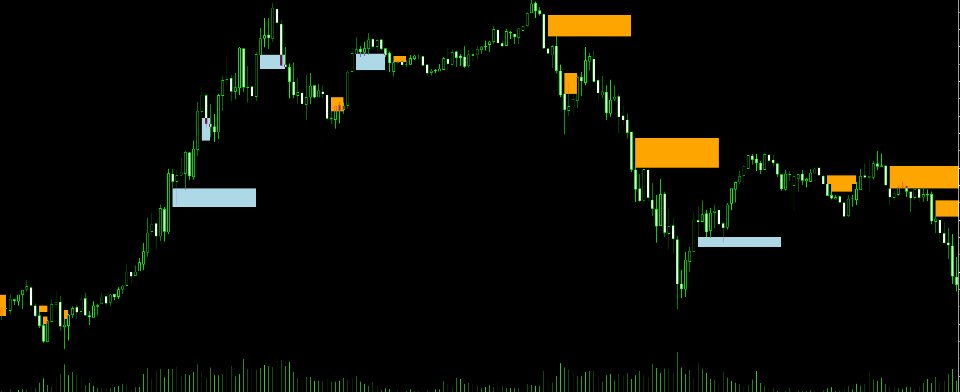
"Fair Value Gap" (FVG) Göstergesi - Piyasa Dengesizliklerinin Gücünü Keşfedin

Ticaret dünyası, yalnızca doğru araçlara sahip olanların etkili bir şekilde tanımlayıp yararlanabileceği gizli fırsatlarla doludur. FVG Göstergemiz, bunu yapmanıza yardımcı olmak için tasarlanmıştır. Piyasayı okuma yeteneğinizi geliştirmek ve en iyi giriş ve çıkış noktalarını belirlemek isteyen bir tüccarsanız, FVG Göstergesi mükemmel müttefikinizdir.

Fair Value Gap (FVG) Nedir?

Fair Value Gap kavramı, fiyat grafiğinde bir "gap" oluşturan arz ve talep arasındaki bir uyumsuzluğu ifade eder. Bu boşluk, fiyatın bu dengesizliği doldurmak için geri dönebileceği bir alanı temsil eder ve bu alanlar, ticaret fırsatları için potansiyel olarak değerli olabilir. Bu boşluklar hızlı fiyat hareketleri sırasında oluşur ve gelecekteki piyasa davranışını anlamada bir anahtar olabilir.

FVG Göstergesi Neden Önemlidir?

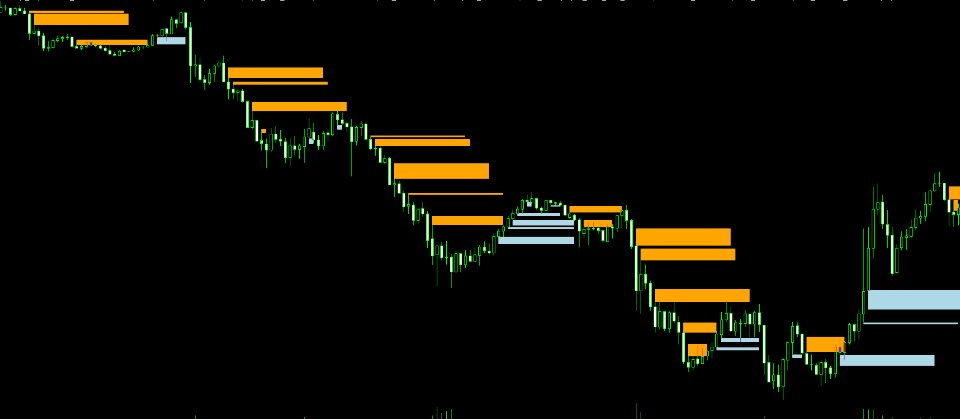
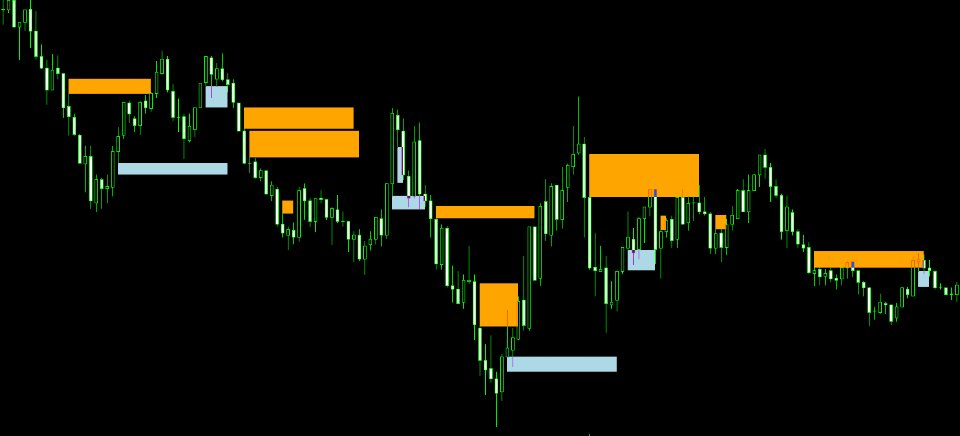
FVG Göstergesi, grafik üzerinde bu dengesizlik alanlarını kolayca tespit etmenizi sağlar ve fiyatın bu boşluğu doldurmak için geri dönebileceği yerleri vurgular. Bu bilgi, herhangi bir ticaret stratejisi için çok önemlidir, çünkü tüccarlara geri çekilmeler veya hızlanmaların meydana gelebileceği önemli fiyat seviyelerini belirleme yeteneği sağlar.

FVG Göstergesinin Temel Özellikleri

  • Otomatik Gap Tespiti: FVG Göstergesi, Fair Value Gap'leri belirlemek için grafiği otomatik olarak tarar, bu da size zaman kazandırır ve insan hatası olasılığını azaltır.
  • Net Görsel Sinyaller: Boşluk alanları grafik üzerinde belirgin göstergelerle açıkça işaretlenir ve potansiyel ticaret fırsatlarının nerede olduğunu hemen görmenizi sağlar.
  • Tamamen Özelleştirilebilir: Göstergede yer alan parametreleri ayarlayarak ihtiyaçlarınıza göre yapılandırabilirsiniz. İster kısa vadeli ister uzun vadeli ticaret yapmayı tercih edin, FVG Göstergesi gereksinimlerinize uyum sağlar.
  • Tüm Tüccarlar için Uygundur: Başlangıç seviyesinde veya profesyonel olun fark etmez, FVG Göstergesi kullanımı kolaydır ve her ticaret stiline entegre edilebilir.
  • Çoklu Platform Uyumluluğu: FVG Göstergesi, çeşitli ticaret platformlarıyla uyumludur ve bunu birden fazla enstrüman ve piyasada kullanmanıza olanak tanır.

FVG Göstergesini Ticaret Stratejinize Nasıl Entegre Edebilirsiniz?

  1. Kurulum: Seçtiğiniz finansal enstrümanın grafiğine FVG Göstergesi ekleyin.
  2. Yapılandırma: Gösterge parametrelerini tercihlerinize göre ayarlayın. Sinyalleri daha iyi hale getirmek için boşluk hassasiyetini ve diğer kriterleri ayarlayabilirsiniz.
  3. Analiz: Grafiği gözlemleyin ve FVG Göstergesinin boşluk alanlarını belirlediği yerleri not alın. Bunlar, dikkatinizi odaklamanız gereken anahtar noktalardır.
  4. Karar Verme: Piyasaya ne zaman girip çıkacağınıza karar vermek için gösterge tarafından sağlanan bilgileri kullanın. FVG Göstergesi yalnızca en iyi fırsatları bulmanıza yardımcı olmakla kalmaz, aynı zamanda geri çekilme potansiyeli taşıyan bölgeleri belirleyerek risk yönetimi için de kullanılabilir.

FVG Göstergesinin Avantajları

  • Gelişmiş Hassasiyet: FVG Göstergesi ile piyasanın nereye yönlenebileceğini daha net bir şekilde görebilir ve gelecekteki hareketleri tahmin etme yeteneğinizi geliştirebilirsiniz.
  • Risk Azaltma: Dengesizlik alanlarını belirleyerek, yanlış zamanda ticaret yapmaktan kaçınabilir ve risk yönetiminizi iyileştirebilirsiniz.
  • Artan Fırsatlar: Boşlukları tespit ederek daha fazla ticaret fırsatına erişebilir ve en iyi giriş ve çıkış noktalarını daha fazla güvenle seçebilirsiniz.

Yazarın diğer ürünleri
Enhance Your Trading Strategies with the "Order Block" Indicator for MT4 Discover the "Order Block" Indicator: The "Order Block" Indicator for MT4 is designed to help you precisely identify order blocks in the market by marking the highs and lows of the order block candles. This powerful tool enables you to understand where large institutions place their orders, improving your ability to predict market movements. Key Features: Precise Order Block Detection: Automatically highlights the highs and
FREE Spread indicator for MetaTrader 4 this indicator includes: -average spread -current spread -minimum spread -maximum spread If you are interested in my products I recommend you visit my page where you can find: Experts Advisors:  https://www.mql5.com/it/market/product/119456?source=Site+Profile indicators:  https://www.mql5.com/it/market/product/120038?source=Site+Profile I hope the spread indicator will be useful to you. https://www.mql5.com/it/users/kappa05
FREE
IMPORTANT: The indicator will remain at the price of $34.90 until the release of the update scheduled for July 16, 2024. The New Price will be $49.90 (taxes excluded) FVG indicator. If you are an SMC trader this indicator will be very useful to you, it automatically identifies the FVGs on the graph distinguishing them into 2 types: bearish FVGs and bullish FVGs (see the photos to understand better). This indicator works on any Timeframe and on any market you want to use it. If you are interested
Volume Profile Indicator for MT4 Gain a trading edge with the "Volume Profile" indicator for MetaTrader 4 (MT4). This advanced technical analysis tool allows you to precisely identify key support and resistance levels based on transaction volume. Easily visualize market areas of high interest, where trading volumes are highest, and use this information to make more informed trading decisions. Key Features: Clear and detailed visualization : The indicator displays volume histograms directly on th
Presentation of the "Color Range Indicator" The "Color Range Indicator" is a powerful technical analysis tool designed for the MT4 platform, perfect for traders who want a clear and immediate view of market trends. This indicator draws a colored line based on the current trend, making it easier to interpret price movements. Indicator Description: Green line : Indicates an uptrend. Use this signal to consider buying opportunities. Red line : Indicates a downtrend. Use this signal to consider sell
Follow Line göstergesi, piyasa eğilimlerini doğru bir şekilde belirlemek ve izlemek isteyen yatırımcılar için vazgeçilmez bir araçtır. Bu gösterge, fiyat değişimlerine dinamik olarak uyum sağlar ve fiyat hareketlerini düzgün ve sürekli bir şekilde izleyen bir çizgi çizer. Görsel sadeliği ve trend değişimlerini sinyallemede etkinliği ile Follow Line, her yatırımcının stratejisine mükemmel bir katkı sağlar. Ana Özellikler: Trend Takibi: Follow Line, fiyatı yakından takip eder ve yatırımcıların mev
Order Block indicator, highs and lows; the indicator focuses mainly on OBs, on the chart they are represented with a horizontal line on the minimum and maximum of that candle. While for the maximums and minimums only one line is marked (see the images to understand better). The indicator is for MT5, it works on all Timeframes, on any Forex Pair, on any index and on crypto markets. (For any information on the indicator do not hesitate to contact me). Limited time discount (50%) 74.90$ -> 38.60$
Expert Advisor for scalping; This EA was built for monthly profitability. Works on any asset: Forex, Indices, Crypto and Stocks. Perfectly usable in MT5 tester and usable on any TimeFrame. The EA has various inputs available to customize operations: -Lots -Risk% (0 = Fix) -OrderDist (the distance between one order and another, the distance is calculated in points not pips) -TP (in points) -Sl (in points) -TrailingStopTrigger(the trailing stop trigger point in points) -TrailingStop(distance from
Highs, Lows and Bos Indicator for MT5; The indicator works on any type of market and on all TimeFrames. It also works on the MetaTrader5 Tester. the main function of the indicator is to identify the highs and lows by marking them with a point above/below the candle, then with a horizontal line it marks the Bos. It is very simple and intuitive, there are only 2 inputs: -the color of the maximums -the color of the minima For any other information do not hesitate to contact me.
Panel Info Trade For MT5; The indicator has 2 main objects: -An icon chart that you can change Timeframe, zoom, Forex Pair, crypto....the position of the graph can be modified via the (x;y) inputs. The chart is perfectly usable in the MT5 tester. If the graph isn't for you and doesn't help you with anything, you can press the button on the top right to make it smaller. -the second object is a dynamic control panel where you can change plots, place sl and tp, BE, close partial... (if you watch th
Para Birimi Güç Endeksi (Currency Strength Index - CSI) Göstergesi GÖSTERGEYİ ETKİNLEŞTİRMEDEN ÖNCE, PARİTELERİ GÖRÜNTÜLEMEK İÇİN "TRUE" OLARAK AYARLADIĞINIZDAN EMİN OLUN Para Birimi Güç Endeksi (Currency Strength Index - CSI) Göstergesi, forex ticaretinde ana para birimlerinin göreceli gücünü ölçmek için kullanılan güçlü bir araçtır. Bu gösterge, tüccarların belirli bir zamanda en güçlü ve en zayıf para birimlerini belirlemelerine yardımcı olarak daha bilinçli ticaret kararları vermelerini sağl
In the world of trading, the key to success lies in having the right tools at the right time. Our innovative Volume Profile indicator was developed with one goal in mind: to provide traders with unprecedented access to vital market activity information. This cutting-edge tool allows you to not only see where and when volumes are traded but also to understand market depth with clarity never seen before. Main Features: Temporal Flexibility: Set the analysis range up to 1800 minutes to perfectly ma
Maximize Your Trading Opportunities with the "Auto Trendlines" Indicator Discover the "Auto Trendlines" Indicator: "Auto Trendlines" is the essential tool for every technical trader. This indicator automatically plots trend lines, pinpointing support and resistance levels with surgical precision. It's ideal for those looking to capitalize on market breakouts and reversals. Key Features: Automatic Trendline Plotting: Identifies and draws crucial trend lines without manual intervention. Advanced C
Optimize Your Trading Decisions with the "autoFibo" Indicator Discover the "autoFibo" Indicator: "autoFibo" is the essential analysis tool for traders who want to fully leverage Fibonacci levels without the hassle of manual plotting. This indicator automates the Fibonacci retracement process, providing instant visual access to key support and resistance zones. Key Features: Automatic Fibonacci Retracement: Automatically plots Fibonacci levels, making it easy to identify support and resistance zo
Enhance Your Trading Performance with the "Better Volume" Indicator Discover the "Better Volume" Indicator: The "Better Volume" is the essential market volume analysis tool for traders aiming to stand out. It analyzes tick volumes with unprecedented accuracy, featuring an advanced moving average function (PERIOD_MA) and customizable buy and sell alerts. Key Features: Advanced Volume Analysis: Recognize volume peaks signaling crucial price movements. Intuitive Buy and Sell Alerts: Stay one step a
SuperTrend , trend yönünü belirlemek ve giriş-çıkış sinyalleri oluşturmak için ticarette en etkili ve yaygın olarak kullanılan teknik göstergelerden biridir. Volatilite ve trende dayalı olarak, bu gösterge piyasa koşullarına dinamik olarak uyum sağlar ve yatırımcılara net bir görsel referans sunar. Ana Özellikler: Trend Tespiti: SuperTrend piyasa trendini takip eder, düşüş trendinde fiyatın üzerinde, yükseliş trendinde ise fiyatın altında bir çizgi çizer. Kullanım Kolaylığı: Sezgisel grafik göst
Yeni Birleşik Gösterge - 3'ü 1 Arada Piyasa analizlerinizi ve yatırım stratejilerinizi geliştirecek ticaret araçları mı arıyorsunuz? En iyi üç göstergemizi tek bir güçlü ve uygun çözüme birleştirdik, böylece ticaretiniz için en iyi değeri elde etmenizi sağladık. 1. Order Block Göstergesi (daha önce 32,90$'ya satıldı) Order Block Göstergesi, piyasada güçlü kurumsal ilgi alanlarını belirlemek için temel bir araçtır. Bu gösterge, fiyat tersine dönüşlerinin veya trend devamlarının meydana gelebilece
Filtrele:
İnceleme yok
İncelemeye yanıt