• Overview
  • Reviews (2)
  • Comments (1)
  • What's new

Divergence Force

4
Divergence Force Divergence Indicator

Description

Divergence Force 1.0 is an indicator designed to identify divergences between the price of an asset and the MACD (Moving Average Convergence Divergence). This indicator automatically draws trend lines on the highs and lows of the price and MACD, highlighting potential trading opportunities.

Main Features

  • Automatic Divergence Identification: The indicator automatically detects bullish and bearish divergences between the price and the MACD.
  • Trend Line Tracking: Automatically draws trend lines on consecutive highs and lows of the price and compares the trend with MACD highs and lows.
  • Buy and Sell Signals: Clearly displays buy ("Buy") and sell ("Sell") signals on the chart when divergences are identified. Shows "Neutral" when no divergences are detected.
  • Standard MACD Parameters: Uses the standard MACD parameters (12, 26, 9) for calculation, ensuring reliable and recognized results.
  • Compatibility with Different Timeframes: Optimized to work on a 1-hour timeframe but can be applied to other timeframes according to the user's preferences.

How to Use

  1. Installation: Add the indicator to the Indicators folder of your MetaTrader 5 platform.
  2. Apply to Chart: Load the indicator onto the desired chart. The indicator will automatically start drawing trend lines and identifying divergences.
  3. Interpreting Signals:
    • Buy: When a bullish divergence is detected, the indicator will display a "Buy" signal.
    • Sell: When a bearish divergence is detected, the indicator will display a "Sell" signal.
    • Neutral: When no divergences are detected, the indicator will display "Neutral".

Visual Examples

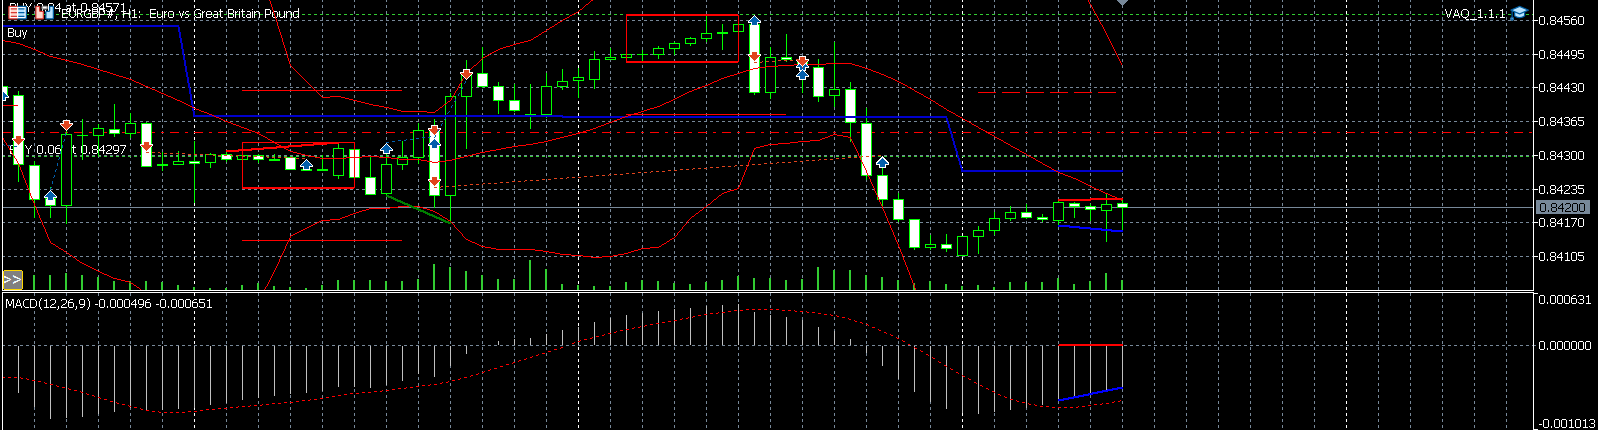
Bullish Divergence (Buy):

  • Two consecutive price lows increasing while the corresponding MACD lows are decreasing.

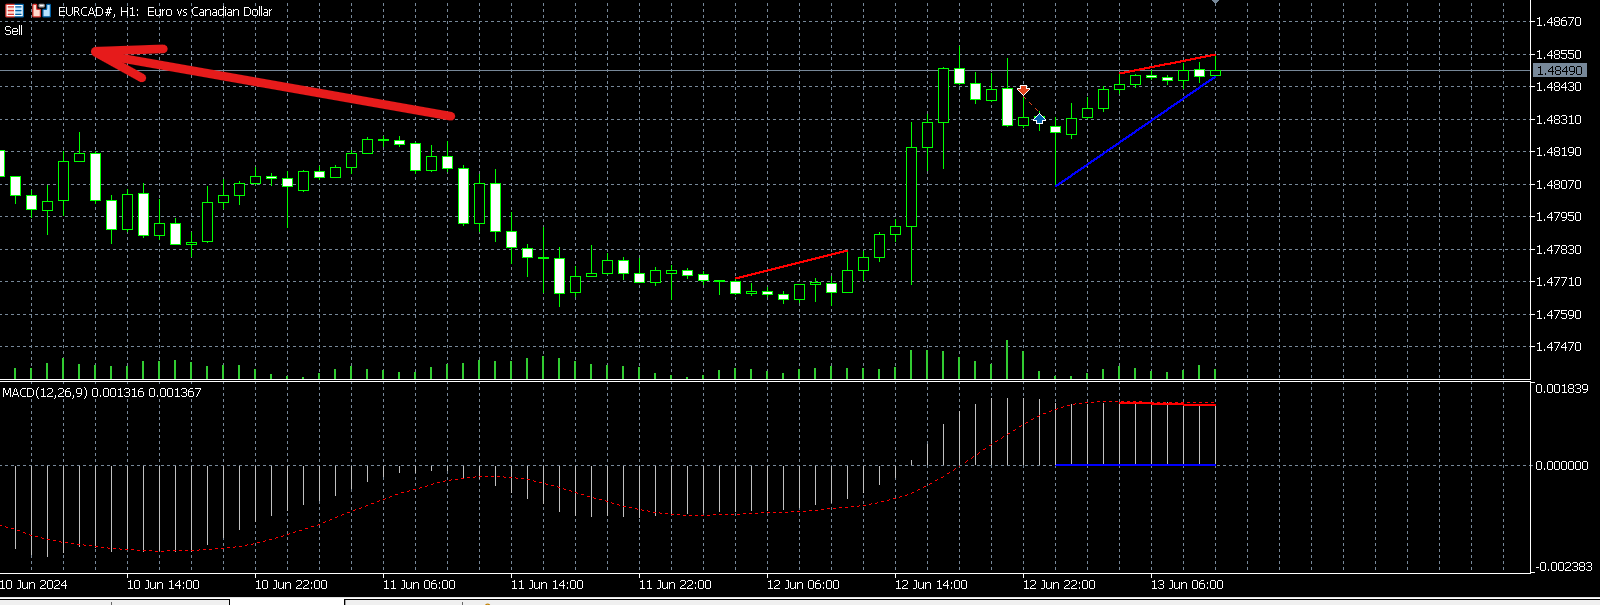
Bearish Divergence (Sell):

  • Two consecutive price highs decreasing while the corresponding MACD highs are increasing.

Conclusion

Divergence Force is a useful indicator for gaining further confirmation in your trading strategy. With its ease of use and advanced features, this indicator can help you improve your trading strategies and increase your operational effectiveness.

Download Divergence Force today and take your trading to the next level!

Reviews 2
Cornelius Theo12
42
Cornelius Theo12 2024.08.21 05:37 
 

not bad, but its just like normal MACD divergence

jose3905
84
jose3905 2024.08.15 23:32 
 

Gostei do seu indicador, você poderia inserir setas para compra e venda? Isso facilita na hora de fazer os testes e otimizações... Muito obrigado.

Recommended products
The indicator plots a curve of the difference between the values ​​of two trading instruments (currency pairs). The purpose of the indicator is to observe the processes of divergence and convergence of the values ​​of two trading instruments. The results obtained can be used for trading strategies of statistical arbitrage, pair trading, correlation, and others. Trading strategy The indicator is attached to the chart of any trading instrument. In the input parameters, the names of trading i
FREE
Just another   Auto Fibonacci Retracement indicator . However, this is the most   Flexible   &   Reliable   one you can find for FREE. If you use this indicator and you like it, please leave a review/comment. If you are looking for a more advanced Fibo indicator, check this Free  Trend-Based Fibo indicator . ### FEATURES ### Auto-calculate up to 7 Fibonacci levels on your customized frame. Adjust levels as your need. Use High/Low price or  Open/Close price to calculate. Freeze the levels and don
FREE
Curver Arrows
Francis Dube
4 (9)
This indicator is a straight port of a well known MetaTrader 4 indicator that is freely available on the Internet. It does not redraw at all. It implements a type of breakout strategy. The arrows indicate market direction. Use the indicator on M15 charts and higher. The indicator draws two bands near price action and generates signals when the price closes below the lower band and also above the upper band. The indicator uses periodic highs and lows to calculate upper and lower threshold bands.
FREE
Divergence Rsi Trader EA
Igor Widiger
4.5 (8)
Divergence RSI Trader is based on divergences in the chart and indicator (RSI Level 14). Divergence RSI Trader's strategy to find lows and highs on the chart and RSI indicator, analyze them and then open positions. EA was tested in the EURUSD H1 in the strategy tester and adjusted to this currency by default. EA has also been tested with other settings at GBPUSD M5 for 10 years and completed with good results. Because this is a free version, there will be no more tests and only updates. Please
FREE
Original MACD
Kirill Paskhin
5 (5)
Moving Average Convergence/Divergence — схождение/расхождение скользящих средних — технический индикатор, разработанный Джеральдом Аппелем (Gerald Appel), используемый в техническом анализе для проверки силы и направления тренда, а также определения разворотных точек. Встроенный в MetaTrader 5 индикатор MACD не соответствует задумке автора (Gerald Appel): -линия MACD графически изображена в виде гистограммы, однако гистограммой отражается разница между линией MACD и сигнальной линией;  -сигнал
FREE
MACD indicators https://mql5.com This MACD indicator looks slightly different from the MACD indicator found in many other charting software. When the value of the signal line parameter is greater than the value of the MACD parameter, the indicator will give a buy prompt, and when the signal line parameter is less than the value of the MACD parameter, the indicator will give a sell prompt.
FREE
Insidious Me
Bin Jumahat Johan
4 (1)
This EA uses the RVI Crossovers. A crossover above the signal line is a bullish indicator, while a crossover below the signal line is a bearish indicator. The Relative Vigor Index (RVI) is a momentum indicator used in technical analysis. It measures the strength of a trend by comparing a security's closing price to its trading range while smoothing the results using a simple moving average (SMA). The Relative Vigor Index is considered a leading indicator, meaning it changes before the trend
FREE
Auto Fibonacci
Ali Gokay Duman
5 (2)
This indicator calculates fibonacci levels via moving averages trend and draw these lines. You can change fast and slow Moving Averages settings for customization. Inputs: Fast MA Time Period :  64 Fast MA Shift: 0 Fast MA Method: Smoothed Fast MA Apply To: Median Price Slow MA Time Period: 32 Slow MA Shift: 0 Slow MA Method: Smoothed Slow MA Apply To: Median Price ZigZag: False ZigZag Color: Red ZigZag Type: DashDot ZigZag Width: VeryThin Fibo Settings TrendFibonacci: True FiboTrendColor: Blac
FREE
This indicator is an automated version of the Fibonacci retracement (Fib) indicator. Deciding the best areas to use when drawing the fib can be tricky and this  indicator was made with that in mind. When you drop it on the chart it will automatically choose the best points to draw the fib with, but in case you aren't satisfied with those regions, you can adjust it as you wish.
FREE
The Moving Average Convergence Divergence (MACD) trading strategy is a popular technical analysis tool that is used to identify changes in momentum and trend direction. The MACD is calculated by subtracting the 26-period exponential moving average (EMA) from the 12-period EMA. A 9-period EMA, called the "signal line," is then plotted on top of the MACD to act as a trigger for buy and sell signals. The MACD is considered to be in bullish territory when the MACD line is above the signal line an
FREE
Renko Chart
Marcin Konieczny
4.08 (12)
This indicator allows to display Renko charts in the indicator window. Renko charts show only price movements that are bigger than the specified box size. It helps to eliminate noise and allows to focus on main trends. Time is not a factor here. Only price movements are taken into account. That's why Renko chart is not synchronized with the main chart it is attached to. Indicator works in two modes: CLOSE - only close prices are taken into account while building the chart HIGH_LOW - only high/
FREE
This indicator is designed to detect high probability reversal patterns: Double Tops/Bottoms with fake breakouts . This is the FREE version of the indicator: https://www.mql5.com/en/market/product/29957 The free version works only on EURUSD and GBPUSD! Double top and bottom patterns are chart patterns that occur when the trading instrument moves in a similar pattern to the letter "W" (double bottom) or "M" (double top). The patterns usually occur at the end of a trend and are used to signal tren
FREE
Free automatic Fibonacci is an indicator that automatically plots a Fibonacci retracement based on the number of bars you select on the BarsToScan setting in the indicator. The Fibonacci is automatically updated in real time as new highest and lowest values appears amongst the selected bars. You can select which level values to be displayed in the indicator settings. You can also select the color of the levels thus enabling the trader to be able to attach the indicator several times with differe
FREE
AliPivot Points is a Meta Trader 5 Indicator that draws you the latest pivot points. You can choose from timeframes ranging from 1 Minute to 1 Month. Calculation methods for pivot points includes: Classic Pivot Points Camarilla Pivot Points Fibonacci Pivot Points Woodie Pivot Points You can personalize the line colors, style, and width to suit your preference. The indicator displays values on the right side of the chart. AliPivot Points values can also be utilized by developers for creating Expe
FREE
WatchList MACD
Wojciech Daniel Knoff
5 (1)
This is an alert based on a moving average convergence / divergence (MACD) and additional moving average indicator (for trend confirmation) similar to my other product  where you find detailed description of how it works. You get a colored table where colors are related to trading conditions (see below) with possibility to customize all indicator parameters, including Heikin Ashi calculations. Meaning of cell COLORS (can be redefined by user): GREEN - buy signal, PINK - sell signal, YELLOW - pay
FREE
HydraAlchemist
Haruki Teranaka
Introducing HydraAlchemist, an innovative automated trading tool. This cutting-edge Expert Advisor (EA) skillfully combines multiple technical indicators to pinpoint promising trading opportunities in financial markets. We aim to maximize profits by scrutinizing signals obtained from indicators such as MACD, stochastic, and RSI using our own logic and accurately grasping market trends and turning points. The real strength of 'HydraAlchemist' is that it is based on real trading strategies. While
FREE
Donchian Clouds
Samuel Manoel De Souza
The Indicator indicator draws 2 clouds based on Donchian Channels indicator values. The upper cloud is formed by the upper lines values and the lower cloud by the lowers lines values. The indicator allows to change the Channels parameters and the clouds colors the period of the base line and the multiplier of each Donchian Channels instance. The indicator holds 5 buffer index as follow: [0] - Outer values of the upper cloud [1]  - Inner values of the upper cloud [2]  - Base/Center line values [3
FREE
ToolBot Probabilistic Analysis
Josue De Matos Silva
4.33 (3)
ToolBot Probabilistic Analysis - FREE   An effective indicator for your negotiations The toolbot indicator brings the calculation of candles and a probabilistic analysis so that you have more security on your own. Also test our  FREE tops and bottoms indicator: :   https://www.mql5.com/pt/market/product/52385#description Also test our  FREE (RSI, ATR, ADX, OBV) indicator:   https://www.mql5.com/pt/market/product/53448#description Try our EA ToolBot for free:   https://www.mql5.com/market/p
FREE
Automatic Trendlines
Pasi Hakamaki
4.65 (51)
The indicator draws trendlines on chart. This indicator has six inputs. User can specify alternative labels for both lines. If multiple instances of the indicator are used, the labels must differ. User can set width and color of the lines and depth which specifies what significant peaks should be used. For example, Depth=10 sets trendlines using the current peaks and valleys that have at least 10 bars to the right and to the left and that have highs/lows less/greater than the peak's high/low. In
FREE
ISolz MACD
Iqrar Hussain
Ever wanted to use MACD like you see in TradingView??? Now you can use this indicator to use same MACD in your MetaTrader5 and enjoy more time in Trading.. You can change MACD settings if you want to change and it will be ready to use for you... Now you will not spend time in TradingView to use only indicator there... Open charts , load Indicator and you are ready to do analysis in MetaTrader5 and Put Trades when you feel okay with your analysis.
FREE
SDivergence
Mobin Zarekar
1 (1)
SDivergence Indicator calculates and shows regular divergences and hidden divergences for MACD and Stochastic(for now). The benefit of this indicator is multiple input variables. Using these inputs you can modify to get more adaptive RD and HD's to your strategy. Guide : 1- First put your desired oscillator (MACD or Stochastic or Both) on the chart. 2- Run SDivergence indicator and set corresponding sub-window index of previously put oscillator in SDivergence input window. -Note: the chart sub-w
FREE
Momentum Reversal
Grigorii Matsnev
4.5 (2)
Momentum Reversal is a powerful tool for detecting possible reversal points and the beginning of correction, based on the analysis of the intensity of price movements and bar formations. _________________________________ How to use the indicator signals: The indicator generates a signal after a new price bar appears. It is recommended to use the generated signal after the price breaks through the critical point in the specified direction. The indicator does not redraw its signals. _____
FREE
Multi-timeframe trend indicator based on the ADX / ADXWilder indicator with Fibonacci levels The indicator shows trend areas using ADX or ADXWilder indicator data from multiple timeframes. The impulse mode of the indicator allows you to catch the beginning of a trend, and several "Screens" with different timeframes allow you to filter out market noise. Fibonacci levels are added to the price chart, which have flexible settings. How the indicator works: if PDI is greater than NDI, then   it`
FREE
PZ The Zone MT5
PZ TRADING SLU
5 (1)
This indicator displays buy or sell signals according to Bill Williams' definition of the Trading Zone. [ Installation Guide | Update Guide | Troubleshooting | FAQ | All Products ] Easy to use and understand Avoid trading flat markets Deterministic indicator with clear rules The indicator is non-repainting It implements alerts of all kinds It has straightforward trading implications. A blue arrow is a buy signal A red arrow is a sell signal According to Bill Williams trading in the zone helps t
FREE
Cybertrade Double Bollinger Bands - MT5  The Bollinger Bands indicator shows the levels of different highs and lows that a security price has reached in a given duration and also their relative strength, where the highs are close to the upper line and the lows are close to the lower line. Our differential is to present this indicator in a double form, with the availability of its values ​​to simplify automation. It works on periods longer than the period visible on the chart. All values ​​are
FREE
Three Moving Averages
MetaQuotes Ltd.
3.37 (35)
The trade strategy is based on three moving averages. To determine the trend, it uses three exponentially smoothed moving averages: FastEMA, MediumEMA and SlowEMA. Trade signals: Buy signal: FastEMA>MediumEMA>SlowEMA (upward trend). Sell signal: FastEMA<MediumEMA<SlowEMA (downward trend). Input parameters: Inp_Signal_ThreeEMA_FastPeriod = 8; Inp_Signal_ThreeEMA_MediumPeriod = 38; Inp_Signal_ThreeEMA_SlowPeriod = 48; Inp_Signal_ThreeEMA_StopLoss = 400; Inp_Signal_ThreeEMA_TakeProfit = 900; I
FREE
Inside Bar Radar
Flavio Javier Jarabeck
4.67 (6)
The Inside Bar pattern is a very well known candlestick formation used widely by traders all over the world and in any marketplace. This approach is very simple and adds a little confirmation candle, so it adds a third past candlestick to the count to confirm the direction of the move (upward or downward). Obviously, there is no power on this candlestick formation if the trader has no context on what it is happening on the market he/she is operating, so this is not magic, this "radar" is only a
FREE
Please if possible consider the  paid version  which I will continue to develop (there will be no future updates for this free version). This Expert Advisor identifies when a divergence occurs between price and an oscillator/indicator. It identifies both regular/classical (trend reversal) and hidden (trend continuation) divergences. It has RSI, bollinger, stochastics, moving average and ADX filter options which makes it possible to filter out only the strongest setups. The default settings ar
FREE
PZ Reversal Fractals MT5
PZ TRADING SLU
4.46 (37)
This is the latest iteration of my famous indicator, Reversal Fractals, published for the first time almost a decade ago. It examines the price structure of fractals to determine possible reversal points in the market, providing timing to positional traders that already have a fundamental or technical valuation model. [ Installation Guide | Update Guide | Troubleshooting | FAQ | All Products ] Reversal fractals can start long trends The indicator is non repainting It implements alerts of all k
FREE
This Mt5 Indicator Signals when there is two opposite direction bars engulfed by current bar.  has a recent Exponential Moving Average Cross and past bar was oversold/bought Expert Advisor Available in Comments  Free Version Here : https://www.mql5.com/en/market/product/110114?source=Site&nbsp ; Full Alerts for mt5 terminal , phone , email, print to file, print to journal  Buy Signal ( blue line ) Past ema cross ( set at 30 bars back ) Past bar rsi is oversold ( level 40  ) Engulfing bar closes
FREE
Buyers of this product also purchase
Atomic Analyst MT5
Issam Kassas
4.79 (19)
First of all Its worth emphasizing here that this Trading Indicator is   Non-Repainting   , Non Redrawing and Non Lagging Indicator   Indicator, Which makes it ideal from both manual and robot trading.  User manual: settings, inputs and strategy . The Atomic Analyst  is a PA Price Action Indicator that uses Strength and Momentum of the price to find a better edge in the market. Equipped with Advanced filters which help remove noises and false signals, and Increase Trading Potential. Using Mult
Atbot
Zaha Feiz
4.96 (28)
ATbot : How It Works and How to Use It How It Works The "AtBot" indicator for the MT5 platform generates buy and sell signals using a combination of technical analysis tools. It integrates Simple Moving Average (SMA), Exponential Moving Average (EMA), and the Average True Range (ATR) index to identify trading opportunities. Additionally, it can utilize Heikin Ashi candles to enhance signal accuracy. MQL Channel    Leave a massage after purchase and receive a special bonus gift. 2 copies left for
First of all Its worth emphasizing here that this Trading System is Non-Repainting   , Non Redrawing and Non Lagging Indicator Which makes it ideal from both manual and robot trading .  Online course, manual and download presets. The Smart Trend Trading System MT5 is a comprehensive trading solution tailored for new and experienced traders . It combines over 10 premium indicators and features more than 7 robust trading strategies , making it a versatile choice for diverse market conditions . Tre
Gold Stuff mt5
Vasiliy Strukov
4.9 (185)
Gold Stuff mt5 is a trend indicator designed specifically for gold and can also be used on any financial instrument. The indicator does not redraw and does not lag. Recommended time frame H1. Contact me immediately after the purchase to get   personal bonus!  You can get a free copy of our Strong Support and Trend Scanner indicator, please pm. me! Settings  and manual   here   SETTINGS Draw Arrow - on off. drawing arrows on the chart. Alerts -   on off audible alerts. E-mail notification - on of
TPSproTREND PrO MT5
Roman Podpora
4.89 (9)
TPSpro TREND PRO  - is a trend indicator that automatically analyzes the market and provides information about the trend and each of its changes, as well as giving signals for entering trades without redrawing! The indicator uses each candle, analyzing them separately. referring to different impulses - up or down impulse. Exact entry points into transactions for currencies, crypto, metals, stocks, indices!  Version MT4               DETAILED DESCRIPTION               R ecommended to use with an
TPSpro RFI Levels MT5
Roman Podpora
4.67 (9)
Reversal First Impulse levels (RFI)      INSTRUCTIONS        RUS       -       ENG              R ecommended to use with an indicator   -   TPSpro  TREND PRO -  Version MT4                 A key element in trading is zones or levels from which decisions to buy or sell a trading instrument are made. Despite attempts by major players to conceal their presence in the market, they inevitably leave traces. Our task was to learn how to identify these traces and interpret them correctly. Main functi
Top indicator for MT5   providing accurate signals to enter a trade without repainting! It can be applied to any financial assets:   forex, cryptocurrencies, metals, stocks, indices .  Watch  the video  (6:22) with an example of processing only one signal that paid off the indicator! MT4 version is here It will provide pretty accurate trading signals and tell you when it's best to open a trade and close it. Most traders improve their trading results during the first trading week with the help of
First of all Its worth emphasizing here that this Trading Tool is Non Repainting , Non Redrawing and Non Lagging Indicator , Which makes it ideal for professional trading . Online course, user manual and demo. The Smart Price Action Concepts Indicator is a very powerful tool for both new and experienced traders . It packs more than 20 useful indicators into one , combining advanced trading ideas like Inner Circle Trader Analysis and Smart Money Concepts Trading Strategies . This indicator focus
Quantum Trend Sniper
Bogdan Ion Puscasu
4.92 (48)
Introducing   Quantum Trend Sniper Indicator , the groundbreaking MQL5 Indicator that's transforming the way you identify and trade trend reversals! Developed by a team of experienced traders with trading experience of over 13 years,   Quantum Trend Sniper Indicator   is designed to propel your trading journey to new heights with its innovative way of identifying trend reversals with extremely high accuracy. ***Buy Quantum Trend Sniper Indicator and you could get Quantum Breakout Indicator fo
Trend Screener Pro MT5
STE S.S.COMPANY
4.88 (67)
Unlock the Power of Trends Trading with the Trend Screener Indicator: Your Ultimate Trend Trading Solution powered by Fuzzy Logic and Multi-Currencies System! Elevate your trading game with the Trend Screener, the revolutionary trend indicator designed to transform your Metatrader into a powerful Trend Analyzer. This comprehensive tool leverages fuzzy logic and integrates over 13 premium features and three trading strategies, offering unmatched precision and versatility. LIMITED TIME OFFER : Sup
FX Power MT5 NG
Daniel Stein
5 (6)
Trading GOLD, and currencies, with the dog walk strategy  - super smart Trading GOLD, and currencies, with the breakout strategy  - super easy Visit our all-new   Stein Investments Welcome Page   to get the latest information, updates and trading strategies. FX Power MT5 NG  is the next generation of our long-time very popular currency strength meter, FX Power.  And what does this next-generation strength meter offer? Everything you have loved about the original FX Power  PLUS GOLD/XAU st
FX Volume MT5
Daniel Stein
4.94 (17)
Visit our all-new   Stein Investments Welcome Page   to get the latest information, updates and trading strategies. FX Volume is the FIRST and ONLY volume indicator that provides a REAL insight into the market sentiment from a broker's point of view. It provides awesome insights into how institutional market participants, like brokers, are positioned in the Forex market, much faster than COT reports. Seeing this information directly on your chart is the real game-changer and breakthrough solut
IX Power MT5
Daniel Stein
4.17 (6)
IX Power   finally brings the unbeatable precision of FX Power to all your trading symbols. It accurately determines the intensity of short, medium and long-term trends in your favourite indices, stocks, commodities, ETFs, and even cryptocurrencies. You can   analyse everything   your terminal has to offer. Try it out and experience how   your timing improves significantly   when trading. Read about our latest strategic development -  Easy scalping with IX Power Visit our all-new   Stein Inve
XQ Indicator MetaTrader 5
Marzena Maria Szmit
3.5 (2)
Step into the realm of Forex trading with confidence and precision using XQ, a cutting-edge Forex indicator designed to elevate your trading game to unprecedented heights. Whether you're a seasoned trader or just stepping into the world of currency exchange, XQ Forex Indicator empowers you with the insights and signals needed to make informed trading decisions. The signal conditions are a combination of three indicators, and XQ Forex Indicator only display  medium and long-term trends . The ind
Easy By Sell is a market indicator for opening and closing positions. It becomes easy to track market entries with alerts. It indicates trend reversal points when a price reaches extreme values ​​and the most favorable time to enter the market. it is as effective as a Fibonacci to find a level but it uses different tools such as an algorithm based on ATR indicators and Stochastic Oscillator. You can modify these two parameters as you wish to adapt the settings to the desired period. My othe
This dashboard shows the latest available   harmonic patterns   for the selected symbols, so you will save time and be more efficient /   MT4 version . Free Indicator:   Basic Harmonic Pattern Indicator columns Symbol:  the selected symbols will appear Trend:   bullish or bearish Pattern:  type of pattern (gartley, butterfly, bat, crab, shark, cypher or ABCD) Entry:  entry price SL:  stop loss price TP1:   1st take profit price TP2:  2nd take profit price TP3:  3rd take profit price Current
TrendMaestro5
Stefano Frisetti
note: this indicator is for METATRADER4, if you want the version for METATRADER5 this is the link:  https://www.mql5.com/it/market/product/108106 TRENDMAESTRO ver 2.4 TRENDMAESTRO recognizes a new TREND in the bud, he never makes mistakes. The certainty of identifying a new TREND is priceless. DESCRIPTION TRENDMAESTRO identifies a new TREND in the bud, this indicator examines the volatility, volumes and momentum to identify the moment in which there is an explosion of one or more of these data a
Golden Spikes Premium
Kwaku Bondzie Ghartey
Golden Spikes Detector Overview: The Golden Spikes Premium is a groundbreaking trading indicator meticulously crafted for the Boom and Crash indices on the Deriv market. Tailored to meet the needs of discerning traders, this powerful tool operates exclusively on the one-minute timeframe, providing timely and precise signals to maximize your trading potential. The Golden Spikes Detector stands out in its ability to deliver accurate signals, ensuring that you capitalize on market opportunities wit
Gartley Hunter Multi
Siarhei Vashchylka
5 (8)
Gartley Hunter Multi - An indicator for searching for harmonic patterns simultaneously on dozens of trading instruments and on all possible timeframes. Manual (Be sure to read before purchasing) | Version for MT4 Advantages 1. Patterns: Gartley, Butterfly, Shark, Crab. Bat, Alternate Bat, Deep Crab, Cypher 2. Simultaneous search for patterns on dozens of trading instruments and on all possible timeframes 3. Search for patterns of all possible sizes. From the smallest to the largest 4. A
PZ Support Resistance MT5
PZ TRADING SLU
4.17 (6)
Unlock key market insights with automated support and resistance lines Special Offer: Purchase now to receive free bonuses worth $89! (Read more for details) Tired of plotting support and resistance lines? This is a multi-timeframe indicator that detects and plots supports and resistance lines in the chart with the same precision as a human eye would. As price levels are tested over time and its importance increases, the lines become thicker and darker, making price leves easy to glance and ev
Matrix Arrow Indicator MT5
Juvenille Emperor Limited
5 (14)
Matrix Arrow Indicator MT5  is a unique 10 in 1 trend following   100% non-repainting  multi-timeframe indicator that can be used on all symbols/instruments:   forex,   commodities,   cryptocurrencies,   indices,   stocks .  Matrix Arrow Indicator MT5  will determine the current trend at its early stages, gathering information and data from up to 10 standard indicators, which are: Average Directional Movement Index (ADX) Commodity Channel Index (CCI) Classic Heiken Ashi candles Moving Aver
Volume by Price MT5
Brian Collard
3.6 (5)
The Volumebyprice.com Indicator for MetaTrader 5 features Volume Profile and Market Profile TPO (Time Price Opportunity). Volume and TPO histogram bar and line charts. Volume Footprint charts. TPO letter and block marker collapsed and split structure charts. Static, dynamic and flexible range segmentation and compositing methods with relative and absolute visualizations. Session hours filtering and segment concatenation with Market Watch and custom user specifications. Graphical layering, posit
ICT, SMC, SMART MONEY CONCEPTS, SMART MONEY, Smart Money Concept, Support and Resistance, Trend Analysis, Price Action, Market Structure, Order Blocks, BOS/CHoCH,   Breaker Blocks ,  Momentum Shift,   Supply&Demand Zone/Order Blocks , Strong Imbalance, HH/LL/HL/LH,    Fair Value Gap, FVG, Invert FVG, IFVG,  Premium  &   Discount   Zones, Fibonacci Retracement, OTE, Buy Side Liquidity, Sell Side Liquidity, BSL/SSL Taken, Equal Highs & Lows, MTF Dashboard, Multiple Time Frame, BigBar, HTF OB, HTF
Volatility Trend System - a trading system that gives signals for entries. The volatility system gives linear and point signals in the direction of the trend, as well as signals to exit it, without redrawing and delays. The trend indicator monitors the direction of the medium-term trend, shows the direction and its change. The signal indicator is based on changes in volatility and shows market entries. The indicator is equipped with several types of alerts. Can be applied to various trading in
Blahtech Supply Demand MT5
Blahtech Limited
4.54 (13)
Was: $299  Now: $99   Supply Demand uses previous price action to identify potential imbalances between buyers and sellers. The key is to identify the better odds zones, not just the untouched ones. Blahtech Supply Demand indicator delivers functionality previously unavailable on any trading platform. This 4-in-1 indicator not only highlights the higher probability zones using a multi-criteria strength engine, but also combines it with multi-timeframe trend analysis, previously confirmed swings
Gold TMAF MTF  - this is a best stock technical indicator. The indicator algorithm analyzes the price movement of an asset and reflects volatility and potential entry zones. The best indicator signals: For SELL = red upper boundary of TMA2 above the red upper boundary of TMA1 + red fractal indicator above + yellow SR signal arrow in the same direction. For BUY = blue lower boundary of TMA2 below the blue lower boundary of TMA1 + blue fractal indicator from below + aqua SR signal arrow in the s
Automated Trendlines MT5
Georgios Kalomoiropoulos
Trendlines  are the most essential tool of technical analysis in forex trading.  Unfortunately, most  traders don’t draw them correctly. Automated Trendlines indicator is a professional tool for serious traders that help you visualize the trending movement of the markets . AMAZING OFFER --> Activations from 5 to 20 for "MTF Supply Demand Zones" and "Automated Trendlines" There are two types of Trendlines Bullish Trendlines and Bearish Trendlines. In the uptrend, Forex trend line is drawn th
TPA True Price Action indicator reveals the true price action of the market makers through 100% non-repainting signals strictly at the close of a candle! TPA shows entries and re-entries, every time the bulls are definitely stronger than the bears and vice versa. Not to confuse with red/green candles. The shift of power gets confirmed at the earliest stage and is ONE exit strategy of several. There are available now two free parts of the TPA User Guide for our customers. The first "The Basics"
** All Symbols x All Timeframes scan just by pressing scanner button ** ***Contact me after purchase to send you instructions and add you in "123 scanner group" for sharing or seeing experiences with other users. After 17 years of experience in the markets and programming, Winner indicator is ready. I would like to share with you! Introduction The 123 Pattern Scanner indicator with a special enhanced algorithm is a very repetitive common pattern finder with a high success rate . Interestingly,
Auto Order Block with break of structure based on ICT and Smart Money Concepts (SMC) Futures Break of Structure ( BoS )             Order block ( OB )            Higher time frame Order block / Point of Interest ( POI )    shown on current chart           Fair value Gap ( FVG ) / Imbalance   -  MTF      ( Multi Time Frame )    HH/LL/HL/LH  -  MTF      ( Multi Time Frame )  Choch  MTF      ( Multi Time Frame )  Volume Imbalance     ,  MTF          vIMB Gap’s Power of 3 Equal High
Filter:
Cornelius Theo12
42
Cornelius Theo12 2024.08.21 05:37 
 

not bad, but its just like normal MACD divergence

jose3905
84
jose3905 2024.08.15 23:32 
 

Gostei do seu indicador, você poderia inserir setas para compra e venda? Isso facilita na hora de fazer os testes e otimizações... Muito obrigado.

Reply to review
Version 1.1 2024.06.12
Compilation error correction
Declaration of the variables IndicatorShortName and SetIndexLabel.
Correction of the number of parameters of the iMACD function.
Addition of trendlines on prices and MACD
Implementation of trendlines to connect the last two relevant highs/lows in prices and MACD.
Creation and management of trendlines for prices and MACD.
Correction of signaling logic
Addition of controls for trendline slope:
BUY signal when the trendline of the lows on prices is decreasing and the corresponding trendline on the MACD is increasing.
SELL signal when the trendline of the highs on prices is decreasing and the corresponding trendline on the MACD is increasing.
SELL signal when the trendline of the highs on prices is increasing and the corresponding trendline on the MACD is decreasing.
BUY signal when the trendline of the lows on prices is increasing and the corresponding trendline on the MACD is decreasing.
SELL signal when the trendline of the highs on prices is increasing and the corresponding trendline on the MACD is decreasing.
BUY signal when the trendline of the lows on prices is increasing and the corresponding trendline on the MACD is decreasing.
Addition of the OnDeinit function to remove all trendlines and comments when the indicator is removed from the chart.