• Genel bakış
  • İncelemeler (2)
  • Yorumlar (1)
  • Yenilikler

Divergence Force

4
Divergence Force Diverjans Göstergesi

Açıklama

Divergence Force, bir varlığın fiyatı ile MACD (Hareketli Ortalama Yakınsama Iraksama) arasındaki uyumsuzlukları belirlemek için tasarlanmış bir göstergedir. Bu gösterge, fiyat ve MACD'nin zirve ve dip noktalarına otomatik olarak trend çizgileri çizer ve potansiyel ticaret fırsatlarını vurgular.

Temel Özellikler

  • Otomatik Uyumsuzluk Tespiti: Gösterge, fiyat ve MACD arasındaki boğa ve ayı uyumsuzluklarını otomatik olarak tespit eder.
  • Trend Çizgisi Takibi: Fiyatın ardışık zirve ve dip noktalarına otomatik olarak trend çizgileri çizer ve trendi MACD'nin zirve ve dip noktaları ile karşılaştırır.
  • Alım ve Satım Sinyalleri: Uyumsuzluklar tespit edildiğinde grafikte açıkça alım ("Buy") ve satım ("Sell") sinyalleri gösterir. Uyumsuzluk tespit edilmediğinde "Neutral" gösterir.
  • Standart MACD Parametreleri: Hesaplama için standart MACD parametrelerini (12, 26, 9) kullanarak güvenilir ve tanınmış sonuçlar sağlar.
  • Farklı Zaman Dilimleri ile Uyumluluk: 1 saatlik zaman diliminde çalışmak üzere optimize edilmiştir, ancak kullanıcının tercihine bağlı olarak diğer zaman dilimlerinde de uygulanabilir.

Nasıl Kullanılır

  1. Kurulum: Göstergeleri MetaTrader 5 platformunuzun Indicators klasörüne ekleyin.
  2. Grafiğe Uygulama: Göstergeyi istediğiniz grafiğe yükleyin. Gösterge otomatik olarak trend çizgilerini çizmeye ve uyumsuzlukları tespit etmeye başlayacaktır.
  3. Sinyallerin Yorumu:
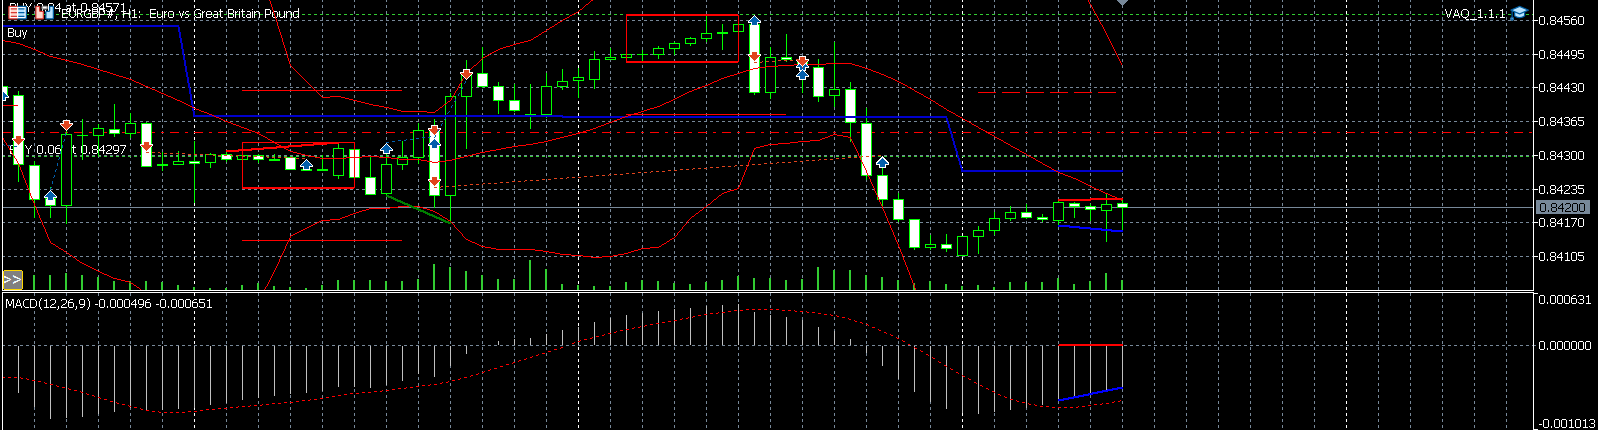
    • Buy: Boğa uyumsuzluğu tespit edildiğinde gösterge "Buy" sinyalini gösterecektir.
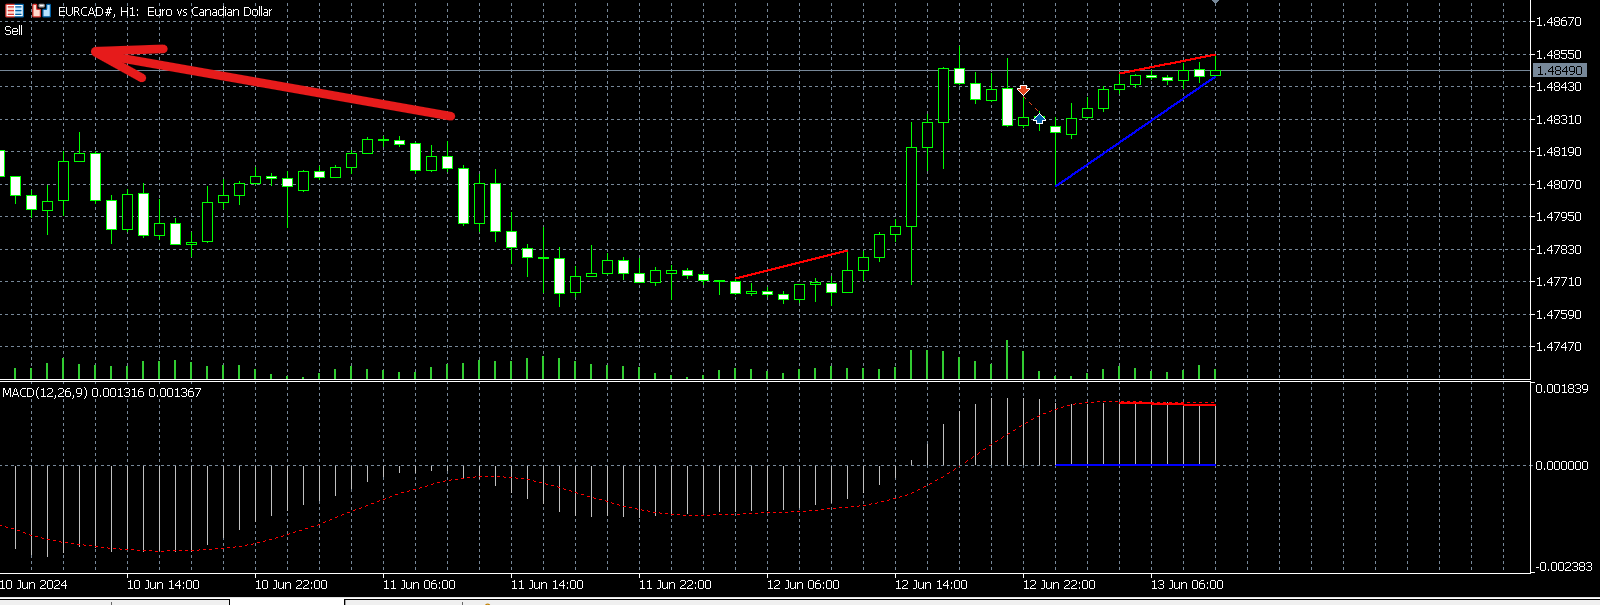
    • Sell: Ayı uyumsuzluğu tespit edildiğinde gösterge "Sell" sinyalini gösterecektir.
    • Neutral: Uyumsuzluk tespit edilmediğinde gösterge "Neutral" gösterecektir.

Görsel Örnekler

Boğa Uyumsuzluğu (Buy):

  • İki ardışık fiyat dibi artarken, ilgili MACD dipleri düşüyorsa.

Ayı Uyumsuzluğu (Sell):

  • İki ardışık fiyat zirvesi düşerken, ilgili MACD zirveleri artıyorsa.

Sonuç

Divergence Force, ticaret stratejinizde ek teyitler almak için yararlı bir göstergedir. Kullanım kolaylığı ve gelişmiş özellikleriyle bu gösterge, ticaret stratejilerinizi geliştirmenize ve operasyonel etkinliğinizi artırmanıza yardımcı olabilir.

Bugün Divergence Force indirin ve ticaretinizi bir sonraki seviyeye taşıyın!

İncelemeler 2
jose3905
84
jose3905 2024.08.15 23:32 
 

Gostei do seu indicador, você poderia inserir setas para compra e venda? Isso facilita na hora de fazer os testes e otimizações... Muito obrigado.

Eu pedi para inserir as setas pq uso uma EA Universal que consegue identificar os Buffers de compra e venda pelas setas. E isso facilita e muito pq o robô faz a compra e a venda sozinho, sem a minha interferência.

Önerilen ürünler
The indicator plots a curve of the difference between the values ​​of two trading instruments (currency pairs). The purpose of the indicator is to observe the processes of divergence and convergence of the values ​​of two trading instruments. The results obtained can be used for trading strategies of statistical arbitrage, pair trading, correlation, and others. Trading strategy The indicator is attached to the chart of any trading instrument. In the input parameters, the names of trading i
FREE
Just another   Auto Fibonacci Retracement indicator . However, this is the most   Flexible   &   Reliable   one you can find for FREE. If you use this indicator and you like it, please leave a review/comment. If you are looking for a more advanced Fibo indicator, check this Free  Trend-Based Fibo indicator . ### FEATURES ### Auto-calculate up to 7 Fibonacci levels on your customized frame. Adjust levels as your need. Use High/Low price or  Open/Close price to calculate. Freeze the levels and don
FREE
Curver Arrows
Francis Dube
3.75 (4)
This indicator is a straight port of a well known MetaTrader 4 indicator that is freely available on the Internet. It does not redraw at all. It implements a type of breakout strategy. The arrows indicate market direction. Use the indicator on M15 charts and higher. The indicator draws two bands near price action and generates signals when the price closes below the lower band and also above the upper band. The indicator uses periodic highs and lows to calculate upper and lower threshold bands.
FREE
Divergence RSI Trader is based on divergences in the chart and indicator (RSI Level 14). Divergence RSI Trader's strategy to find lows and highs on the chart and RSI indicator, analyze them and then open positions. EA was tested in the EURUSD H1 in the strategy tester and adjusted to this currency by default. EA has also been tested with other settings at GBPUSD M5 for 10 years and completed with good results. Because this is a free version, there will be no more tests and only updates. Please
FREE
Contact me for any queries or custom orders, if you want to use this in an EA. Key Features: Pattern Recognition : Identifies Fair Value Gaps (FVGs) Spots Break of Structure (BOS) points Detects Change of Character (CHoCH) patterns Versatile Application : Optimized for candlestick charts Compatible with any chart type and financial instrument Real-Time and Historical Analysis : Works seamlessly with both real-time and historical data Allows for backtesting strategies and live market analysis Vis
FREE
Original MACD
Kirill Paskhin
5 (5)
Moving Average Convergence/Divergence — схождение/расхождение скользящих средних — технический индикатор, разработанный Джеральдом Аппелем (Gerald Appel), используемый в техническом анализе для проверки силы и направления тренда, а также определения разворотных точек. Встроенный в MetaTrader 5 индикатор MACD не соответствует задумке автора (Gerald Appel): -линия MACD графически изображена в виде гистограммы, однако гистограммой отражается разница между линией MACD и сигнальной линией;  -сигнал
FREE
MACD indicators https://mql5.com This MACD indicator looks slightly different from the MACD indicator found in many other charting software. When the value of the signal line parameter is greater than the value of the MACD parameter, the indicator will give a buy prompt, and when the signal line parameter is less than the value of the MACD parameter, the indicator will give a sell prompt.
FREE
Insidious Me
Bin Jumahat Johan
4 (1)
This EA uses the RVI Crossovers. A crossover above the signal line is a bullish indicator, while a crossover below the signal line is a bearish indicator. The Relative Vigor Index (RVI) is a momentum indicator used in technical analysis. It measures the strength of a trend by comparing a security's closing price to its trading range while smoothing the results using a simple moving average (SMA). The Relative Vigor Index is considered a leading indicator, meaning it changes before the trend
FREE
Auto Fibonacci
Ali Gokay Duman
5 (2)
This indicator calculates fibonacci levels via moving averages trend and draw these lines. You can change fast and slow Moving Averages settings for customization. Inputs: Fast MA Time Period :  64 Fast MA Shift: 0 Fast MA Method: Smoothed Fast MA Apply To: Median Price Slow MA Time Period: 32 Slow MA Shift: 0 Slow MA Method: Smoothed Slow MA Apply To: Median Price ZigZag: False ZigZag Color: Red ZigZag Type: DashDot ZigZag Width: VeryThin Fibo Settings TrendFibonacci: True FiboTrendColor: Blac
FREE
This indicator is an automated version of the Fibonacci retracement (Fib) indicator. Deciding the best areas to use when drawing the fib can be tricky and this  indicator was made with that in mind. When you drop it on the chart it will automatically choose the best points to draw the fib with, but in case you aren't satisfied with those regions, you can adjust it as you wish.
FREE
[ Disclaimer ] We're letting u download it for free to support the launch of the main products & training for CyberBot Members !  Hurry up download limited quota. The cool part is u can use it on your chart without having to run it with the main product. Just a heads up, though—alerts might pop up since this product isn't linked to the main one. Plus, you can experiment with it by downloading the free trial of the following main products 8 Symbols 8 TimeFrames 8 Shadows + Pivot Support Resistan
FREE
The Moving Average Convergence Divergence (MACD) işlem stratejisi, momentum ve trend yönündeki değişiklikleri belirlemek için kullanılan popüler bir teknik analiz aracıdır. MACD, 26 periyotlu üssel hareketli ortalamanın (EMA) 12 periyotlu EMA'dan çıkarılmasıyla hesaplanır. Ardından, "sinyal çizgisi" olarak adlandırılan 9 periyotlu EMA MACD'nin üzerine çizilir ve alım satım sinyalleri için bir tetikleyici olarak görev yapar. MACD, MACD hattı sinyal çizgisinin üzerindeyken boğa bölgesinde ve altın
FREE
Renko Chart
Marcin Konieczny
3.63 (8)
This indicator allows to display Renko charts in the indicator window. Renko charts show only price movements that are bigger than the specified box size. It helps to eliminate noise and allows to focus on main trends. Time is not a factor here. Only price movements are taken into account. That's why Renko chart is not synchronized with the main chart it is attached to. Indicator works in two modes: CLOSE - only close prices are taken into account while building the chart HIGH_LOW - only high/
FREE
This indicator is designed to detect high probability reversal patterns: Double Tops/Bottoms with fake breakouts . This is the FREE version of the indicator: https://www.mql5.com/en/market/product/29957 The free version works only on EURUSD and GBPUSD! Double top and bottom patterns are chart patterns that occur when the trading instrument moves in a similar pattern to the letter "W" (double bottom) or "M" (double top). The patterns usually occur at the end of a trend and are used to signal tren
FREE
Free automatic Fibonacci is an indicator that automatically plots a Fibonacci retracement based on the number of bars you select on the BarsToScan setting in the indicator. The Fibonacci is automatically updated in real time as new highest and lowest values appears amongst the selected bars. You can select which level values to be displayed in the indicator settings. You can also select the color of the levels thus enabling the trader to be able to attach the indicator several times with differe
FREE
AliPivot Points is a Meta Trader 5 Indicator that draws you the latest pivot points. You can choose from timeframes ranging from 1 Minute to 1 Month. Calculation methods for pivot points includes: Classic Pivot Points Camarilla Pivot Points Fibonacci Pivot Points Woodie Pivot Points You can personalize the line colors, style, and width to suit your preference. The indicator displays values on the right side of the chart. AliPivot Points values can also be utilized by developers for creating Expe
FREE
This is an alert based on a moving average convergence / divergence (MACD) and additional moving average indicator (for trend confirmation) similar to my other product  where you find detailed description of how it works. You get a colored table where colors are related to trading conditions (see below) with possibility to customize all indicator parameters, including Heikin Ashi calculations. Meaning of cell COLORS (can be redefined by user): GREEN - buy signal, PINK - sell signal, YELLOW - pay
FREE
Yenilikçi bir otomatik ticaret aracı olan HydraAlchemist ile tanışın. Bu son teknoloji ürünü Uzman Danışman (EA), finansal piyasalarda gelecek vaat eden ticaret fırsatlarını belirlemek için birden fazla teknik göstergeyi ustaca birleştirir. MACD, stokastik, RSI gibi göstergelerden elde edilen sinyalleri kendi mantığımızla irdeleyerek, piyasa trendlerini ve dönüm noktalarını doğru kavrayarak karı maksimuma çıkarmayı hedefliyoruz. 'HydraAlchemist'in gerçek gücü, gerçek ticaret stratejilerine da
FREE
this little free tool allows you to set 5 vertical lines at specific time. you can use it to mark london open / asia open / comex open and so on... it draws the lines in the future space - so you wont miss an important time / candle you can select color..thickness of the lines you can select only 2 or 3 of the 5 max. lines - you dont have to use the max. 5 lines. i use it myself to never miss the best times to trade.
FREE
Donchian Clouds
Samuel Manoel De Souza
The Indicator indicator draws 2 clouds based on Donchian Channels indicator values. The upper cloud is formed by the upper lines values and the lower cloud by the lowers lines values. The indicator allows to change the Channels parameters and the clouds colors the period of the base line and the multiplier of each Donchian Channels instance. The indicator holds 5 buffer index as follow: [0] - Outer values of the upper cloud [1]  - Inner values of the upper cloud [2]  - Base/Center line values [3
FREE
ToolBot Probabilistic Analysis - FREE   An effective indicator for your negotiations The toolbot indicator brings the calculation of candles and a probabilistic analysis so that you have more security on your own. Also test our  FREE tops and bottoms indicator: :   https://www.mql5.com/pt/market/product/52385#description Also test our  FREE (RSI, ATR, ADX, OBV) indicator:   https://www.mql5.com/pt/market/product/53448#description Try our EA ToolBot for free:   https://www.mql5.com/market/p
FREE
Automatic Trendlines
Pasi Hakamaki
4.63 (40)
The indicator draws trendlines on chart. This indicator has six inputs. User can specify alternative labels for both lines. If multiple instances of the indicator are used, the labels must differ. User can set width and color of the lines and depth which specifies what significant peaks should be used. For example, Depth=10 sets trendlines using the current peaks and valleys that have at least 10 bars to the right and to the left and that have highs/lows less/greater than the peak's high/low. In
FREE
Ever wanted to use MACD like you see in TradingView??? Now you can use this indicator to use same MACD in your MetaTrader5 and enjoy more time in Trading.. You can change MACD settings if you want to change and it will be ready to use for you... Now you will not spend time in TradingView to use only indicator there... Open charts , load Indicator and you are ready to do analysis in MetaTrader5 and Put Trades when you feel okay with your analysis.
FREE
SDivergence
Mobin Zarekar
1 (1)
SDivergence Göstergesi, MACD ve Stokastik (şimdilik) için düzenli sapmaları ve gizli sapmaları hesaplar ve gösterir. Bu göstergenin yararı, çoklu giriş değişkenleridir. Bu girişleri kullanarak, stratejinize daha uyarlanabilir RD ve HD'ler elde etmek için değişiklik yapabilirsiniz. Rehber : 1- Önce istediğiniz osilatörü (MACD veya Stokastik veya Her İkisi) grafiğe koyun. 2- SDivergence göstergesini çalıştırın ve SDivergence giriş penceresine daha önce koyduğunuz osilatörün karşılık gelen a
FREE
Momentum Reversal
Grigorii Matsnev
4.5 (2)
Momentum Reversal, fiyat hareketlerinin yoğunluğunun ve çubuk oluşumlarının analizine dayanan olası ters noktaları tespit etmek ve düzeltmeye başlamak için güçlü bir araçtır. _________________________________ Gösterge sinyalleri nasıl kullanılır: Gösterge, yeni bir fiyat çubuğunun ortaya çıkmasından sonra bir sinyal oluşturur. Oluşturulan sinyalin, belirtilen yönde kritik bir noktaya çarptıktan sonra kullanılması önerilir. Gösterge sinyallerini yeniden çizmiyor. ________________________
FREE
Multi-timeframe trend indicator based on the ADX / ADXWilder indicator with Fibonacci levels The indicator shows trend areas using ADX or ADXWilder indicator data from multiple timeframes. The impulse mode of the indicator allows you to catch the beginning of a trend, and several "Screens" with different timeframes allow you to filter out market noise. Fibonacci levels are added to the price chart, which have flexible settings. How the indicator works: if PDI is greater than NDI, then   it`
FREE
Cybertrade Double Bollinger Bands - MT5  The Bollinger Bands indicator shows the levels of different highs and lows that a security price has reached in a given duration and also their relative strength, where the highs are close to the upper line and the lows are close to the lower line. Our differential is to present this indicator in a double form, with the availability of its values ​​to simplify automation. It works on periods longer than the period visible on the chart. All values ​​are
FREE
The trade strategy is based on three moving averages. To determine the trend, it uses three exponentially smoothed moving averages: FastEMA, MediumEMA and SlowEMA. Trade signals: Buy signal: FastEMA>MediumEMA>SlowEMA (upward trend). Sell signal: FastEMA<MediumEMA<SlowEMA (downward trend). Input parameters: Inp_Signal_ThreeEMA_FastPeriod = 8; Inp_Signal_ThreeEMA_MediumPeriod = 38; Inp_Signal_ThreeEMA_SlowPeriod = 48; Inp_Signal_ThreeEMA_StopLoss = 400; Inp_Signal_ThreeEMA_TakeProfit = 900; I
FREE
Inside Bar Radar
Flavio Javier Jarabeck
4.6 (5)
The Inside Bar pattern is a very well known candlestick formation used widely by traders all over the world and in any marketplace. This approach is very simple and adds a little confirmation candle, so it adds a third past candlestick to the count to confirm the direction of the move (upward or downward). Obviously, there is no power on this candlestick formation if the trader has no context on what it is happening on the market he/she is operating, so this is not magic, this "radar" is only a
FREE
Please if possible consider the  paid version  which I will continue to develop (there will be no future updates for this free version). This Expert Advisor identifies when a divergence occurs between price and an oscillator/indicator. It identifies both regular/classical (trend reversal) and hidden (trend continuation) divergences. It has RSI, bollinger, stochastics, moving average and ADX filter options which makes it possible to filter out only the strongest setups. The default settings ar
FREE
Bu ürünün alıcıları ayrıca şunları da satın alıyor
TPSpro RFI Levels MT5
Roman Podpora
4.73 (11)
TALİMATLAR         RUS   -        ENG       Bir gösterge ile kullanılması   önerilir       -       TPSpro   TREND PRO -   Sürüm MT4         Ticarette önemli bir unsur, bir ticaret aracını satın alma veya satma kararlarının alındığı bölgeler veya seviyelerdir. Büyük oyuncuların piyasadaki varlıklarını gizleme girişimlerine rağmen, kaçınılmaz olarak izler bırakırlar. Bizim görevimiz bu izleri nasıl tanımlayacağımızı ve doğru şekilde nasıl yorumlayacağımızı öğrenmekti. Ana işlevler:: Satıcılar ve
TPSproTREND PrO MT5
Roman Podpora
4.89 (9)
TPSpro TREND PRO  - is a trend indicator that automatically analyzes the market and provides information about the trend and each of its changes, as well as giving signals for entering trades without redrawing! The indicator uses each candle, analyzing them separately. referring to different impulses - up or down impulse. Exact entry points into transactions for currencies, crypto, metals, stocks, indices!  Version MT4               DETAILED DESCRIPTION               R ecommended to use with an
Atomic Analyst MT5
Issam Kassas
4.42 (19)
Öncelikle belirtmek gerekir ki bu Ticaret Göstergesi Yeniden Çizim Yapmaz, Gecikmez ve Gecikme Göstermez, bu da hem manuel hem de robot ticareti için ideal hale getirir. Kullanıcı kılavuzu: ayarlar, girişler ve strateji. Atom Analisti, Piyasada Daha İyi Bir Avantaj Bulmak İçin Fiyatın Gücünü ve Momentumunu Kullanan PA Fiyat Hareketi Göstergesidir. Gürültüleri ve Yanlış Sinyalleri Kaldırmaya ve Ticaret Potansiyelini Artırmaya Yardımcı Olan Gelişmiş Filtrelerle Donatılmıştır. Birden fazla katmanl
Atbot
Zaha Feiz
4.91 (34)
AtBot: Come funziona e come usarlo ### Come funziona L'indicatore "AtBot" per la piattaforma MT5 genera segnali di acquisto e vendita utilizzando una combinazione di strumenti di analisi tecnica. Integra la Media Mobile Semplice (SMA), la Media Mobile Esponenziale (EMA) e l'indice di Gamma Vero Medio (ATR) per identificare opportunità di trading. Inoltre, può utilizzare le candele Heikin Ashi per migliorare la precisione dei segnali. Lascia una recensione dopo l'acquisto e ricevi un regalo bonu
Gold Stuff mt5
Vasiliy Strukov
4.92 (165)
Gold Stuff mt5, özellikle altın için tasarlanmış bir trend göstergesidir ve herhangi bir finansal enstrümanda da kullanılabilir. Gösterge yeniden çizilmez ve gecikmez. Önerilen zaman dilimi H1. Ayarları ve kişisel bir bonusu almak için satın alma işleminden hemen sonra benimle iletişime geçin!  Güçlü Destek ve Trend Tarayıcı göstergemizin ücretsiz bir kopyasını pm'den alabilirsiniz. Ben!   AYARLAR Ok Çiz - açık kapalı. grafik üzerinde oklar çizmek. Uyarılar - sesli uyarılar kapalı. E-post
Öncelikle, bu Ticaret Sistemi'nin Non-Repainting, Non-Redrawing ve Non-Lagging Göstergesi olduğunu vurgulamak önemlidir, bu da hem manuel hem de robot ticareti için ideal hale getirir. Online kurs, kılavuz ve ön ayarları indir. "Smart Trend Trading System MT5", yeni ve deneyimli tüccarlar için özelleştirilmiş kapsamlı bir ticaret çözümüdür. 10'dan fazla premium göstergeyi birleştiriyor ve 7'den fazla sağlam ticaret stratejisi sunuyor, bu da çeşitli piyasa koşulları için esnek bir seçim yapar. Tr
Quantum Trend Sniper
Bogdan Ion Puscasu
4.8 (49)
Tanıtım       Kuantum Trend Keskin Nişancı Göstergesi   , trend tersine dönmeleri belirleme ve ticaret yapma şeklinizi değiştiren çığır açan MQL5 Göstergesi! 13 yılı aşkın ticaret tecrübesine sahip deneyimli tüccarlardan oluşan bir ekip tarafından geliştirilmiştir.       Kuantum Trend Keskin Nişancı Göstergesi       trend dönüşlerini son derece yüksek doğrulukla belirlemenin yenilikçi yolu ile ticaret yolculuğunuzu yeni zirvelere taşımak için tasarlanmıştır. ***Kuantum Trend Keskin Nişancı Gö
Bu gösterge paneli, seçilen semboller için mevcut en son   harmonik kalıpları   gösterir, böylece zamandan tasarruf edersiniz ve daha verimli olursunuz /   MT4 sürümü . Ücretsiz Gösterge:   Basic Harmonic Pattern Gösterge sütunları Symbol :   seçilen semboller görünecektir Trend:   yükseliş veya düşüş Pattern :   desen türü (gartley, kelebek, yarasa, yengeç, köpekbalığı, cypher veya ABCD) Entry :   giriş fiyatı SL:   zararı durdur fiyatı TP1:   1. kar alma fiyatı TP2:   2. kar alma fiyatı
FX Power MT5 NG
Daniel Stein
5 (5)
Sabah Brifingimiz burada mql5 ve on Telegram! FX Power MT5 NG , uzun zamandır çok popüler olan döviz gücü ölçerimiz FX Power'ın yeni neslidir. Peki bu yeni nesil güç ölçer ne sunuyor? Orijinal FX Power hakkında sevdiğiniz her şey PLUS GOLD/XAU güç analizi Daha da hassas hesaplama sonuçları Ayrı ayrı yapılandırılabilir analiz dönemleri Daha da iyi performans için özelleştirilebilir hesaplama limiti Özel çokluDaha fazlasını görmek isteyenler için örnek ayarlar Her grafikte en sevdiğiniz renkler i
Trend Screener Pro MT5
STE S.S.COMPANY
4.87 (63)
Trend Göstergesi, Trend Alım Satım ve Filtreleme için Çığır Açan Benzersiz Çözüm, Tüm Önemli Trend Özellikleriyle Tek Bir Araç İçinde Yerleştirildi! Forex, emtialar, kripto para birimleri, endeksler ve hisse senetleri gibi tüm sembollerde/araçlarda kullanılabilen %100 yeniden boyamayan çoklu zaman çerçevesi ve Çoklu para birimi göstergesidir. Trend Screener, grafikte noktalarla ok trend sinyalleri sağlayan etkili bir trend trend göstergesidir. Trend analizörü göstergesinde bulunan özellikler: 1.
Öncelikle, bu Ticaret Aracının Non-Repainting, Non-Redrawing ve Non-Lagging Gösterge olduğunu vurgulamakta fayda var, bu da onu profesyonel ticaret için ideal hale getiriyor. Çevrimiçi kurs, kullanıcı kılavuzu ve demo. Akıllı Fiyat Hareketi Kavramları Göstergesi, hem yeni hem de deneyimli tüccarlar için çok güçlü bir araçtır. İleri ticaret fikirlerini, Inner Circle Trader Analizi ve Smart Money Concepts Ticaret Stratejileri gibi 20'den fazla kullanışlı göstergeyi bir araya getirerek bir aray
AT Forex Indicator MT5
Marzena Maria Szmit
5 (4)
The AT Forex Indicator MT5 is a sophisticated trading tool designed to provide traders with a comprehensive analysis of multiple currency pairs. This powerful indicator simplifies the complex nature of the forex market, making it accessible for both novice and experienced traders. AT Forex Indicator uses advanced algorithms to detect trends, patterns and is an essential tool for traders aiming to enhance their forex trading performance. With its robust features, ease of use, and reliable signal
TrendMaestro5
Stefano Frisetti
note: this indicator is for METATRADER4, if you want the version for METATRADER5 this is the link:  https://www.mql5.com/it/market/product/108106 TRENDMAESTRO ver 2.4 TRENDMAESTRO recognizes a new TREND in the bud, he never makes mistakes. The certainty of identifying a new TREND is priceless. DESCRIPTION TRENDMAESTRO identifies a new TREND in the bud, this indicator examines the volatility, volumes and momentum to identify the moment in which there is an explosion of one or more of these data a
ATrend
Zaha Feiz
4.8 (5)
ATREND: Nasıl Çalışır ve Nasıl Kullanılır ### Nasıl Çalışır "**ATREND**" göstergesi, MT5 platformu için tasarlanmış olup, traderlara sağlam alım ve satım sinyalleri sağlamak amacıyla teknik analiz metodolojilerinin bir kombinasyonunu kullanır. Bu gösterge, öncelikle volatilite ölçümü için Ortalama Gerçek Aralık (ATR) kullanır ve potansiyel piyasa hareketlerini belirlemek için trend tespit algoritmalarıyla birleştirir. Satın aldıktan sonra bir mesaj bırakın ve özel bir bonus hediyesi kazanın. 30
TPA True Price Action indicator reveals the true price action of the market makers through 100% non-repainting signals strictly at the close of a candle! TPA shows entries and re-entries, every time the bulls are definitely stronger than the bears and vice versa. Not to confuse with red/green candles. The shift of power gets confirmed at the earliest stage and is ONE exit strategy of several. There are available now two free parts of the TPA User Guide for our customers. The first "The Basics"
FxaccurateLS
Shiv Raj Kumawat
WHY IS OUR FXACCCURATE LS MT5 THE PROFITABLE ? PROTECT YOUR CAPITAL WITH RISK MANAGEMENT Gives entry, stop and target levels from time to time. It finds Trading opportunities by analyzing what the price is doing during established trends. POWERFUL INDICATOR FOR A RELIABLE STRATEGIES We have made these indicators with a lot of years of hard work. It is made at a very advanced level. Established trends provide dozens of trading opportunities, but most trend indicators completely ignore them!
Auto Order Block with break of structure based on ICT and Smart Money Concepts (SMC) Futures Break of Structure ( BoS )             Order block ( OB )            Higher time frame Order block / Point of Interest ( POI )    shown on current chart           Fair value Gap ( FVG ) / Imbalance   -  MTF      ( Multi Time Frame )    HH/LL/HL/LH  -  MTF      ( Multi Time Frame )  Choch  MTF      ( Multi Time Frame )  Volume Imbalance     ,  MTF          vIMB Gap’s Power of 3 Equal High
Advanced Supply Demand MT5
Bernhard Schweigert
4.5 (14)
Herhangi bir Acemi veya Uzman Tüccar için En İyi Çözüm! Bu gösterge benzersiz, yüksek kaliteli ve uygun fiyatlı bir ticaret aracıdır çünkü bir dizi tescilli özelliği ve yeni bir formülü bir araya getirdik. Bu güncelleme ile çift zaman dilimi dilimlerini gösterebileceksiniz. Yalnızca daha yüksek bir TF gösteremeyeceksiniz, aynı zamanda TF grafiğini ve ARTIK daha yüksek TF'yi de gösterebileceksiniz: YUVARLAK BÖLGELERİ GÖSTERMEK. Tüm Arz Talebi tüccarları buna bayılacak. :) Önemli Bilgiler Açıkland
ICT, SMC, SMART MONEY CONCEPTS, SMART MONEY, Smart Money Concept, Support and Resistance, Trend Analysis, Price Action, Market Structure, Order Blocks, BOS/CHoCH,   Breaker Blocks ,  Momentum Shift,   Supply&Demand Zone/Order Blocks , Strong Imbalance,   HH/LL/HL/LH,    Fair Value Gap, FVG,  Premium  &   Discount   Zones, Fibonacci Retracement, OTE, Buy Side Liquidity, Sell Side Liquidity, BSL/SSL Taken, Equal Highs & Lows, MTF Dashboard, Multiple Time Frame, BigBar, HTF OB, HTF Market Structure
ICT, SMC, Akıllı Para Kavramı, Destek ve Direnç, Trend Analizi, Fiyat Hareketi, Piyasa Yapısı, Emir Blokları, Kırıcı Bloklar, Momentum Değişimi, Güçlü Dengesizlik, HH/LL/HL/LH, Adil Değer Boşluğu, FVG, Prim ve İndirim Bölgeleri, Fibonacci Retracement, OTE, Alış Tarafı Likidite, Satış Tarafı Likidite, Likidite Boşlukları, Piyasa Oturumları, NDOG, NWOG, Gümüş Mermi, ict şablonu Finansal piyasada doğru piyasa analizi yatırımcılar için çok önemlidir. Yatırımcıların piyasa trendlerini ve likiditey
Black Dragon indicator mt5
Ramil Minniakhmetov
4.81 (53)
Trend algılama göstergesi, herhangi bir stratejiyi tamamlayacak ve bağımsız bir araç olarak da kullanılabilir. ÖNEMLİ! Talimatlar ve bonus almak için satın alma işleminden hemen sonra benimle iletişime geçin!   Faydalar Kullanımı kolay; grafiği gereksiz bilgilerle aşırı yüklemez. Herhangi bir strateji için filtre olarak kullanma yeteneği. Hem kar elde etmek hem de zararı durdurmayı ayarlamak için kullanılabilen, yerleşik dinamik cupport ve direnç seviyeleri içerir. Mum kapandıktan sonra g
Top indicator for MT5   providing accurate signals to enter a trade without repainting! It can be applied to any financial assets:   forex, cryptocurrencies, metals, stocks, indices .  Watch  the video  (6:22) with an example of processing only one signal that paid off the indicator! MT4 version is here It will provide pretty accurate trading signals and tell you when it's best to open a trade and close it. Most traders improve their trading results during the first trading week with the help of
Matrix Arrow Indicator MT5
Juvenille Emperor Limited
5 (12)
Matrix Arrow Indicator MT5 ,   forex ,   emtialar ,   kripto   para birimleri ,   endeksler ,   hisse senetleri   gibi tüm sembollerde/araçlarda kullanılabilen   %100 yeniden boyamayan   çoklu zaman çerçevesi göstergesini izleyen benzersiz bir 10'u 1 arada trenddir.  Matrix Arrow Indicator MT5 , mevcut eğilimi erken aşamalarında belirleyecek ve aşağıdakiler gibi 10'a kadar standart göstergeden bilgi ve veri toplayacaktır: Ortalama Yönlü Hareket Endeksi (ADX) Emtia Kanal Endeksi (CCI) Klasik Hei
IX Power MT5
Daniel Stein
4.17 (6)
IX Power   nihayet FX Power'ın rakipsiz hassasiyetini Forex dışı sembollere getiriyor. En sevdiğiniz endeksler, hisse senetleri, emtialar, ETF'ler ve hatta kripto para birimlerindeki kısa, orta ve uzun vadeli eğilimlerin yoğunluğunu doğru bir şekilde belirler. Terminalinizin sunduğu   her şeyi analiz   edebilirsiniz. Deneyin ve işlem yaparken   zamanlamanızın   nasıl   önemli ölçüde iyileştiğini   deneyimleyin. IX Power Temel Özellikler 100 hassas, yeniden boyanmayan hesaplama sonuçları -
Blahtech Supply Demand MT5
Blahtech Limited
4.54 (13)
Was: $299  Now: $99   Supply Demand uses previous price action to identify potential imbalances between buyers and sellers. The key is to identify the better odds zones, not just the untouched ones. Blahtech Supply Demand indicator delivers functionality previously unavailable on any trading platform. This 4-in-1 indicator not only highlights the higher probability zones using a multi-criteria strength engine, but also combines it with multi-timeframe trend analysis, previously confirmed swings
** All Symbols x All Timeframes scan just by pressing scanner button ** *** Contact me  to send you instruction and add you in "123 scanner group" for sharing or seeing experiences with other users. After 17 years of experience in the markets and programming, Winner indicator is ready. I would like to share with you! Introduction The 123 Pattern Scanner indicator with a special enhanced algorithm is a very repetitive common pattern finder with a high success rate . Interestingly, this Winner in
Stratos Pali mt5
Michela Russo
5 (1)
Stratos Pali Indicator is a revolutionary tool designed to enhance your trading strategy by accurately identifying market trends. This sophisticated indicator uses a unique algorithm to generate a complete histogram, which records when the trend is Long or Short. When a trend reversal occurs, an arrow appears, indicating the new direction of the trend. Important Information Revealed Leave a review and contact me via mql5 message to receive My Top 5 set files for Stratos Pali at no cost ! Do
Was: $249  Now: $99   Market Profile defines a number of day types that can help the trader to determine market behaviour. A key feature is the Value Area, representing the range of price action where 70% of trading took place. Understanding the Value Area can give traders valuable insight into market direction and establish the higher odds trade. It is an excellent addition to any system you may be using. Inspired by Jim Dalton’s book “Mind Over Markets”, this indicator is designed to suit the
Protect against whipsaws: revolutionize your swing trading approach Special Offer: Purchase now to receive free bonuses worth $135! (Read more for details) Swing Trading is the first indicator designed to detect swings in the direction of the trend and possible reversal swings. It uses the baseline swing trading approach, widely described in trading literature. The indicator studies several price and time vectors to track the aggregate trend direction and detects situations in which the market i
FX Volume MT5
Daniel Stein
4.93 (14)
Sabah Brifingimiz aracılığıyla ayrıntılar ve ekran görüntüleri ile günlük piyasa güncellemenizi alın burada mql5 ve on Telegram ! FX Volume, bir brokerin bakış açısından piyasa duyarlılığı hakkında GERÇEK bir fikir veren İLK ve TEK hacim göstergesidir. COT raporlarından çok daha hızlı bir şekilde, brokerlar gibi kurumsal piyasa katılımcılarının Forex piyasasında nasıl konumlandıklarına dair harika bilgiler sağlar. Bu bilgileri doğrudan grafiğinizde görmek, ticaretiniz için gerçek oyun değiştir
Filtrele:
Cornelius Theo12
42
Cornelius Theo12 2024.08.21 05:37 
 

Kullanıcı incelemeye herhangi bir yorum bırakmadı

jose3905
84
jose3905 2024.08.15 23:32 
 

Gostei do seu indicador, você poderia inserir setas para compra e venda? Isso facilita na hora de fazer os testes e otimizações... Muito obrigado.

Eu pedi para inserir as setas pq uso uma EA Universal que consegue identificar os Buffers de compra e venda pelas setas. E isso facilita e muito pq o robô faz a compra e a venda sozinho, sem a minha interferência.

Alessandro Riggi
1197
Geliştiriciden yanıt Alessandro Riggi 2024.08.23 12:58
O indicador mostra quando comprar/vender através de uma escrita no canto superior esquerdo. Aparece "buy", "sell" ou "neutral". Você tinha notado?
İncelemeye yanıt
Sürüm 1.1 2024.06.12
Derleme hatası düzeltmesi
IndicatorShortName ve SetIndexLabel değişkenlerinin bildirimi.
iMACD işlevinin parametre sayısının düzeltilmesi.
Fiyatlar ve MACD üzerinde trend çizgilerinin eklenmesi
Fiyatlar ve MACD'deki son iki ilgili zirveyi/dibi bağlamak için trend çizgilerinin uygulanması.
Fiyatlar ve MACD için trend çizgilerinin oluşturulması ve yönetimi.
Sinyal mantığının düzeltilmesi
Trend çizgilerinin eğimi için kontrollerin eklenmesi:
Fiyatlardaki diplerin trend çizgisi azalıyorsa ve MACD'deki ilgili trend çizgisi artıyorsa AL sinyali.
Fiyatlardaki zirvelerin trend çizgisi azalıyorsa ve MACD'deki ilgili trend çizgisi artıyorsa SAT sinyali.
Fiyatlardaki zirvelerin trend çizgisi artıyorsa ve MACD'deki ilgili trend çizgisi azalıyorsa SAT sinyali.
Fiyatlardaki diplerin trend çizgisi artıyorsa ve MACD'deki ilgili trend çizgisi azalıyorsa AL sinyali.
Fiyatlardaki zirvelerin trend çizgisi artıyorsa ve MACD'deki ilgili trend çizgisi azalıyorsa SAT sinyali.
Fiyatlardaki diplerin trend çizgisi artıyorsa ve MACD'deki ilgili trend çizgisi azalıyorsa AL sinyali.
Göstergesi grafiklerden kaldırıldığında tüm trend çizgilerini ve yorumları kaldırmak için OnDeinit işlevinin eklenmesi.