• Overview
  • Reviews (14)
  • Comments (8)

MACD Classic Smoothed

4.92

Classic MACD

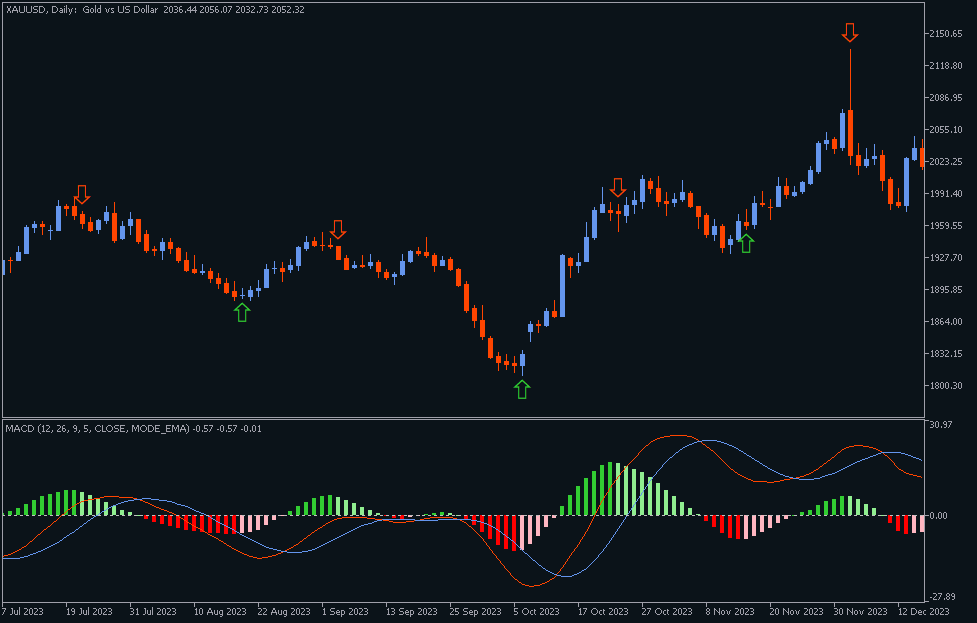
  • It has MACD line, Signal line, and Histogram.
  • The Histogram has 4 colors, showing its movement direction as simple as possible.
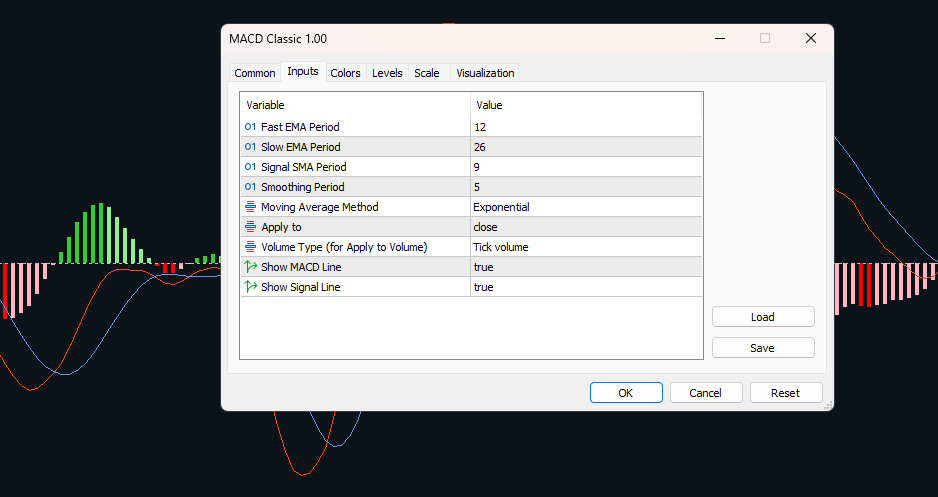
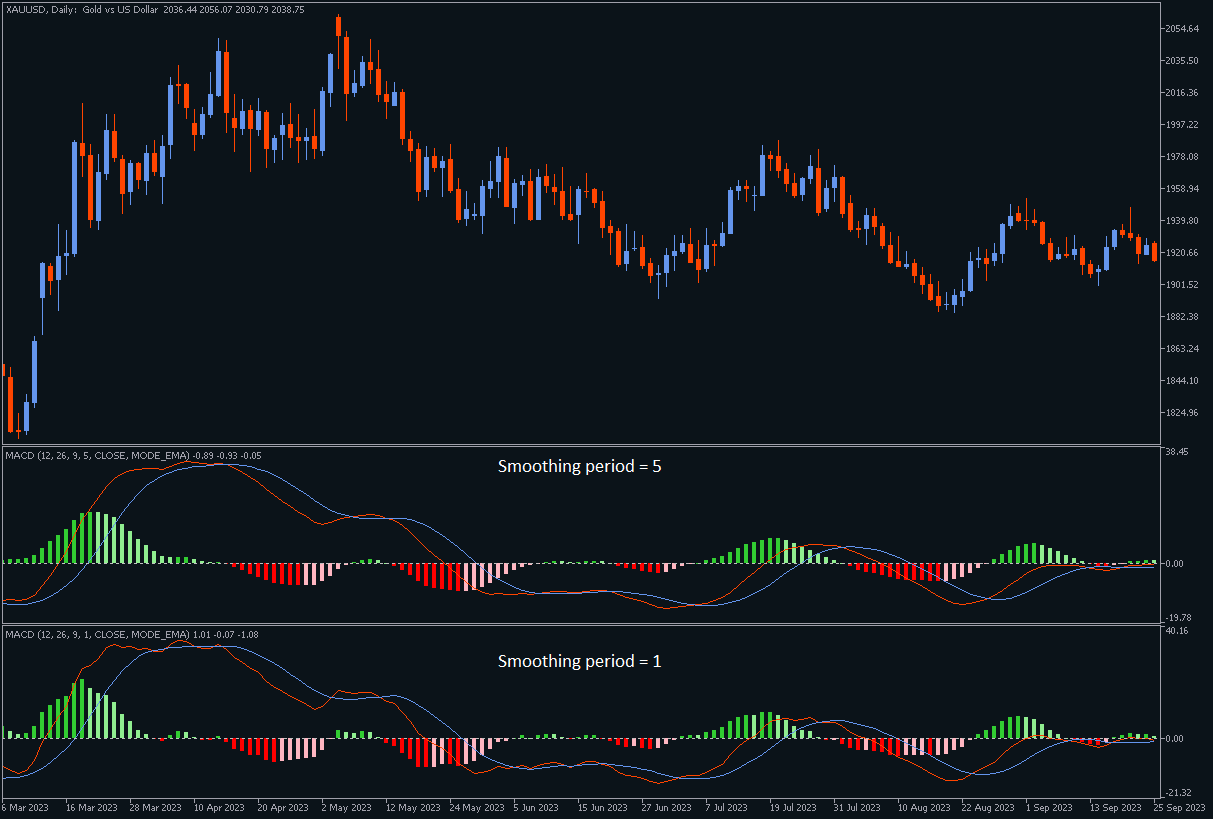
  • The smoothing factor in the input helps to eliminate noisy signals.
  • Besides different price types (hlc, hlcc, ohlc, ...), there is an option to use volume data as the source for MACD calculations (which is better to be used by real volume not unreliable tick volume).
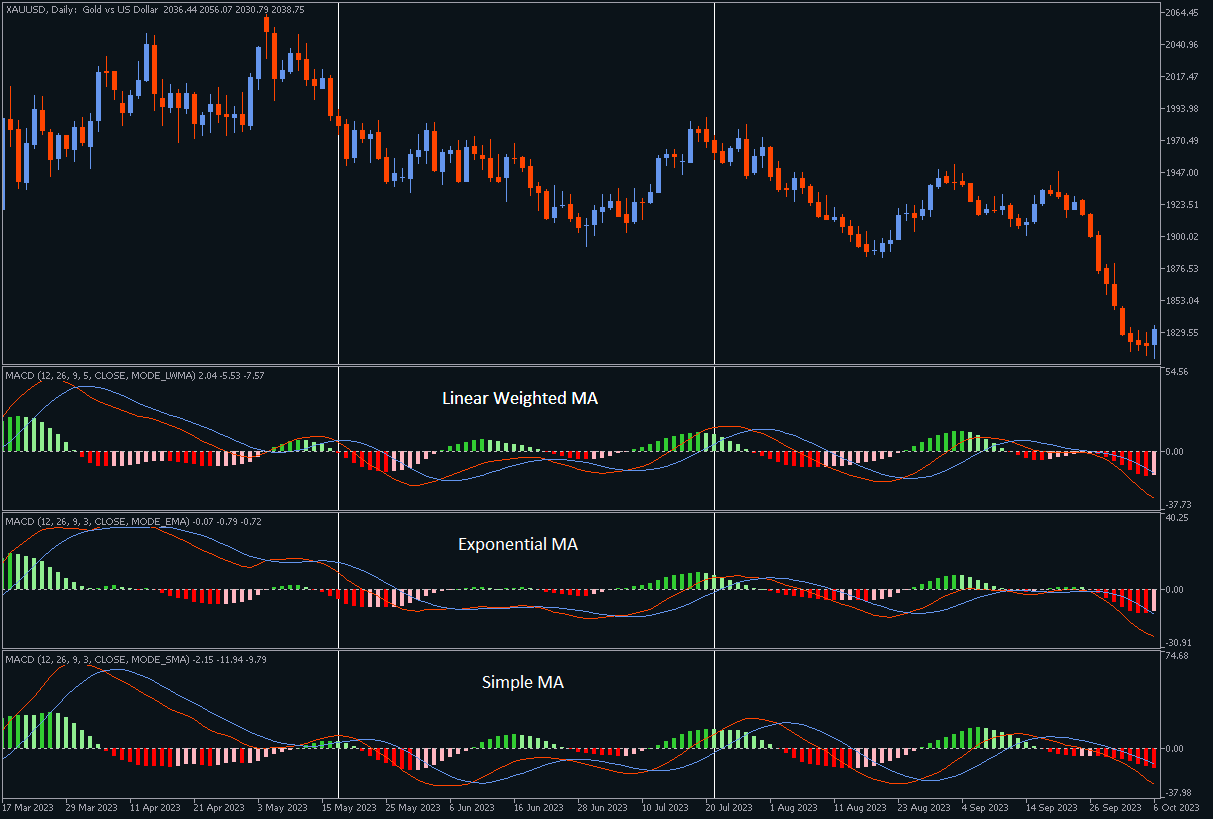
  • While the original MACD indicator uses Exponential Moving Average, this indicator provides the flexibility to choose from various moving average methods, including SMA, SMMA, and LWMA.
  • There are two true/false options to show/hide MACD & Signal lines.

I believe this covers all functionalities available with the MACD indicator without additional customization. Enjoy your trading experience, and feel free to share your comments and reviews to make me happy.

Reviews 14
xz00
14
xz00 2025.04.06 03:11 
 

指标非常不错,可靠性高。N:=3;DIFF:=EMA(CLOSE,12)-EMA(CLOSE,26);DEA:=EMA(DIFF,9);MACD:=2*(DIFF-DEA);KX:=BARSSINCE(CLOSE);HHN:=CONST(HHV(DIFF,KX));HLN:=CONST(LLV(DEA,KX));RC1:=CONST((HHN+HLN)/2);SS:=((HHN-HLN)/200);MACD底部:=(-100*SS+RC1)+-(-100*SS+RC1),COLOR669999;MACD顶部:=(100*SS+RC1)+-(-100*SS+RC1),COLORFF0033;MACD中轴:=0+-(-100*SS+RC1);DIFF修正:=DIFF+-(-100*SS+RC1),COLOR008080;DEA修正:=DEA+-(-100*SS+RC1),COLOR00FF00;MACD修正1:=2*(DIFF修正-DEA修正)+MACD中轴,COLOR0000BB,NODRAW;MACD修正2:= EMA(MACD修正1,3);MACD超跌:=CONST(LLV(MACD修正1,KX));MACD超跌线:=IF(MACD超跌< MACD底部,MACD超跌,MACD底部);顶部:=MACD顶部+-MACD超跌线;天际:=顶部*0.809;中轴:=MACD中轴+-MACD超跌线;海面:=顶部*0.191;底部:=MACD底部; DIF55:=(EMA(CLOSE,55)-EMA(CLOSE,119))*0.55;DEA55:=(EMA(DIF55,41));DRAWBAND(DEA55,RGB(0,255,0),DIF55,RGB(255,0,255));DIF60:=EMA(CLOSE,12/2)-EMA(CLOSE,26/2);DEA60:=EMA(DIF60,9/2);DRAWBAND(DEA60,RGB(0,255,255),DIF60,RGB(255,255,0));AA:=REF(DIF60,N)=HHV(DIF60,2*N+1);BB:= (AA,N+1);CC:=FILTER(BB,N) AND DIF60=HHV(DIF60,N+1);A11:=BARSLAST(REF(CC,1));顶背离:=REF(CLOSE,A11+1)< CLOSE AND REF(DIF60,A11+1)>DIF60 AND CC;MACD多头:DIFF修正+-MACD超跌线,COLOR339999;空头:DEA修正+-MACD超跌线,COLOR00FF00;量能柱:2*(MACD多头-空头)+中轴,COLOR0000BB,NODRAW;超前DEA:=(EMA(MACD多头,7)); 超前MACD:=2*(MACD多头-超前DEA)+中轴;微_信:DRAWNULL,COLOR00FF00;FSC2012782002:DRAWNULL,COLORRED;MACD多空趋势:DRAWBAND(MACD多头,RGB(204,51,51),空头,RGB(0,130,244));MACD多头重画:DRAWBAND(MACD多头,RGB(153,153,51),MACD多头,RGB(153,153,51));MACD空头重画:DRAWBAND(空头,RGB(0,224,224),空头,RGB(0,224,224));MACD红柱1:STICKLINE(量能柱>=中轴,量能柱,中轴,1.5,0),COLOR2E0022{COLOR000077};MACD红柱2:STICKLINE(量能柱>=中轴,量能柱,中轴,1.1,0),COLOR372635{COLOR809A3C}{COLOR000088};MACD红柱3:STICKLINE(量能柱>=中轴,量能柱,中轴,0.6,0),COLORFF00FF{COLOR000099};MACD红柱4:STICKLINE(量能柱>=中轴,量能柱,中轴,0.15,0),COLORFF00FF{COLOR0000AA};MACD紫柱1:STICKLINE(量能柱<=中轴,量能柱,中轴,1.5,0),COLOR2E0022{COLOR808040}{COLORAA6633};MACD紫柱2:STICKLINE(量能柱<=中轴,量能柱,中轴,1.1,0),COLOR372635{COLOR809A3C}{COLORBB7744};MACD紫柱3:STICKLINE(量能柱<=中轴,量能柱,中轴,0.6,0),COLORGREEN{COLORCC8855};MACD紫柱4:STICKLINE(量能柱<=中轴,量能柱,中轴,0.15,0),COLORGREEN{COLORDD9966};上面这代码是通达信三合一MACD代码。希望博主将其转化为mt5指标格式

Wilna Barnard
1075
Wilna Barnard 2024.12.17 20:42 
 

Very nice work. Well done

alancads
15
alancads 2024.11.16 15:30 
 

Hello man, it's the best MACD indicator I've ever used on MT5, thanks for your work in codifying it for the advancement of the community.

Recommended products
SMC Structure Markup
Seyed Mohammad Hosseini Hejazi
5 (6)
Overview The Smart Money Structure Markup Indicator for MetaTrader 5 is a powerful tool designed to help traders identify key market structures based on popular Smart Money Concepts (SMC) strategies. This indicator detects micro-market structures, providing insights into price movements and potential trend changes. It highlights important elements such as valid Break of Structure (BOS), Change of Character (CHoCH), and Inducement (IDM), helping traders to make informed decisions. Key Features Ma
FREE
Color Trend
Bruno Goncalves Mascarenhas
Combining the best of Price Action , Directional Movement , and Divergence / Convergence analysis, the Candle Color Trend is the easy and reliable way to identify the direction of the trend. The indicator automatically paints the candles according to the premise that the upward trend is defined by prices that form a series of ascending tops and bottoms. On the other hand, the downward trend is defined by prices that form a series of descending tops and bottoms. Color Trend is certainly one of
FREE
Free automatic Fibonacci is an indicator that automatically plots a Fibonacci retracement based on the number of bars you select on the BarsToScan setting in the indicator. The Fibonacci is automatically updated in real time as new highest and lowest values appears amongst the selected bars. You can select which level values to be displayed in the indicator settings. You can also select the color of the levels thus enabling the trader to be able to attach the indicator several times with differe
FREE
Value Chart Candlesticks
Flavio Javier Jarabeck
4.73 (11)
The idea of a Value Chart indicator was presented in the very good book I read back in 2020 , " Dynamic Trading Indicators: Winning with Value Charts and Price Action Profile ", from the authors Mark Helweg and David Stendahl. The idea is simple and the result is pure genius: Present candlestick Price analysis in a detrended way! HOW TO READ THIS INDICATOR Look for Overbought and Oversold levels. Of course, you will need to test the settings a lot to find the "correct" one for your approach. It
FREE
Power of Three MT5
Suvashish Halder
4.5 (4)
The "Power of Three" (PO3) is a concept developed by the Inner Circle Trader (ICT) to illustrate a three-stage approach used by smart money in the markets:   Accumulation, Manipulation, and Distribution . ICT traders view this as a foundational pattern that can explain the formation of any candle on a price chart. In simple terms, this concept is effective for any time frame, as long as there's a defined start, highest point, lowest point, and end. MT4 -  https://www.mql5.com/en/market/product/1
FREE
Reversal Composite Candles
MetaQuotes Ltd.
3.57 (14)
The idea of the system is to indentify the reversal patterns using the calculation of the composite candle. The reversal patterns is similar to the "Hammer" and "Hanging Man" patterns in Japanese candlestick analysis. But it uses the composite candle instead the single candle and doesn't need the small body of the composite candle to confirm the reversal. Input parameters: Range - maximal number of bars, used in the calculation of the composite candle. Minimum - minimal size of the composite can
FREE
This indicator uses a different approach from the previous version to get it's trendlines. This method is derived from Orchard Forex, and the process of making the indicator is demonstrated in there video   https://www.youtube.com/watch?v=mEaiurw56wY&t=1425s . The basic idea behind this indicator is it draws a   tangent line   on the highest levels and lowest levels of the bars used for calculation, while ensuring that the lines don't intersect with the bars in review (alittle confusing? I know
FREE
RSI abcd
Francisco Gomes Da Silva
RSI ABCD Pattern Finder: Technical Strategy 1. How the Indicator Works Combines the classic RSI with automatic detection of ABCD harmonic patterns . Key Components Standard RSI (adjustable period) Peak and Trough Markers (arrows) ABCD Patterns (green/red lines) Overbought (70) and Oversold (30) Filters 2. MT5 Setup period = 14 ; // RSI period size = 4 ; // Maximum pattern size OverBought = 70 ; // Overbought level OverSold = 30 ; // Oversold level Filter = USE_FILTER_ YES ; // Confirmation filte
FREE
QuantumAlert RSI Navigator is a free indicator available for MT4/MT5 platforms, its work is to provide "alerts" when the market is inside "overbought and oversold" regions in the form of "buy or sell" signals. This indicator comes with many customization options mentioned in the parameter section below, user can customise these parameters as needful. Join our MQL5 group , where we share important news and updates. You are also welcome to join our private channel as well, contact me for the priva
FREE
Super Trend eu
Emin Ulucanli
4.75 (4)
SUPERTREND; It is a trend following indicator based on the SuperTrend ATR created by Olivier Seban. It can be used to detect changes in trend direction and locate stops. When the price falls below the indicator curve, it turns red and indicates a downtrend. Conversely, when the price moves above the curve, the indicator turns green, indicating an uptrend. Like other indicators, it works well on SuperTrend when used in conjunction with other indicators such as MACD, parabolik SAR, Bollinger Band
FREE
Follow The Line MT5
Oliver Gideon Amofa Appiah
4.52 (29)
This indicator obeys the popular maxim that: "THE TREND IS YOUR FRIEND" It paints a GREEN line for BUY and also paints a RED line for SELL. (you can change the colors). It gives alarms and alerts of all kinds. IT DOES NOT REPAINT and can be used for all currency pairs and timeframes. Yes, as easy and simple as that. Even a newbie can use it to make great and reliable trades. NB: For best results, get my other premium indicators for more powerful and reliable signals. Get them here: https://www.m
FREE
Strong movement levels
Nikolay Mitrofanov
5 (2)
Looks for strong price movements and draws levels upon their completion. You determine the strength of the movement yourself by specifying in the settings the number of points and the number of candles of the same color in a row in one direction. There are 2 types of building in the settings: extrenum - high / low close - close price You can also adjust the number of displayed levels and the number of candles for calculations. By default, the settings indicate 5 levels for 360 candles. That
FREE
Pivot Reversal Free
Fyodor Korotkov
5 (1)
Hi there! Since I am starting commercial and non-commercial product publishing I would highly appreciate: If you like this product, please rate it. That will help to promote not only this product, but indirectly another ones. So, such promotion will help to make some money from commercial products. Thus, I will have opportunity to fund my another directions of trading researches like bot development using mql4 and mql5 programming languages as well as python written products like crypto bots. If
FREE
QuantumAlert Stoch Navigator is a free indicator available for MT4/MT5 platforms, its work is to provide "alerts" when the market is inside "overbought and oversold" regions in the form of "buy or sell" signals. This indicator comes with many customization options mentioned in the parameter section below, user can customise these parameters as needful. Join our   MQL5 group , where we share important news and updates. You are also welcome to join our private channel as well, contact me for the p
FREE
Simple Weis Wave
Jean Jacques Huve Ribeiro
3.67 (3)
One of the best tools for analyzing volume, Weis Wave was idelized by David Weis, to facilitate the reading of directional flow. For the VSA method disciples it is an evolution of the practices created by Richard Wycoff, facilitating a predictive reading of the market, always seeking an accumulation and distribution of the negotiated contracts. Cumulative wave volume  Range of wave ( removed) Average Wave volume Ref "Tim Ord lectures" ( removed)
FREE
Donchian Pro
Paulo Henrique Faquineli Garcia
5 (3)
The Donchian Channel Channels are among the most popular tools of technical analysis, as they visually convey to the analyst the limits within which most price movement tends to occur. Channel users know that valuable information can be obtained at any time, whether prices are in the central region of a band or close to one of the border lines. One of the best known techniques to explore these concepts is Bollinger Bands. However, John Bollinger was not the only one to research the application
FREE
MIDAS Super VWAP
Flavio Javier Jarabeck
4.44 (9)
Imagine VWAP, MVWAP and MIDAS in one place... Well, you found it! Now you can track the movement of Big Players in various ways, as they in general pursue the benchmarks related to this measuring, gauging if they had good execution or poor execution on their orders. Traders and analysts use the VWAP to eliminate the noise that occurs throughout the day, so they can measure what prices buyers and sellers are really trading. VWAP gives traders insight into how a stock trades for that day and deter
FREE
Are you tired of drawing trendlines every time you're analyzing charts? Or perhaps you would like more consistency in your technical analysis. Then this is for you. This indicator will draw trend lines automatically when dropped on a chart. How it works Works similar to standard deviation channel found on mt4 and mt5. It has 2 parameters: 1. Starting Bar 2. Number of bars for calculation The   starting bar   is the bar which drawing of the trend lines will begin, while the   number of bars for c
FREE
Coral Indi
Dinh Duong Luong
Coral trend is   a trend-following indicator that is widely popular among FOREX traders . It is usually used as a confluence with other indicators. It uses combinations of moving averages with complex smoothing formulas! It has two configurable parameters: Coefficient   - smoothing ratio (*) Applied price Calculation: Coral = (-0.064) * B6 + 0.672 * B5 - 2.352 * B4 + 2.744 * B3
FREE
New Day and New Week Opening Gap ICT NWOG NDOG MT5 The New Day and New Week Opening Gap ICT NWOG NDOG MT5 indicator is a powerful and practical tool designed for traders using MetaTrader 5. It helps detect price gaps that emerge at the start of a new trading day or week, making them visible on the chart. When the market closes at the end of a session, the reopening price may differ from the previous close, leading to a price gap. This indicator marks weekly price gaps ( NWOG ) in red and daily p
FREE
High Low Open Close
Alexandre Borela
4.98 (43)
If you like this project, leave a 5 star review. This indicator draws the open, high, low and closing prices for the specified period and it can be adjusted for a specific timezone. These are important levels looked by many institutional and professional traders and can be useful for you to know the places where they might be more active. The available periods are: Previous Day. Previous Week. Previous Month. Previous Quarter. Previous year. Or: Current Day. Current Week. Current Month. Current
FREE
VWAP Indicator
LUC JACOBUS A VERHEECKE
4.13 (23)
Volume Weighted Average Price (VWAP) The volume weighted average price (VWAP) is a  trading   benchmark  used by traders that gives the average price a security has traded at throughout the day, based on both volume and price. It is important because it provides traders with insight into both the trend and value of a security. This indicator VWAP V2 is free and is the manual version of the extended Easy VWAP indicator (30 Euro), where the date and time properties are automatically entered. With
FREE
Bar Color Trend
Germano Chagas
4.38 (8)
Combining the best of Price Action , Directional Movement , and Divergence/Convergence analysis, Candle Color Trend is a easy and reliable way to identify trend direction. The indicator automatically paints the candles according to the assumption that an uptrend is defined by prices that form a series of higher highs and higher lows. In contrast, a downtrend is defined by prices that form a series of lower highs and lower lows. Additionally, ADX Wilder indicator is used to measure trend weakness
FREE
Stackable VWAP
Flavio Javier Jarabeck
3.5 (4)
Volume Weighted Average Price (VWAP) is a trading benchmark commonly used by Big Players that gives the average price a Symbol has traded throughout the day. It is based on both Volume and price. Additionally we put in this indicator the MVWAP (Moving Volume Weighted Average Price). For those who do not know the usage and the importance od this indicator I recommend a great article about this subject at Investopedia ( https://www.investopedia.com/articles/trading/11/trading-with-vwap-mvwap.asp
FREE
The indicator highlights the points that a professional trader sees in ordinary indicators. VisualVol visually displays different volatility indicators on a single scale and a common align. Highlights the excess of volume indicators in color. At the same time, Tick and Real Volume, Actual range, ATR, candle size and return (open-close difference) can be displayed. Thanks to VisualVol, you will see the market periods and the right time for different trading operations. This version is intended f
FREE
Indicator and Expert Adviser  EA Available in the comments section of this product. Download with Indicator must have indicator installed for EA to work. Mt5 indicator alerts for bollinger band and envelope extremes occurring at the same time. Buy signal alerts occur when A bullish candle has formed below both the lower bollinger band and the lower envelope  Bar must open and close below both these indicators. Sell signal occur when A bear bar is formed above the upper bollinger band and upper
FREE
The Trendline Automatic indicator is an advanced technical analysis tool specifically designed to assist traders in identifying critical levels in the financial markets through the automatic drawing of support and resistance trendlines on price charts. With its automatic capabilities, this indicator saves traders time and effort in analyzing price movements, allowing them to focus on making better trading decisions. Key Features : Automatic Drawing of Trendlines : This indicator allows traders t
FREE
Aroon Indicator Classic
Fernando Lahude Ritter
The Aroon indicator measures the time since price highs and lows over a set period. It outputs two lines, Aroon Up and Aroon Down. Aroon Up shows how long it has been since a recent high occurred. Aroon Down shows how long it has been since a recent low occurred. When Aroon Up stays close to 100 and Aroon Down stays near 0, it suggests an upward trend. When Aroon Down is near 100 and Aroon Up is near 0, it suggests a downward trend. The closer each line is to 100, the stronger the recent trend i
FREE
Fibonacci Trend Indicator
Vinoth Durairaj Durairaj
Fibonacci Trend Indicator for MT5 Unlock the power of Fibonacci analysis on your MetaTrader 5 charts! Our   Fibonacci Trend Indicator   automatically plots dynamic support and resistance levels so you can spot trends, reversals, and breakout opportunities at a glance. Features & Advantages Automatic Fibonacci Levels Instantly displays seven key Fibonacci retracement levels based on the highest and lowest prices from your chosen lookback period — no manual work required. Dynamic Trend Adaptatio
FREE
FT ADX Color Candles
FELIPE MISAEL MORAES KRUGER
5 (6)
Trading can be quite tiring when you need to look at several things at the same time. Format of candles, supports, resistances, schedules, news and indicators. This tool aims to facilitate the analysis of the ADX indicator. It colors the candles based on the levels of the indicator and the DI lines. The period, the limit of the indicator and the colors of the candles are customizable. You can also place a visual aid on the lower right side of the graph to view the values of ADX, DI + and DI-
FREE
Buyers of this product also purchase
Trend Screener Pro MT5
STE S.S.COMPANY
4.85 (82)
Unlock the Power of Trends Trading with the Trend Screener Indicator: Your Ultimate Trend Trading Solution powered by Fuzzy Logic and Multi-Currencies System! Elevate your trading game with the Trend Screener, the revolutionary trend indicator designed to transform your Metatrader into a powerful Trend Analyzer. This comprehensive tool leverages fuzzy logic and integrates over 13 premium features and three trading strategies, offering unmatched precision and versatility. LIMITED TIME OFFER : Tre
Divergence Bomber
Ihor Otkydach
5 (4)
Each buyer of this indicator also receives the following for free: The custom utility "Bomber Utility", which automatically manages every trade, sets Stop Loss and Take Profit levels, and closes trades according to the rules of this strategy Set files for configuring the indicator for various assets Set files for configuring Bomber Utility in the following modes: "Minimum Risk", "Balanced Risk", and "Wait-and-See Strategy" A step-by-step video manual to help you quickly install, configure, and s
Golden Trend Indicator MT5
Noha Mohamed Fathy Younes Badr
4.89 (18)
Golden Trend indicator  is The best indicator for predicting trend movement this indicator never lags and never repaints and never back paints    and give  arrow buy and sell    before the candle appear  and it will help you and  will make your trading decisions clearer its work on all currencies and  gold and crypto and all time frame This unique  indicator uses very secret algorithms to catch the  trends, so you can trade using this indicator and see the trend clear on charts  manual guide and
NOTE: CYCLEMAESTRO is distributed only on this website, there are no other distributors. Demo version is for reference only and is not supported. Full versione is perfectly functional and it is supported. CYCLEMAESTRO , the first and only indicator of Cyclic Analysis, useful for giving signals of TRADING, BUY, SELL, STOP LOSS, ADDING. Created on the logic of   Serghei Istrati   and programmed by   Stefano Frisetti ;   CYCLEMAESTRO   is not an indicator like the others, the challenge was to inter
Algo Pumping
Ihor Otkydach
5 (11)
PUMPING STATION – Your Personal All-inclusive strategy Introducing PUMPING STATION — a revolutionary Forex indicator that will transform your trading into an exciting and effective activity! This indicator is not just an assistant but a full-fledged trading system with powerful algorithms that will help you start trading more stable! When you purchase this product, you also get FOR FREE: Exclusive Set Files: For automatic setup and maximum performance. Step-by-step video manual: Learn how to tr
MonetTrend — Премиум-индикатор для торговли по тренду (M30, H1, H4) MonetTrend — это мощный и визуально понятный трендовый индикатор, созданный для торговли на таймфреймах M30, H1 и H4. Он идеально подходит для работы с волатильными инструментами, такими как: • Золото (XAUUSD) • Криптовалюты (BTCUSD) • Валютные пары (EURUSD, USDJPY и др.) Ключевые особенности MonetTrend: • Автоматическое отображение Take Profit 1 (TP1) и Stop Loss (SL): После появления сигнала индикатор сразу показывает: • TP
TPSproTREND PrO MT5
Roman Podpora
4.72 (18)
Entry points at the bar close,  without redrawing .  Trend scanner  across all assets,  MTF - mode  and much more in one tool. We recommend using it together with   RFI LEVELS. ИНСТРУКЦИЯ RUS   /   INSTRUCTIONS  ENG         /         VERSION MT4   Main functions: Accurate entry signals WITHOUT REPAINTING! Once a signal appears, it remains valid! This is a significant distinction from repainting indicators that might provide a signal and then alter it, potentially leading to deposit losses. Now,
RelicusRoad Pro MT5
Relicus LLC
4.79 (19)
How many times have you bought a trading indicator with great back-tests, live account performance proof with fantastic numbers and stats all over the place but after using it, you end up blowing your account? You shouldn't trust a signal by itself, you need to know why it appeared in the first place, and that's what RelicusRoad Pro does best! User Manual + Strategies + Training Videos + Private Group with VIP Access + Mobile Version Available A New Way To Look At The Market RelicusRoad is th
Support And Resistance Screener Breakthrough unique Solution With All Important levels analyzer and Markets Structures Feature Built Inside One Tool ! Our indicator has been developed by traders for traders and with one Indicator you will find all Imporant market levels with one click. LIMITED TIME OFFER : Support and Resistance Screener Indicator is available for only 50 $ and lifetime. ( Original price 125$ ) (offer extended) The available tools ( Features ) in our Indicator are :  1. HH-LL S
Quantum TrendPulse
Bogdan Ion Puscasu
5 (13)
Introducing Quantum TrendPulse , the ultimate trading tool that combines the power of SuperTrend , RSI , and Stochastic into one comprehensive indicator to maximize your trading potential. Designed for traders who seek precision and efficiency, this indicator helps you identify market trends, momentum shifts, and optimal entry and exit points with confidence. Key Features: SuperTrend Integration: Easily follow the prevailing market trend and ride the wave of profitability. RSI Precision: Detect
Gold Stuff mt5
Vasiliy Strukov
4.93 (178)
Gold Stuff mt5 is a trend indicator designed specifically for gold and can also be used on any financial instrument. The indicator does not redraw and does not lag. Recommended time frame H1. Contact me immediately after the purchase to get   personal bonus!  You can get a free copy of our Strong Support and Trend Scanner indicator, please pm. me! Settings  and manual   here  Please note that I do not sell my EA's or special sets on telegram, it is only available on Mql5 and my set files are on
FX Power MT5 NG
Daniel Stein
5 (15)
FX Power: Analyze Currency Strength for Smarter Trading Decisions Overview FX Power is your go-to tool for understanding the real strength of currencies and Gold in any market condition. By identifying strong currencies to buy and weak ones to sell, FX Power simplifies trading decisions and uncovers high-probability opportunities. Whether you’re looking to follow trends or anticipate reversals using extreme delta values, this tool adapts seamlessly to your trading style. Don’t just trade—trade
TPSpro RFI Levels MT5
Roman Podpora
4.55 (20)
Reversal zones / Peak volumes / Active zones of a major player =  TS TPSPROSYSTEM INSTRUCTIONS RUS  /  INSTRUCTIONS   ENG          /       Version MT4 Every buyer of this indicator additionally receives FREE: 3 months of access to trading signals from the RFI SIGNALS service - ready-made entry points according to the TPSproSYSTEM algorithm. Training materials with regular updates - immerse yourself in strategy and grow your professional level. 24/5 support on weekdays and access to a closed tra
FX Levels MT5
Daniel Stein
5 (4)
FX Levels: Exceptionally Accurate Support & Resistance for All Markets Quick Overview Looking for a reliable way to pinpoint support and resistance levels across any market—currencies, indices, stocks, or commodities? FX Levels merges our traditional “Lighthouse” method with a forward-thinking dynamic approach, offering near-universal accuracy. By drawing from real-world broker experience and automated daily plus real-time updates, FX Levels helps you identify reversal points, set profit targe
MONEYTRON – ТВОЙ ЛИЧНЫЙ СИГНАЛ НА УСПЕХ! XAUUSD | AUDUSD | USDJPY | BTCUSD Поддержка таймфреймов: M5, M15, M30, H1 Почему трейдеры выбирают Moneytron? 82% успешных сделок — это не просто цифры, это результат продуманной логики, точного алгоритма и настоящей силы анализа. Автоматические сигналы на вход — не нужно гадать: когда покупать, когда продавать. 3 уровня Take Profit — ты сам выбираешь свой уровень прибыли: безопасный, уверенный или максимум. Четкий Stop Loss — контролируешь риск
Atomic Analyst MT5
Issam Kassas
4.32 (19)
First of all Its worth emphasizing here that this Trading Indicator is   Non-Repainting   , Non Redrawing and Non Lagging Indicator   Indicator, Which makes it ideal from both manual and robot trading.  User manual: settings, inputs and strategy . The Atomic Analyst  is a PA Price Action Indicator that uses Strength and Momentum of the price to find a better edge in the market. Equipped with Advanced filters which help remove noises and false signals, and Increase Trading Potential. Using Multi
FX Volume MT5
Daniel Stein
4.82 (17)
FX Volume: Experience Genuine Market Sentiment from a Broker’s Perspective Quick Overview Looking to elevate your trading approach? FX Volume provides real-time insights into how retail traders and brokers are positioned—long before delayed reports like the COT. Whether you’re aiming for consistent gains or simply want a deeper edge in the markets, FX Volume helps you spot major imbalances, confirm breakouts, and refine your risk management. Get started now and see how genuine volume data can
FourAverageMT5
Mikhail Sergeev
5 (2)
FourAverage is a new word in trend detection. With the development of information technology and a large number of participants, financial markets are becoming less amenable to analysis by outdated indicators. Conventional technical analysis tools, such as a Moving Average or Stochastic, in their pure form are not able to determine the direction of a trend or its reversal. Can one indicator indicate the correct direction of the future price, without changing its parameters, based on the history
***  Entry In The Zone and SMC Multi Timeframe is a realtime market analysis tool based on the Smart Money Concept (SMC). It effectively integrates reversal signals and automatically identifies key reversal zones through Multi Timeframe Structure Detection, along with the identification of Points of Interest (POI). This tool is designed to help traders plan and make decisions with greater confidence and a more structured approach. *** Features include : - Automated market structure detection (B
Matrix Arrow Indicator MT5
Juvenille Emperor Limited
5 (13)
Matrix Arrow Indicator MT5  is a unique 10 in 1 trend following   100% non-repainting  multi-timeframe indicator that can be used on all symbols/instruments:   forex,   commodities,   cryptocurrencies,   indices,   stocks .  Matrix Arrow Indicator MT5  will determine the current trend at its early stages, gathering information and data from up to 10 standard indicators, which are: Average Directional Movement Index (ADX) Commodity Channel Index (CCI) Classic Heiken Ashi candles Moving Average
MetaForecast M5
Vahidreza Heidar Gholami
5 (3)
MetaForecast predicts and visualizes the future of any market using different powerful methods. While financial markets are not always predictable, if there are patterns in the past data, MetaForecast can learn and predict the future as accurately as possible. It features a complete implementation of neural networks embedded directly into the indicator, enabling traders to create and train AI models using data from multiple symbols to learn complex patterns. MetaForecast leverages your computer'
CBT Quantum Maverick High-Efficiency Binary Trading System CBT Quantum Maverick is a finely tuned, high-performance Binary Options Trading System designed for traders seeking precision, simplicity, non-repaint signals and disciplined trading. No customization is required—this system is optimized for effective results right out of the box. Simply follow the signals, which can be mastered with a bit of practice. Key Features: Signal Precision: New-bar-based trading signals—targeting the next ca
Best Solution for any Newbie or Expert Trader! This Indicator is a unique, high quality and affordable trading tool because we have incorporated a number of proprietary features and a new formula. With only ONE chart you can read Currency Strength for 28 Forex pairs! Imagine how your trading will improve because you are able to pinpoint the exact trigger point of a new trend or scalping opportunity? User manual:   click here That's the first one, the original! Don't buy a worthless wannabe clone
Gold Trend 5
Sergei Linskii
3.5 (2)
Gold Trend - this is a good stock technical indicator. The indicator algorithm analyzes the price movement of an asset and reflects volatility and potential entry zones. The best indicator signals: For SELL = red histogram + red SHORT pointer + yellow signal arrow in the same direction. For BUY = blue histogram + blue LONG pointer + aqua signal arrow in the same direction. Benefits of the indicator: The indicator produces signals with high accuracy. A confirmed arrow signal can only be redrawn
Auto Order Block with break of structure based on ICT and Smart Money Concepts (SMC) Futures Break of Structure ( BoS )             Order block ( OB )            Higher time frame Order block / Point of Interest ( POI )    shown on current chart           Fair value Gap ( FVG ) / Imbalance   -  MTF      ( Multi Time Frame )    HH/LL/HL/LH  -  MTF      ( Multi Time Frame )  Choch  MTF      ( Multi Time Frame )  Volume Imbalance     ,  MTF          vIMB Gap’s Power of 3 Equal High / Low’s  
This dashboard shows the latest available   harmonic patterns   for the selected symbols, so you will save time and be more efficient /   MT4 version . Free Indicator:   Basic Harmonic Pattern Comparison of "Basic Harmonic Pattern" vs. "Basic Harmonic Patterns Dashboard" Indicators Feature Basic Harmonic Pattern Basic Harmonic Patterns Dashboard Functionality Detects and displays harmonic patterns on a single chart Searches multiple symbols and timeframes for harmonic patterns, displays res
Black Dragon indicator mt5
Ramil Minniakhmetov
4.84 (61)
The trend detection indicator will compliment any strategy and can also be used as an independent tool. Be careful i not sell EA or sets at telegram it scam. All settings free here at   blog .  IMPORTANT! Contact me immediately after the purchase to get instructions and a bonus!  Benefits  Easy to use; does not overload the graphic wih unnecessary information. The ability to use as filter for any strategy. Contains bult -in dynamic levels of cupport and resistange,  which can be used both, for p
First of all Its worth emphasizing here that this Trading Tool is Non Repainting , Non Redrawing and Non Lagging Indicator , Which makes it ideal for professional trading . Online course, user manual and demo. The Smart Price Action Concepts Indicator is a very powerful tool for both new and experienced traders . It packs more than 20 useful indicators into one , combining advanced trading ideas like Inner Circle Trader Analysis and Smart Money Concepts Trading Strategies . This indicator focus
MetaBands M5
Vahidreza Heidar Gholami
4.5 (2)
MetaBands uses powerful and unique algorithms to draw channels and detect trends so that it can provide traders with potential points for entering and exiting trades. It’s a channel indicator plus a powerful trend indicator. It includes different types of channels which can be merged to create new channels simply by using the input parameters. MetaBands uses all types of alerts to notify users about market events. Features Supports most of the channel algorithms Powerful trend detection algorith
Introducing   Quantum Breakout PRO , the groundbreaking MQL5 Indicator that's transforming the way you trade Breakout Zones! Developed by a team of experienced traders with trading experience of over 13 years,   Quantum Breakout PRO   is designed to propel your trading journey to new heights with its innovative and dynamic breakout zone strategy. Quantum Breakout Indicator will give you signal arrows on breakout zones with 5 profit target zones and stop loss suggestion based on the breakout b
More from author
ADXW Cloud Pro
Shahabeddin Baset
Full implementation of Directional Movement System for trading, originally developed by Welles Wilder, with modifications to improve profitability, to reduce the number of unfavorable signals, and with Stop Loss lines. No re-paint Features Buy/sell signals displayed on the chart Stop levels visually indicated on the chart Profit-taking points presented in the indicator window Exit points for unfavorable positions presented in the indicator window Signal confirmation through high/low swing cros
OBV macd
Shahabeddin Baset
5 (3)
OBV MACD Calculating MACD based on OBV data Features 3 outputs: MACD & Signal & Histogram 4 Colored Histogram Smoothing factor show/hide option for MACD & Signal lines Description Among the few indicators developed for working with volume data, OBV (On Balance Volume) is the simplest yet most informative one. Its logic is straightforward: when the closing price is above the previous close, today's volume is added to the previous OBV; conversely, when the closing price is below the previous close
FREE
ADXW Cloud
Shahabeddin Baset
4.6 (5)
This is Wilder's ADX with cloud presentation of DI+ & DI- lines. Features 4 standard lines of the ADX indicator: DI+, DI-, ADX, ADXR cloud presentation of DI+/DI- lines with transparent colors applicable to all time-frames and all markets What Is ADX J. Welles Wilder Jr., the developer of well-known indicators such as RSI, ATR, and Parabolic SAR, believed that the Directional Movement System, which is partially implemented in ADX indicator, was his most satisfying achievement. In his 1978 book,
FREE
ARC Ichimoku
Shahabeddin Baset
5 (1)
Combination of Ichimoku and Super Trend indicators. 1. ARC (Average Range times Constant) The concept of ARC or Volatility System was introduced by Welles Wilder Jr. in his 1978 book, New Concepts in Technical Trading Systems . It has since been adapted and modified into the popular Super Trend indicator. The fundamental idea behind ARC is simple: to identify support and resistance levels, you multiply a constant with the Average True Range (ATR) . Then, you either subtract or add the resulting
FREE
Includes almost all the concepts related to Volume Profile: POC , Value Area , Developing POC , Anchored VWAP , Volume Delta ; since the “Total” in its name. It is fast in its calculations and simple to work with. Features: 1.    Selectable calculation timeframe to find most traded levels. 2.    Capable of calculating Volume Profile based on tick data 3.    Adjustable histogram bars by their count. 4.    Adjustable histogram bars by their height (price range). 5.    Showing Value Area (VA
High Low Swing
Shahabeddin Baset
High Low Swing (HLS) Indicator The HLS indicator is a technical analysis tool designed to identify swing highs and lows in the market, aiding swing traders in making informed decisions. It offers an adjustable "degree" parameter, allowing you to customize the sensitivity to strong price movements based on current market conditions. Features: •    Clear Buy/Sell Signals: The indicator plots signals directly on the chart, simplifying trade identification. •    Adjustable Swing Strength: The "degr
FREE
Features All Ichimoku Signals (Selectable) : Display all reliable signals generated by the Ichimoku indicator. You can choose which signals to view based on your preferences. Filter by Signal Strength : Sort signals by their strength—whether they are weak, neutral, or strong. Live Notifications : Receive real-time notifications for Ichimoku signals. Transparent Cloud : Visualize the Ichimoku cloud in a transparent manner. Available Signals Tenkensen-Kijunsen Cross Price-Kijunsen Cross Price-C
Combination of Ichimoku and Super Trend indicators, with Signals and live notifications on Mobile App and Meta Trader Terminal. Features: Display five reliable signals of ARC Ichimoku Filter signals by their strength level (strong, neutral, weak) Send live notifications on Mobile App and Meta Trader terminal S ignals remain consistent without repainting Applicable across all time-frames Suitable for all markets Notifications format: "ARC Ichimoku | XAUUSD | BUY at 1849.79 | Tenken-Kijun cross |
Filter:
xz00
14
xz00 2025.04.06 03:11 
 

指标非常不错,可靠性高。N:=3;DIFF:=EMA(CLOSE,12)-EMA(CLOSE,26);DEA:=EMA(DIFF,9);MACD:=2*(DIFF-DEA);KX:=BARSSINCE(CLOSE);HHN:=CONST(HHV(DIFF,KX));HLN:=CONST(LLV(DEA,KX));RC1:=CONST((HHN+HLN)/2);SS:=((HHN-HLN)/200);MACD底部:=(-100*SS+RC1)+-(-100*SS+RC1),COLOR669999;MACD顶部:=(100*SS+RC1)+-(-100*SS+RC1),COLORFF0033;MACD中轴:=0+-(-100*SS+RC1);DIFF修正:=DIFF+-(-100*SS+RC1),COLOR008080;DEA修正:=DEA+-(-100*SS+RC1),COLOR00FF00;MACD修正1:=2*(DIFF修正-DEA修正)+MACD中轴,COLOR0000BB,NODRAW;MACD修正2:= EMA(MACD修正1,3);MACD超跌:=CONST(LLV(MACD修正1,KX));MACD超跌线:=IF(MACD超跌< MACD底部,MACD超跌,MACD底部);顶部:=MACD顶部+-MACD超跌线;天际:=顶部*0.809;中轴:=MACD中轴+-MACD超跌线;海面:=顶部*0.191;底部:=MACD底部; DIF55:=(EMA(CLOSE,55)-EMA(CLOSE,119))*0.55;DEA55:=(EMA(DIF55,41));DRAWBAND(DEA55,RGB(0,255,0),DIF55,RGB(255,0,255));DIF60:=EMA(CLOSE,12/2)-EMA(CLOSE,26/2);DEA60:=EMA(DIF60,9/2);DRAWBAND(DEA60,RGB(0,255,255),DIF60,RGB(255,255,0));AA:=REF(DIF60,N)=HHV(DIF60,2*N+1);BB:= (AA,N+1);CC:=FILTER(BB,N) AND DIF60=HHV(DIF60,N+1);A11:=BARSLAST(REF(CC,1));顶背离:=REF(CLOSE,A11+1)< CLOSE AND REF(DIF60,A11+1)>DIF60 AND CC;MACD多头:DIFF修正+-MACD超跌线,COLOR339999;空头:DEA修正+-MACD超跌线,COLOR00FF00;量能柱:2*(MACD多头-空头)+中轴,COLOR0000BB,NODRAW;超前DEA:=(EMA(MACD多头,7)); 超前MACD:=2*(MACD多头-超前DEA)+中轴;微_信:DRAWNULL,COLOR00FF00;FSC2012782002:DRAWNULL,COLORRED;MACD多空趋势:DRAWBAND(MACD多头,RGB(204,51,51),空头,RGB(0,130,244));MACD多头重画:DRAWBAND(MACD多头,RGB(153,153,51),MACD多头,RGB(153,153,51));MACD空头重画:DRAWBAND(空头,RGB(0,224,224),空头,RGB(0,224,224));MACD红柱1:STICKLINE(量能柱>=中轴,量能柱,中轴,1.5,0),COLOR2E0022{COLOR000077};MACD红柱2:STICKLINE(量能柱>=中轴,量能柱,中轴,1.1,0),COLOR372635{COLOR809A3C}{COLOR000088};MACD红柱3:STICKLINE(量能柱>=中轴,量能柱,中轴,0.6,0),COLORFF00FF{COLOR000099};MACD红柱4:STICKLINE(量能柱>=中轴,量能柱,中轴,0.15,0),COLORFF00FF{COLOR0000AA};MACD紫柱1:STICKLINE(量能柱<=中轴,量能柱,中轴,1.5,0),COLOR2E0022{COLOR808040}{COLORAA6633};MACD紫柱2:STICKLINE(量能柱<=中轴,量能柱,中轴,1.1,0),COLOR372635{COLOR809A3C}{COLORBB7744};MACD紫柱3:STICKLINE(量能柱<=中轴,量能柱,中轴,0.6,0),COLORGREEN{COLORCC8855};MACD紫柱4:STICKLINE(量能柱<=中轴,量能柱,中轴,0.15,0),COLORGREEN{COLORDD9966};上面这代码是通达信三合一MACD代码。希望博主将其转化为mt5指标格式

Shahabeddin Baset
15915
Reply from developer Shahabeddin Baset 2025.04.07 06:34
Thank you for your suggestion. If you have any file of this code, please send it to me in DM. (In English please)
Wilna Barnard
1075
Wilna Barnard 2024.12.17 20:42 
 

Very nice work. Well done

11552242
54
11552242 2024.12.03 03:01 
 

Muy buen indicador

alancads
15
alancads 2024.11.16 15:30 
 

Hello man, it's the best MACD indicator I've ever used on MT5, thanks for your work in codifying it for the advancement of the community.

Shahabeddin Baset
15915
Reply from developer Shahabeddin Baset 2024.11.16 19:36
Thank you for your encouraging review
92923155
54
92923155 2024.10.07 10:44 
 

Hi there, Very good, i like it thankyou

Rafal Krzysztof Manuszewski
2327
Rafal Krzysztof Manuszewski 2024.10.04 19:23 
 

ok

8d_eAb4iiiVk27
14
8d_eAb4iiiVk27 2024.08.25 05:38 
 

Hi, thank you for this classic MACD indi. When I try to read the values from this indi, the MACD & Hist values are correct, but the Signal is wrong (seems to always be 0) - have I done something wrong? In the data windows, I only see 3 values - Hist, MACD, Hist (in this order)

Shahabeddin Baset
15915
Reply from developer Shahabeddin Baset 2024.10.05 08:38
It couldn't be this way. In data window you see histo, macd, signal, and their buffer numbers are 0, 2, 3. Buffer number 1 is reserved for histogram color index.
mickaswah
125
mickaswah 2024.08.07 12:47 
 

User didn't leave any comment to the rating

grossi
14
grossi 2024.07.16 02:51 
 

Is there a possibility to buy the language of this indicator?? call me if possible. matheus.grossi51@gmail.com

Shahabeddin Baset
15915
Reply from developer Shahabeddin Baset 2024.07.16 13:53
Please explain in DM what you are looking for in the code, hopefully I can help you.
znshshi
82
znshshi 2024.07.04 16:04 
 

Always works well, very reliable.

Shahabeddin Baset
15915
Reply from developer Shahabeddin Baset 2024.07.16 11:26
Happy to hear that. Thank you.
CristianoFleury
36
CristianoFleury 2024.06.03 18:16 
 

Bom dia, gostei ...!!

Rey Sonajo
320
Rey Sonajo 2024.05.11 00:55 
 

User didn't leave any comment to the rating

H W
90
H W 2024.05.10 21:14 
 

Beautiful indicator, exactly what I wanted

Shahabeddin Baset
15915
Reply from developer Shahabeddin Baset 2024.05.11 08:05
happy that it was helpful
alf2016
249
alf2016 2024.04.05 19:10 
 

Hilfreicher Indikator ist ok.

Shahabeddin Baset
15915
Reply from developer Shahabeddin Baset 2024.04.05 20:27
danke schon
Reply to review