Watch the Market tutorial videos on YouTube
How to buy а trading robot or an indicator
Run your EA on
virtual hosting
virtual hosting
Test аn indicator/trading robot before buying
Want to earn in the Market?
How to present a product for a sell-through
Technical Indicators for MetaTrader 5 - 94

The Visual Momentum Trend Strength Indicator is a powerful tool designed to enhance your technical analysis. Priced at $65, this indicator is not optimized, giving you the flexibility and control to tailor it to your unique trading style and strategy. The Momentum Trend Strength Indicator combines momentum dynamics with trend strength analysis, providing traders with a visual and accurate way to identify key market opportunities. This tool evaluates the market's directional strength and momentu

The Visual Momentum Zero Cross Indicator offers traders an advanced tool designed to identify key momentum shifts and precise zero-crossing levels in the market. This indicator is not optimized and is created for you to tailor and optimize it to suit your unique trading style and preferences. What does it do?
The Visual Momentum Zero Cross Indicator identifies critical moments when the momentum crosses the zero line, signaling potential trend reversals or continuations. By focusing on these piv

Uncover Market Structure Like Never Before!
The Visual ZigZag Market Structure Indicator is your ultimate tool for identifying key market turning points and structural patterns. Designed with flexibility in mind, this indicator provides traders with a visual framework to analyze market waves and define strategic entry and exit zones. Please note: This indicator is not optimized and is designed for you to tailor it to your trading style. How It Works
The logic behind the ZigZag Market Structure

Visual ZigZag Pattern Indicator
The Visual ZigZag Pattern Indicator is a cutting-edge tool designed to assist traders in identifying key market structure points based on the ZigZag algorithm. Whether you’re trading Forex, stocks, or indices, this indicator provides a clear representation of price swings, allowing you to analyze market trends and plan your entries and exits effectively. Please note, this indicator is not optimized and is created for you to optimize it according to your unique tr

Visual ZigZag Trend Indicator Welcome to the Visual ZigZag Trend Indicator This advanced tool is designed to provide a dynamic representation of market trends by combining ZigZag calculations with trend detection capabilities. Please note, this indicator is not optimized, allowing you the flexibility to tailor it to your unique trading strategy. For only $65, it offers a powerful framework for spotting market movements and trend reversals. Let’s dive into how this tool can elevate your trading

Unleash the Power of Precision Trading with Engulfing Detector ! Are you struggling to spot high-probability reversal patterns on your charts? Say goodbye to guesswork and hello to accuracy with Engulfing Detector ! Why Choose Engulfing Detector? Automated Detection : Instantly identifies Bullish and Bearish Engulfing patterns with pinpoint accuracy. Visual Alerts : Clear arrows mark potential entry points, so you never miss a trading opportunity. User-Friendly : Designed for traders of all l

Visual Envelope Indicator is designed for traders who want a clear visual representation of market trends, potential reversals, and price dynamics within defined envelope boundaries. This indicator simplifies market analysis, offering a unique perspective for crafting your trading strategy. Please note that this indicator is not optimized—it's intentionally built for you to optimize it according to your trading style and goals. Strategy and Logic Behind the Indicator
The Visual Envelope Indicat

Visual Envelope Price Cross Indicator Unlock the power of price envelope dynamics with the Envelope Price Cross Indicator! This tool is designed to identify potential trade opportunities by analyzing price movements relative to the envelope bands. It is a valuable addition to your trading arsenal, providing insights into trend continuations, reversals, and market momentum. Important: This indicator is not optimized. It is created for YOU to optimize and fine-tune to match your trading strategy.

Optimize Your Strategy with the Envelope Support Bounce Indicator! The Visual Envelope Support Bounce Indicator is designed as a tool for traders who want to unlock the potential of envelope-based strategies in their trading. This indicator is not pre-optimized, allowing you to fully customize and optimize it to suit your trading style and preferences. Whether you're a scalper, day trader, or swing trader, the flexibility of this tool makes it an invaluable addition to your arsenal. What Does I

Welcome to the Visual Envelope Trend Flow Indicator! This tool is not optimized and has been crafted specifically for you to explore, test, and fine-tune according to your unique trading strategy. It offers flexibility and a powerful starting point for traders aiming to master trend identification and price flow dynamics. Strategy and Logic Behind the Indicator:
The Visual Envelope Trend Flow Indicator leverages the concept of envelope channels, which are dynamic boundaries drawn around price a

Range Directional Force Indicator – Designed for You to Optimize! The Range Directional Force Indicator is a cutting-edge tool designed to empower traders by visualizing market dynamics and directional strength. Built to offer insights into market trends and reversals, this indicator is an invaluable asset for traders seeking precision in their strategies. However, it is important to note that this indicator is not optimized, leaving room for you to tailor it to your unique trading preferences.

Explore the Power of Precision with the Range Indicator! This cutting-edge indicator is designed to provide traders with a detailed analysis of market range movements. However, it is essential to note that the Visual Range Indicator is not optimized—it has been crafted for you to tailor it to your trading needs and optimize it for your unique strategy. Your mastery and customization will unlock its true potential! The Strategy Behind the Range Indicator
The Visual Range Indicator focuses on ide

Introducing the Aroon Indicator
The Aroon Indicator is a powerful tool designed to help you identify trend strength, direction, and potential reversals in the market. Built with precision, this indicator offers unparalleled insights into market dynamics, enabling traders to make informed decisions. Remember, this indicator is not optimized and is crafted for you to optimize according to your trading preferences. How It Works
The Aroon Indicator operates on the principle of calculating the time

Visual Aroon Cross Signal Indicator
Price: $65 Discover the power of trend identification and reversal points with the Visual Aroon Cross Signal Indicator! Designed to assist traders in recognizing key market movements, this indicator focuses on the Aroon oscillator’s signal crossing to detect market trends and shifts, offering insights into potential trade setups. Note to Buyers:
This indicator is not optimized. It’s a powerful tool crafted for traders to adjust and customize according to thei

Introducing the "Visual Aroon Directional Shift Indicator" – a tool designed to help traders uncover trend strength and directional shifts in the market with precision. This indicator is available for $65 and provides an unparalleled view into market dynamics for both novice and experienced traders. Not Optimized, Created for You to Optimize
This indicator is intentionally designed without pre-set optimizations, giving you the freedom to adjust its settings according to your unique trading styl

The Visual Aroon Zero Level Indicator is a powerful analytical tool designed to assist traders in identifying market trends, momentum, and potential reversals using the robust Aroon oscillator logic. It offers clear and actionable insights, making it an essential addition to your trading toolkit. Key Features and Logic Behind the Indicator:
Aroon Oscillator Mechanics:
The Aroon Oscillator operates by analyzing the time since the most recent highs and lows occurred. The indicator calculates the

The Visual Mass Reversal Indicator is an advanced analytical tool designed for traders seeking to identify potential market reversals. This indicator brings powerful visual clarity to reversal opportunities, enabling traders to spot entry points effectively. Please note, the indicator is not optimized—it is intentionally crafted for you to optimize and tailor it to your unique trading strategies. The Strategy Behind the Indicator
The Mass Reversal Indicator uses a sophisticated algorithm to det

Unleash the Power of Market Dynamics with the Vortex Indicator! The Visual Vortex Indicator is your advanced tool for decoding market trends, reversals, and momentum shifts. Priced at $65, this indicator provides a comprehensive view of market behavior, but it’s designed for you to fine-tune and optimize it according to your unique trading strategy. What Makes It Unique?
The Vortex Indicator is based on a strategy that identifies directional movements and trend strength by analyzing key price d

Visual Vortex Momentum Shift Indicator Unlock the potential of momentum shifts in the market with the Visual Vortex Momentum Shift Indicator! This advanced tool is designed to help traders identify crucial turning points and momentum reversals with clarity and precision. However, this indicator is not optimized and is created for you to optimize based on your trading preferences and strategies. What is the Visual Vortex Momentum Shift Indicator?
The indicator focuses on detecting momentum shift
Visual Vortex Signal Indicator
The Visual Vortex Signal Indicator is your pathway to exploring dynamic market conditions and refining your trading strategy. This indicator is not optimized—it is intentionally designed for traders to tweak and perfect it to suit their trading preferences and objectives. By taking full control of its parameters, you can tailor it to complement your trading approach. How It Works
The Visual Vortex Signal Indicator leverages the power of the Vortex Indicator (VI),

The Visual Vortex Trend Strength Indicator is designed to help traders assess the strength and direction of trends, allowing for better trade placements and exit strategies. While it is not optimized, it provides flexibility for customization according to personal trading preferences and strategies. How It Works: Trend Confirmation: Helps determine if the market is trending or ranging. Strength Analysis: Measures the vigor of the trend, aiding in trade placements. Potential Reversals: Detects w

In the rapidly changing financial markets, finding reliable trading signals is the key to success!
In trading, the timing of entry is everything!!
Whether you are a short-term trader or a long-term investor, this indicator can provide you with the most accurate entry signals, helping you to seize market opportunities and become your most powerful trading assistant!
MT4: https://www.mql5.com/en/market/product/129945
Features: Accurate Entry Signals: Based on advanced algorithms and real-tim

Fibonacci Probability: The Power of Technical Analysis at Your Fingertips Transform your market analysis with the Fibonacci Probability Indicator, an essential tool for traders who wish to identify critical support and resistance levels with millimetric precision. Developed based on the principles of the Fibonacci sequence, this indicator offers a comprehensive analysis of market movements, helping you make more informed and strategic decisions. Indicator Features: Precise Fibonacci Levels: Aut

Indicator Name: Probability Indicator Description: The Probability Indicator is a powerful tool for traders who want to identify buying and selling opportunities based on the analysis of previous candles. This indicator calculates the probability of rise (CALL) and fall (PUT) based on the number of candles analyzed and displays arrows on the chart to signal possible entry points. Features: Candle Analysis: Analyzes a configurable number of candles to calculate the probability of rise and fall. V
Introducing the unique trading system Dynamic trend cycles oscillator (DTC) — a powerful tool for H1-H4 trading with volatility pairs !
Technical capabilities - pairs to trade : EURUSD,GBPUSD,XAUUSD; - timeframes : M30,H1,H2,H3,H4;
Why Choose DTC? - Accurate Trend Analysis: DTC adapts to current market volatility, providing precise tracking of price trends. This allows you to confidently open positions in line with the main trend and maximize your profits. - Filtering False Signals: In times
Introducing the manual trading system "Flexi trend tracker indicator" — a powerful instrument for hour+ timeframes trading with medium/soft volatility pairs! This system offers unique features: wide range of applications: This strategy can be used on various time intervals: H1, H2, H3, and H4 timeframes, making the trading advisor a highly versatile tool for trading. the system works on comfortable USD crosses: USDCAD, USDCAD, and USDCAD pairs where you won't see overwhelming trends that wipe
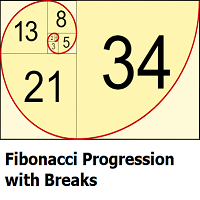
This indicator highlights points where price significantly deviates from a central level. This deviation distance is determined by a user-set value or using a multiple of a period 200 Atr and is multiplied by successive values of the Fibonacci sequence. Settings
Method: Distance method, options include "Manual" or "Atr"
Size: Distance in points if the selected method is "Manual" or Atr multiplier if the selected method is "Atr"
Sequence Length: Determines the maximum number of significant devia
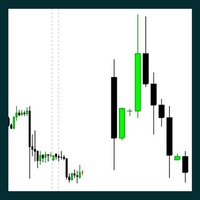
The Indicator is useful for professional trader, such as ICT , Smart Money Concept trader; who do the top-down analysis and want to display the candles of the Higher Timeframe on the Lower Timeframe. It allows you to stay in your entry timeframe while following the narrative of the Higher timeframe. Here are some easy input: Number Of Bars: The total of HTF's candle you want to display. Auto Timeframe: If true, the indicator will recommend the Higher timeframe that suit the current timeframe you

Presentation: Discover an advanced version of the Stochastic Oscillator indicator, designed for demanding traders. This tool integrates sound and visual alerts for crossovers at specific levels, providing precise analysis and clear signals to optimize your trading decisions. Key Features: Sound Alerts: Automatic audio signal for a bullish crossover (%K crossing %D upwards) between levels 0 and 60. (Adjustable Parameter) Automatic audio signal for a bearish crossover (%K crossing %D downwards) be

This is the Parabolic Dashboard MT5. This dashboard will scan multiple timeframes and symbols in MT5 platform, from M1 chart to D1 chart. It will send the buy/sell signals by alert on the platform or sending notification to your phone or message you via a email.
The buy signal is generated when the SAR changes its position from above to below of the candle. The sell signal is is generated when the SAR changes its position from below to above of the candle. The up/down trend color will be disp
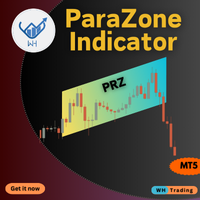
The ParaZone Indicator MT5 helps you spot areas where price trends are likely to reverse. It marks these zones on your chart using a unique parallelogram shape, making it easier to find the best points to enter or exit trades. Whether you’re a beginner or experienced trader, this tool can help improve your trading decisions. Key Features: Accurate Reversal Detection: Identifies key zones where price may change direction. Dynamic Zone Adaptation: Zones adjust in real-time to follow market movemen

Pivot Math Support and Resistance Lines indicator — indicator showing pivot lines, which will definitely help every trader who knows how to trade with resistance, support and pivot lines. It shows 8 different lines (additional lines are also possible) on the main chart, helping you find the best points to buy, sell and exit positions. Input parameters: P (default = 64) — period in bars or other periods (set using MMPeriod), on which the lines will be calculated. The smaller this number, the "f

Heat Map Indicator - Advanced Volume Analysis
Introducing the Heat Map Indicator - A Professional Tool for Market Volume Analysis!
**Key Features**
**Visual Heat Map** - Instant volume intensity visualization through colors - Blue: Low volume - Green: Medium volume - Yellow/Orange: Increasing volume - Red: High volume
**Intuitive Interface** - Dynamic color scale - Real-time percentage indicator - Current level indicator - Customizable colors and transparency
**Smart Alert System** - Custo
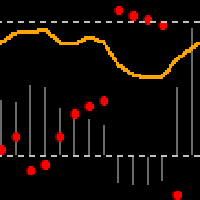
The stochastic indicator itself creates false signals. One way to determine that the price is trending is to use the parabolic SAR indicator. As a rule, it is plotted on the chart.
The projection of the SAR into the Stochastic Indicator is not complicated (pSAR-min)/(max-min). This will allow you to track price movement from two views in one place.
It depends very much on the parameter settings.
If the price is trending, the SAR moves towards the midpoints or close to them. On the other hand, a
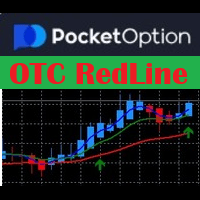
Custom Heiken Ashi and Moving Averages-Based Signal Indicator Overview
This Heiken Ashi and Moving Average-based indicator is designed to identify trend-following buy and sell signals by analyzing the relationship between three Exponential Moving Averages (EMAs). It applies Heiken Ashi smoothing to filter market noise and improve trend clarity. EMA Crossovers for Trend Detection – Uses 3, 8, and 25-period EMAs to confirm trends. Heiken Ashi Smoothing – Reduces market noise for better trend vis
To get access to MT4 version please click here . This is the exact conversion from TradingView: "Fearzone - Contrarian Indicator" by " Zeiierman ". The screenshot shows similar results from tradingview and Metatrader when tested on ICMarkets on both platforms. This is a light-load processing and non-repaint indicator. All input options are available. Buffers are available for processing in EAs. You can message in private chat for further changes you need. Thanks for downloading
BBVectorDynamics_indicator is an innovative trading system specifically designed for volatile markets. Based on unique algorithms for analyzing market forces and identifying imbalances between buyers and sellers, this system helps you make precise and well-considered decisions in the trading process. Main features of the bb vector dynamics_indicator:
Calculation of dynamic vectors. System determines the differences between the extreme price values and smoothed averages over a specified period.

Chronolines – Temporal Support and Resistance Levels for MetaTrader 5 Introduction to Chronolines
Chronolines is a graphical indicator designed to identify and visualize temporal support and resistance levels using the Highs and Lows of four predefined periods. It is compatible with all assets available on MetaTrader 5 , including stocks, currencies, commodities, indices, and cryptocurrencies, offering a logical and structured approach to tracking market behavior. Lines and Periods
Chronolines
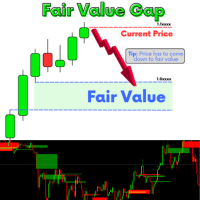
A fair value gap (FVG) is a temporary price gap that occurs when the price of a stock or security is out of line with its fair value. This gap is often caused by an imbalance between buyers and sellers. How it works Price imbalance When there is an imbalance between buyers and sellers, the price of a security can move too quickly. Price gap This creates an unadjusted area on the price chart, known as the fair value gap Price correction The price is often drawn back to the fair value gap, as i
ParabolicSAR_Fibo_Channel is an indicator built not on the price deviation from the last extremum, as in a regular similar filter, but on the readings of Parabolic SAR and its intersection with the price chart. As a result, the indicator has a smaller delay in determining a new reversal point. In addition, the filter very conveniently built in Fibonacci levels, which are built on the basis of three consecutive ZigZag peaks, as well as a channel built on the same points. As a result, this indicat
Regression_Channel_mod Indicator that expands our standard linear regression channel by adding support and resistance lines. Easy to integrate into other indicators.
The linear regression channel consists of several parallel lines equidistant from the upper and lower part of the linear regression trend line. The distance between the channel boundaries and the regression line is equal to the deviation of the maximum closing price from the regression line.

FiboPivotsIndicator is the indicator for intraday traders looking for key breakout levels and target levels on the chart. It uses automatic Fibonacci extensions and pivot points to highlight price event areas. FiboPivotsIndicator is a unique combination of Fibonacci extensions and pivot points for price action traders.
This breakout trading tool is suitable for both trend following and swing trading strategies. Indicators such as moving averages, stochastics and RSI are well suited for this
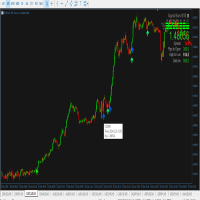
Dynamic Center of Gravity Indicator Revolutionary Price Action Trading System Harness the power of price momentum with the Dynamic Center of Gravity indicator - an advanced price action trading tool designed for serious traders. This innovative indicator identifies powerful gravity zones that attract rapid price movements, creating high-probability trading opportunities when momentum breaks free from these zones. Key Features Pure price action analysis - no lagging indicators Works effectively a
The Hybrid Trend Impulse indicator is an advanced tool that combines modern approaches to trend and impulse analysis, offering unique capabilities for effective deposit management. Key advantages of the HybridTrendImpulse_indicator: Nonlinear dynamics: The method of interaction between opening prices forms a unique nonlinear model that is particularly sensitive to significant price fluctuations, increasing their significance and making the indicator ideal for working in high volatility conditio

The Opportunity System: Forex Gold Indicator The Opportunity System is a powerful and intuitive Forex Gold Indicator designed to help traders identify prime entry and exit points for trading gold (XAU/USD). This advanced indicator combines the strengths of two of the most popular technical analysis tools – the Stochastic Oscillator and the MACD (Moving Average Convergence Divergence) – to provide precise, real-time insights into market trends and potential reversals. Key Features: Stochastic Osc

Arrow indicator for forex trading using scalping strategy on popular currency pairs, bitcoin, gold, on m1 timeframe and others. The indicator has entry point settings, trend settings for higher timeframes, and various indicator filters, it is also possible to set up time trading intervals for yourself, in which you will receive signal arrows above the candles, as well as pop-up windows with alerts, or notifications on your phone via ID. The settings are simple, the strategy is ready, new sets an
Basic information. To perform its work, the indicator takes data on volumes from a lower timeframe, builds Market Profiles for a higher timeframe and a histogram for the current timeframe. The indicator starts in several stages. In this case, messages like: "Build Source & Target TF. Step: …" are output to the log. The process can be accelerated by changing the input parameter Milliseconds between steps - the initialization speed. The final value of this parameter is always individual and is set

MACD Classic: Moving Average Convergence/Divergence Indicator for MT5 Designed for advanced traders seeking precision and adaptability in their trading strategies. The MACD Classic is a custom technical indicator developed with MQL5 for MetaTrader 5 , optimized to provide you with clear signals for moving average convergence and divergence , helping you identify trends and entry/exit points more efficiently. Key Features : Fast EMA (12) : Ideal for capturing fast market movements.
Slow EMA

Adaptive Trend Metrix Adaptive Trend Metrix is a fxtool for assessing the current state of the market that adapts to changes in volatility, helping to determine the direction and strength of the trend by taking into account price dynamics. One aspect of this strategy is its ability to change and use different parameters based on price behavior. For example, it takes into account the current market volatility to adjust sensitivity to price fluctuations and identify entry and exit points. Adaptiv
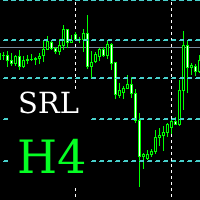
An indicator for determining and displaying support and resistance levels on the H4 chart over the past 180 days. The algorithm searches for local minima and maxima, filters levels to eliminate closely spaced values, and then visualizes them on a graph. Defining key levels Support levels: lows at which the price slowed down or reversed upward. Resistance levels: highs where the price had difficulty rising further.
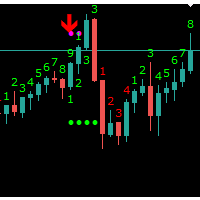
Indicator Sequential Through a multi-phase price comparative process consisting of the Setup and Countdown indicators, the Sequential indicator analyzes otherwise incongruent price data to provide insight into the strength or weakness of the market’s trend and its likelihood of reversing The Mechanics of Sequential We have the market's number The majority of the DeMARK Indicators are designed to anticipate price exhaustion as opposed to following the trend. Identifying likely inflection points

The GoldenBufferPattern indicator uses several indicator buffers (Candles+Fractals+ZigzagColor+ColorMaLine).
The indicator is recommended to be used together with other indicators or using the Martinheim Method. We use this method with this indicator, as well as some of our other proprietary filters and trading strategies in particular, in our Experts Advisors on ProfRoboTrading.

The Market Master is a comprehensive, all-in-one trading indicator designed to enhance your trading strategy
Features:
Trend Filter VWAP Break Of Structure patterns Daily, Weekly, Monthly highs/lows Fractals Channels Volume Profile Currency Strength Meter Fair Value Gap News Filter
The idea behind this indicator was to create a trading tool that has everything a trader needs
r-Trend Sync indicator is manual trading system for extra volatility markets. Main System features : The indicators's algorithm is based on the analysis of an extensive array of historical data (from 1995 for EURUSD & EURJPY and from 2004 for XAUUSD), which ensured the identification of general patterns in the behavior of these pairs across a wide range of timeframes. The analysis of historical data helped the system learn to recognize market triggers for medium-term trends and cycles, as well a

Session Liquidity is the most anticipated trading strategy among the ICT trader. With this indicator you could frame the trade by simply deploying it on the chart. By simply inputting the Asian Opening Time, New York Opening Time, and choose the color option and display option you like then you will get the session laid down for you on the chart. You can choose between showing session as box or horizontal line. I personally trade this strategies for quite sometimes.
The KT Range Filter Buy and Sell simplifies minor price movements and fluctuations, transforming them into a smoother, more defined trend. While QQE smoothing is typically applied to RSI, It applies the concept directly to price, offering a unique and effective approach to market analysis.
It features a three-band structure, consisting of a main averaging line flanked by an upper and a lower band. These bands are calculated using a range multiplier, providing a clear visual representation of p
SynRhythmic Points Oscillator is an innovative manual trading system based on the combination of two analytical approaches, one focusing on short-term price changes and the other on identifying stable trends and dependencies. This synergy allows for obtaining excellent signals for entering the market while minimizing the influence of random fluctuations and reducing false signals. Additionally, the indicator can easily adapt to various market conditions and be automated, making it convenient for

Introducing our advanced Indicator, a groundbreaking tool for identifying support and resistance zones with unmatched precision. Elevate your trading strategy with a host of features, including a dual-color upper and lower box system that allows for easy visual recognition of market trends.
Key Features: Dual-Color Box for the Support and Resistance Zones Customize your analysis with dual-color box. The upper and lower boxes offer distinct colors, providing a clear visual representation of supp
The KT Dynamic Price Oscillator (DPO) offers a specialized approach to analyzing the trend, momentum, and volatility of financial instruments. It excels at identifying trend continuations, overbought or oversold conditions, and potential reversal points with precision. It is specifically designed to assist traders in identifying short-term price cycles and potential reversals by effectively filtering out long-term trends.
How to use the DPO
Trend Confirmation: The DPO acts as a reliable confir

The Matrix Series indicator analyzes price action, moving averages, and volatility to detect trending conditions. Bullish Trend: Green zones or upward signals indicate a strong uptrend, ideal for long positions. Bearish Trend: Red zones or downward signals suggest a downtrend, perfect for short positions. Sideways/Neutral Market: Non-highlighted or gray zones show periods of market consolidation or low momentum, helping you avoid false signals. Use Cases: Trend Confirmation: Use the indicator to

As an ICT or SMC trader you must do top-down analysis, and you struggle to make template of drawing object on Metatrader just like you normally do on Tradingview. Well, Drawing Assistance indicator will make your top-down analysis much easier on Metatrader. Allow to design template for 3 timeframes. (HTF, MTF and LTF). Each objects drawn on chart will have the color, style and visibility individually by the timeframe it was drawn on. Save time as all analyzing is done on Metatrader chart. Shortc

Fibo Extrema Bands is a unique indicator that visually demonstrates when the market shifts into a trend and highlights key levels acting as support or resistance. It combines easy-to-read “stepped” extrema lines with Fibonacci levels (whose values can be adjusted in the indicator’s inputs), simplifying the search for entry and exit points. Install Fibo Extrema Bands to gain a powerful tool for trend analysis and for identifying critical price levels! This product is also available for MetaTrade

The Extreme Spike PRT Indicator is an effective tool for identifying sharp market fluctuations . It performs its calculations using the ATR (Average True Range) indicator and displays candles with extreme volatility in two categories: primary spikes and secondary spikes , within the Metatrader platform oscillator window. This tool assists traders in detecting intense price movements and conducting more precise analyses based on these fluctuations. Time Frame 15-minute - 1-hou

Summary
This indicator plots multiple pivot points (support and resistance levels) using various calculation methods, allows customization of their appearance, and can alert when price touches these levels. It works on different timeframes and can display historical levels or just the current ones.
Overview Purpose : Plots dynamic pivot levels (Pivot, S1-S4, R1-R4) on the chart to help identify potential price reversal zones. Key Features : Supports 7 calculation methods (Classic, Camarilla

ATR Power Levels Smart Support Resistance Indicator! What makes this indicator unique?
Unlike traditional support & resistance tools, ATR Dynamic Zones uses Adaptive ATR calculations to detect peaks & valleys with extreme accuracy. Once price breaks above or below a key level, the zone is automatically converted into a buy or sell area , giving traders a clear roadmap for smart entries & exits. How It Works:
Detects peaks & valleys dynamically using ATR-based price movement
Highli
Volonacci Indicator It is an indicator that combines Fibonacci and volume to determine the price direction This indicator helps you identify Fibonacci angles according to the strategy The Volonacci indicator is indeed an interesting combination of Fibonacci levels and volume. This indicator uses Fibonacci tools to identify potential support and resistance levels, and enhances this by using volume to confirm the strength behind the price action.
MT4 Version https://www.mql5.com/en/market/produ
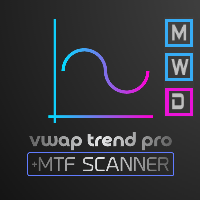
VWAP Trend Pro (Volume Weighted Average Price) is a versatile trading tool that can be used effectively in several ways: This is an advanced Volume Weighted Average Price indicator that revolutionizes your trading experience by dynamically changing colors across scanned timeframes, providing real-time trend insights. The intuitive right corner scanner with three simple squares represents Monthly, Weekly, and Daily trends, each bordered by the current trend color and with background color indicat
The indicator generates entry signals for BINARY OPTIONS OR FOREX SCALPING, normally on the chart you see an arrow that can appear or disappear on the last candle, this is normal: the indicator is processing the data, and reads the conditions to send an entry signal. The conditions vary every second for this reason the signal appears and disappears. THIS IS PRACTICALLY A WARNING FOR THE TRADER TO BE READY because the conditions for a possible entry are forming. At the close of the candle, IF TH

very simple indicator to help with fast risk management during volatility.
~Displays: - stop loss in points of your choice. - take profit in points of your choice. - what lot size to risk on the trade relative percentage.
~Values that can be changed: - take profit points. - stop loss points. - risk in percentage. - color of lines. - width of lines. - linestyle. - buy / sell trade.

GammaLevels Indicator! What makes this indicator unique?
Unlike traditional support & resistance tools, ATR Dynamic Zones uses Adaptive ATR calculations to detect peaks & valleys with extreme accuracy. Once price breaks above or below a key level, the zone is automatically converted into a buy or sell area , giving traders a clear roadmap for smart entries & exits. How It Works:
Detects peaks & valleys dynamically using ATR-based price movement
Highlig
MetaTrader Market - trading robots and technical indicators for traders are available right in your trading terminal.
The MQL5.community payment system is available to all registered users of the MQL5.com site for transactions on MetaTrader Services. You can deposit and withdraw money using WebMoney, PayPal or a bank card.
You are missing trading opportunities:
- Free trading apps
- Over 8,000 signals for copying
- Economic news for exploring financial markets
Registration
Log in
If you do not have an account, please register
Allow the use of cookies to log in to the MQL5.com website.
Please enable the necessary setting in your browser, otherwise you will not be able to log in.