Watch the Market tutorial videos on YouTube
How to buy а trading robot or an indicator
Run your EA on
virtual hosting
virtual hosting
Test аn indicator/trading robot before buying
Want to earn in the Market?
How to present a product for a sell-through
Free Technical Indicators for MetaTrader 5 - 9

High Low Swing (HLS) Indicator
The HLS indicator is a technical analysis tool designed to identify swing highs and lows in the market, aiding swing traders in making informed decisions. It offers an adjustable "degree" parameter, allowing you to customize the sensitivity to strong price movements based on current market conditions.
Features:
• Clear Buy/Sell Signals: The indicator plots signals directly on the chart, simplifying trade identification.
• Adjustable Swing Strength: The "degr
FREE
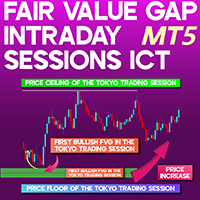
Intraday Fair Value Gap Sessions ICT Indicator for MT5 The Intraday FVG Sessions Indicator is a powerful analytical tool designed to help traders spot Fair Value Gaps (FVGs) within the New York, London, and Tokyo trading sessions. This indicator automatically highlights the high and low levels of each session using horizontal markers while identifying the first Fair Value Gap that appears within these timeframes. By differentiating between bullish and bearish Fair Value Gaps , this tool aids tra
FREE
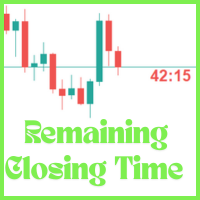
The Candle Remaining Closing Time indicator displays the amount of time left before the current candlestick closes on your chart. This tool is essential for traders who rely on precise timing to enter or exit trades, especially in fast-moving markets. By showing a real-time countdown, it helps you stay aware of upcoming candle completions across any timeframe—from 1-minute to daily charts. Whether you're a scalper watching minute-by-minute action or a swing trader timing key setups on higher tim
FREE

Overview: The US Dollar Index (DXY) is a key financial indicator that measures the strength of the US Dollar against a basket of six major world currencies. This index is crucial for traders and investors as it provides a comprehensive view of the overall market sentiment towards the US Dollar and its relative performance. All Products | Contact Composition: The DXY's composition is as follows: Euro (EUR): 57.6% Japanese Yen (JPY): 13.6% British Pound (GBP): 11.9% Canadian Dollar (CAD): 9.1%
FREE

Welcome to HiperCube Renko Candles Discount code for 25% off at Darwinex Zero: DWZ2328770MGM This indicator provide you a real info of market transform it to Renko Candle Style. Definition Renko charts are a type of financial chart that measures and plots price changes, using bricks (or bars) to represent price movements . Unlike traditional candlestick charts, Renko charts do not display time-based information, focusing solely on price fluctuations. Features: Indicator in separate windows
FREE

Schaff Trend Cycle (STC) "CON ALERTAS"
El Indicador Schaff Trend Cycle (STC) es una herramienta técnica utilizada en el trading e inversión para identificar tendencias y generar señales de compra o venta. ¿Qué es el Schaff Trend Cycle? El STC fue desarrollado por Doug Schaff para mejorar las medias móviles incorporando análisis de ciclos. Su objetivo es identificar tendencias y cambios de tendencia midiendo la fuerza y velocidad de los cambios de precio. Es un oscilador que mide la velocidad
FREE
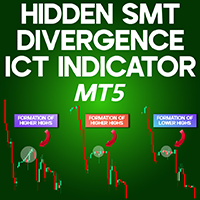
Hidden SMT Divergence Indicator for MT5 The Hidden SMT Divergence Indicator is designed to uncover subtle market imbalances between three stock indices.
Using liquidity dynamics and Smart Money principles, this indicator assesses strength variations across correlated assets. When these instruments diverge in movement, it often suggests a potential trend shift. Hidden Smart Money Divergence Indicator Specifications Below is an outline of the key features of the Hidden SMT Divergence Indicator :
FREE

Finally a Metatrader version of the very popular (and expensive) Market Cipher B indicator, or the Vumanchu Cipher B + Divergences very popular on Tradingview platform.
This tool is very heavy on calculations, total are 31 plots using 97 buffers from several indicators. On my mid end computer, timeframes below M15 start getting a bit laggy, so it would require a powerful computer to run it properly at very low timeframes. It's still usable here, but somewhat sluggish response in Metatrader (lik
FREE

John Bollinger created this indicator in 2010 as a way to read the original indicator (Bollinger Bands) in a more "technical" way, shown as an oscillator. The typical range of the Bollinger Bands %B is 0 - 0.5 - 1.0, where "0" represents the lower band, the "0.5" the middle band, and "1" the upper band. The line on the indicator represents the Closing prices. As simple as that.
SETTINGS
Bollinger Bands period of analysis Standard Deviation multiplier Shift Price type to be analyzed
If you like
FREE
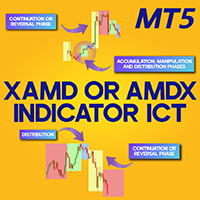
XAMD/AMDX Indicator ICT MT5
The XAMD/AMDX Indicator , built upon the ICT trading framework, assists traders in recognizing potential trend shifts within the market. This liquidity-based tool for MetaTrader 5 organizes price action into three primary stages: Accumulation, Manipulation, and Distribution , which are visually marked using distinct color-coded boxes. A fourth stage, Continuation or Reversal (X) , distinguishes the XAMD/AMDX Cycle Indicator from the standard AMD ICT Indicator on the
FREE

Gold TL MTF - this is a fine stock technical indicator. The indicator algorithm analyzes the movement of the asset price and reflects trend lines along the fractals of a specific timeframe (TF).
Benefits of the indicator: The indicator produces signals with high accuracy. The confirmed signal of the indicator does not disappear and is not redrawn. You can trade on the MetaTrader 5 trading platform of any broker. You can trade any assets (currencies, metals, cryptocurrencies, stocks, indices e
FREE

This indicator is the mql version of the Smoothed Heiken Ashi Candles. Heikin-Ashi charts resemble candlestick charts , but have a smoother appearance as they track a range of price movements, rather than tracking every price movement as with candlesticks.
Because the Heikin Ashi candlesticks are calculated based on averages, the candlesticks will have smaller shadows than a regular Japanese candlestick. Just like with regular Japanese candlesticks, with a Heikin Ashi candlestick, the sm
FREE

We often need to know the sudden change in trend that happens on the graph and this can be confirmed through indicators.
This indicator shows the moments of trend reversal and how in which trend the price is shifting.
Custom background, no need to configure the colors in the chart, just drag the indicator!
Indication with arrows.
- Blue arrow: Upward trend.
- Pink Arrow: Downward Trend.
NOTE: Free indicator, support may take a while to respond.
FREE

Tabajara Rules for MT5 , baseado em Setup Tabajara do professor André Machado, indica a direção do mercado com base em médias móveis quando tem velas na mesma direção da média móvel.
O indicador contém a regra de coloração aplicada aos candles e a média móvel.
O indicador permite a alteração dos parâmetros: período e método de suavização da média móvel.
O indicador permite a alteração das cores dos candles ( contornos e preenchimento) e da média móvel.
O modelo do professor André Machado conté
FREE

Supply and Demand indicator does not repaint as it counts the number of tests/retests occurred in the past x number of times. As a trader you need a path to be able to place your buy and sell trades such as: Supply and Demand, Falling & raising channels . Experienced trades will draw the key levels and channels around the timeframes. But, they will not be able to draw them on the small time frames as the price changes too frequent. This indicator is based on Shved supply and demand indicator, b
FREE
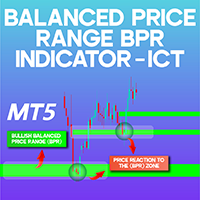
Balanced Price Range BPR Indicator ICT MT5 The Balanced Price Range BPR Indicator ICT MT5 is a specialized tool within the ICT trading framework in MetaTrader 5. This indicator detects the overlap between two Fair Value Gaps (FVG), helping traders identify key price reaction areas. It visually differentiates market zones by marking bearish BPRs in brown and bullish BPRs in green, offering valuable insights into market movements. Balanced Price Range Indicator Overview The table below outlines
FREE
Indicador com regra de coloração para estratégias que utilizam Inside Bar! Quando rompe a barra inside, se for para cima, compra e posiciona o stop loss na mínima da barra inside. Se romper para baixo, vende e posiciona o stop loss na máxima da barra inside. Pode ser aliada a tendências de outros tempos gráficos e outros filtros.
Grupo de sinais gratuito no telegram: https://t.me/InsideBarRST
FREE

This is a non-parametric ZigZag providing 4 different methods of calculation. Upward edge continues on new bars while their `highs` are above highest `low` among previous bars, downward edge continues on next bars while their `lows` are below lowest `high` among previous; Gann swing: upward edge continues while `highs` and `lows` are higher than on the left adjacent bar, downward edge continues while `highs` and `lows` are lower than on the left adjacent bar. Inside bars (with lower `high` and
FREE

Relative Volume or RVOL is an indicator that averages the volume of X amount of days, making it easy to compare sessions volumes.
The histogram only has 3 colors:
Green - Above average volume
Yellow - Average volume
Red - Below average volume
The default setting is 20 days, which corresponds more or less to a month of trading.
In this version is possible to choose between tick and real volumes (if you are using a broker which offers future contracts)
With the data obtained from this in
FREE
Darvas Flow Indicator is a revolutionary trading indicator that combines the classic Darvas Box method with modern market flow analysis. Developed for serious traders, Darvas Flow offers a powerful and intuitive tool for identifying trading opportunities. Key Features:
Darvas Box Method Implementation: Darvas Flow automatically identifies Darvas boxes, allowing you to see crucial support and resistance levels. This helps in pinpointing optimal entry and exit points in your trades. Dynamic Flow
FREE

Local Time Scale Overlay is a technical indicator for MetaTrader 5 that enhances chart readability by overlaying a local time scale on the trading chart. It calculates the difference between your local system time and the server time and uses this difference to display time labels that reflect your local time at predefined intervals. The time interval is customizable via a drop‐down menu with options such as 5, 10, 15, 20, 30, 60, 120, and 480 minutes (with 15 minutes as the default).
Key Featu
FREE

The Indicator show Daily Pivot Points. It is possible to specify the number of days to display. For forex it doesn't consider the sunday session data. It is possibile to modify the color, style and width for every level. It is better to use this indicator with timeframe not higher than Н1. 4 Levels of support and resistance with also Intermediate Levels that is possible to hide.
FREE

Overlay indicator on chart between 2 pairs
The Timeframe Overlay indicator displays the price action of timeframes on a single chart, allowing you to quickly assess different timeframes from a single chart. The advantage is to observe and follow the correlations of price movements in real time to help you find potential trades at a glance.
---- Symbol 1 ----
Symbol = EURUSD
Correlation Inverse = false
Display = true
Ratio
FREE
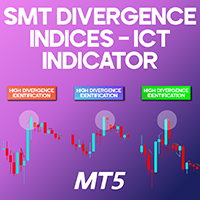
SMT Divergence Indices ICT Indicator MT5 The SMT Divergence Indices ICT Indicator MT5 is a specialized trading tool within the ICT methodology for MetaTrader 5. It assists traders in identifying three primary types of divergences across major stock indices. This indicator is particularly useful in spotting trendline divergences, higher-low divergences, and smart money divergences , providing traders with valuable insights into potential market reversals. «Indicator Installation & User Guide» MT5
FREE
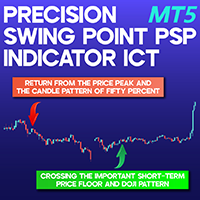
Precision Swing Point Indicator PSP ICT Quarterly Theory MT5 The Precision Swing Point Indicator PSP ICT Quarterly Theory MT5 is designed to detect key market turning points by analyzing price swings in MetaTrader 5. By filtering market fluctuations, this tool helps traders gain clearer insights and more precise trading signals. As a specialized Pivot Point and Fractal indicator, it enhances market analysis with high accuracy. Precision Swing Point Specifications Table The following table outl
FREE

This indicator is based on the famous fractal indicator but with much customization and flexibility ,
this is a powerful tool for identifying trend reversals and maximizing your profit potential.
With its advanced features and user-friendly interface, it's the ultimate choice for traders of all levels. MT4 Version : Ultimate Fractals MT4 Features :
Customizable Fractal Candle count. Reversal Lines. Customizable Settings. User-Friendly Interface. Main Parameters: Candles On Left - number
FREE

This indicator is based on Bollinger Bands and moving averages, and uses ADX to get the turning point of the market trend and display a sign.
It is basically intended for use with currency pairs and futures with high volatility. In our tests we use it on XAUUSD, 5m and 15m. Win rate is more than 80% with 50 pips stop loss and 50 pips gain or more.
The indicator is also a simple indicator that allows you to enable or disable alerts and change the color of the arrows from the indicator settings
FREE

RoundNumbers indicator is a simple and powerful psychological price levels. Trader usually use these levels as a Support and Resistance (SnR). Indicator Input: Levels - Numbers of levels drawn on chart. Default 30 levels. BoxSize - Box size drawn on each levels, indicate buffers around levels. Default value 1pips (10point) above and below each levels. ZoneSize - Distance between each levels, default value 10pips (100point). Style & Colours - User inputs customization. For MT4 version, p
FREE

This indicator is based on the Parabolic SAR indicator. It helps the user identifying whether to buy or sell. It comes with an alert that will sound whenever a new signal appears. It also features an email facility. Your email address and SMTP Server settings should be specified in the settings window of the "Mailbox" tab in your MetaTrader 5. Blue arrow up = Buy. Red arrow down = Sell. Line = Trailing Stop. You can use one of my Trailing Stop products that automatically move the Stop Loss and i
FREE

Introducing the Quasimodo Genie, a powerful indicator for MetaTrader 5 that automatically identifies the Quasimodo or Over and Under pattern. This indicator is perfect for traders who want to take advantage of this popular chart pattern and make profitable trades. With the Quasimodo Genie, you can easily find the best swing points for the Quasimodo pattern and place virtual trades with stop loss and take profit levels. The Quasimodo Genie is easy to use and comes with a range of customizable set
FREE
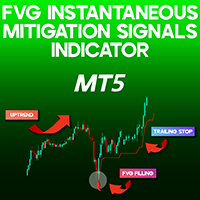
FVG Instantaneous Mitigation Signals ICT MT5 The " FVG Instantaneous Mitigation Signals " indicator for MetaTrader 5 is specifically designed to detect and highlight fair value gaps (FVGs) that are quickly mitigated. Once an FVG is identified using arrow markers, the indicator automatically plots a red Trailing Stop line on the price chart. FVG Instantaneous Mitigation Signals Indicator Specifications Below is a breakdown of the key specifications and functionalities of the "FVG Rapid Mitigati
FREE
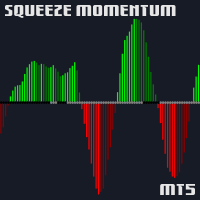
This is the Squeeze Momentum Indicator from TradingView by LazyBear ported to mql5. Is the same logic and plotting.
Interpreting the Indicator: Detecting a Squeeze: Look at the separate line’s color. If it indicates a squeeze (often shown as one distinct color), it means price is currently consolidating and volatility is low. This is a time to watch carefully for upcoming breakouts. When the Squeeze Fires: Once the indicator switches from the “Squeeze On” color to the “No Squeeze” or “Squeeze O
FREE

The HammerStar indicator is designed to search for the Hammer and Shooting Star patterns on charts of any currency pairs.
Hammer Downward trend.
The lower shadow is not less than 2 and no more than 3 times larger than the body.
There is no upper shadow, or it is very short (no more than 10% of the candlestick range).
The color of the body in the long game is not important, with the short - white hammer is much stronger than the black one.
Confirmation is suggested.
Shooting Star Uptrend.
The u
FREE

Highly configurable Moving average indicator.
Features: Highly customizable alert functions (at levels, crosses, direction changes via email, push, sound, popup) Multi timeframe ability Color customization (at levels, crosses, direction changes) Linear interpolation option Works on strategy tester in multi timeframe mode (at weekend without ticks also) Parameters:
MA Timeframe: You can set the lower/higher timeframes for Ma. MA Bar Shift: Y ou can set the offset of the line drawing. MA Period,
FREE
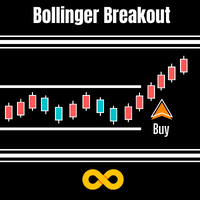
Bollinger Breakout Trader tells the trader when the market is about to breakout from a non-volatile period. Non volatility usually means its building up steam for more good moves in future. A signal is formed when this switch from non-volatile to volatile occurs. These periods are measured by both Bollinger Bands and Keltner Channels. Bollinger Bands measure the standard deviation of price from the Moving Average which results in an expanding and contracting channel. Keltner Channels are based
FREE

The Spider ZIGZAG is an algorithm to determine how critical the current peak is by spreading several lines with different parameters instead of one line between each 2 peaks. 1. The more zigzag's lines meet at a peak the higher probability the market will go for correction or change direction. 2. Usually when 3-4 zigzag's lines meet at a peak, the market enters a correction period, this don't happen instantly, it might take some time. 3. Usually when 5-6 zigzag's lines meet at a peak, th
FREE
The Channel Sgnals ProfRoboTrading Indicator for MT5 is an effective Forex trading tool designed to track market movements. The MT5 signal point indicator effectively detects trend reversals after they have already occurred. This Indicator is a fully automated technical tool that includes a number of parameters to track market trends. It automatically examines the ever-changing price dynamics of the market, compares the information with earlier data and generates a trading signal. Because
FREE

Pivot Point Super trend it can be used to catch price turning points and can show arrows for buying and selling. calculations are based on price peaks . you can control the price turning points by increasing the Pivot point period input on the indicator the ATR factor is for how far apart do you want the bands to be spread apart price break outs are also spotted in their early stages which will make trading much better
FREE

RS Zone is an Indicator used to plot the support and resistance levels of each asset. and each time period as we determine The principle for calculating support and resistance levels is based on the price range (Range SR) to see if there are points where the price repeatedly reverses at that price level or not. The total pot will be equal to the Total SR that we set. Example If Range SR is equal to 120, the system will choose to look at data going back 120 candlesticks to find whether there is a
FREE
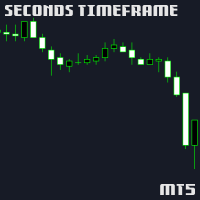
This is an extension indicator that allows the user to select any second time-frame from 1 to 60 second without any multiplier limitaion (ex, 7 seconds, 13 seconds ... are all allowed).
There is only one input called Interval that allows you to set the seconds timeframe you want given is in the range above. You can use indicators on that new time frame with no problems and also build your EAs based on any second timeframe. I hope this is useful, please let me know any bugs you find!
Note: Since
FREE
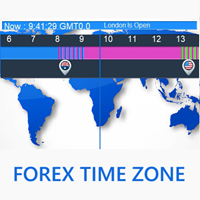
Short Introduction to Forex Time Zone Welcome to a new free professional tool— Forex Time Zone . Pro traders understand how important time is in forex trading. Every second, some markets around the world open while others close, impacting market volatility and influencing the movement of individual currencies. This tool helps traders easily identify which market is open right now and the current time zone. Free Live Signal On Telegram Channel, Join Now And Get Live Signals Every Day , Live sign
FREE

Description: Strategy based around Open-Close Crossovers. Setup: I have generally found that setting the strategy resolution to 3-4x that of the chart you are viewing tends to yield the best results, regardless of which MA option you may choose (if any) BUT can cause a lot of false positives - be aware of this. Don't aim for perfection. Just aim to get a reasonably snug fit with the O-C band, with good runs of green && red. Option to either use basic open && close series data or pick your pois
FREE

Previous Candle Levels MT5 shows the previous candle levels, it shows the previous candle Open High Low Close levels (OHLC Levels) in different time frame. It's designed to help the trader to analyse the market and pay attention to the previous candle levels in different time frame. We all know that the OHLC Levels in Monthly, Weekly and Daily are really strong and must of the time, the price strongly reacts at those levels. In the technical analysis, the user can use them as a support and res
FREE

Like most things that work in trading, it's really simple. However, it's one of the most powerful tools I have that makes entries of many systems much more precise.
In its essence, it measures the recent volatility against the medium-term average. How does it work? Markets tend to be prone to strong trending movements when relative volatility is low and tend to be mean-reverting when relative volatility is high.
It can be used with both mean-reversion systems (like the Golden Pickaxe) and mo
FREE

Account Dashboard Statistics
It is a tool that will help you have a focused view in order to know the profits and losses of your account , so you can keep track of it, it also brings a drawdown analysis to know the risk obtained as well After downloading and activating it in your account, you must attach it to any symbol for example EURUSD H1, then from this moment the tool will start to monitor your statistics, you can see my other free products here Mql5
the panel is completely advanced,
FREE

TK - Rainbow Indicator Description: The TK - Rainbow indicator is a robust tool for technical analysis, designed to provide a clear view of market trends through a multi-line approach. With 30 lines calculated at different periods, it offers an extensive analysis of price movements. The indicator uses a dual-color scheme to highlight upward and downward trends, making it easy to interpret market conditions at a glance. Key Features: 30 Lines: Each line represents a different smoothing period to
FREE

This indicator calculates fibonacci levels via moving averages trend and draw these lines. You can change fast and slow Moving Averages settings for customization. Inputs:
Fast MA Time Period : 64 Fast MA Shift: 0 Fast MA Method: Smoothed Fast MA Apply To: Median Price Slow MA Time Period: 32 Slow MA Shift: 0 Slow MA Method: Smoothed Slow MA Apply To: Median Price ZigZag: False ZigZag Color: Red ZigZag Type: DashDot ZigZag Width: VeryThin Fibo Settings TrendFibonacci: True FiboTrendColor: Black
FREE

The Hi Lo Breakout is taken from the concept of the ZZ Scalper EA which exploits the inevitable behaviour of price fluctuations and breakouts. The fact that because market prices will always fluctuate to higher highs before ebbing down to lower lows, breakouts will occur.
But here I've added a few more filters which I see work well also as an Indicator.
Range Analysis : When price is within a tight range this Indicator will be able to spot this and only then look for price breaks. You
FREE

The "Rejection Block" MetaTrader 5 Indicator offers traders a comprehensive tool for identifying and visualizing rejection candlestick patterns, commonly known as rejection blocks. These patterns are pivotal in discerning potential market reversals or continuations, making them invaluable for traders seeking to enhance their analysis. Key Features: Rejection Block Detection: The indicator diligently scans price data, pinpointing instances of rejection candlestick patterns. These patterns typical
FREE
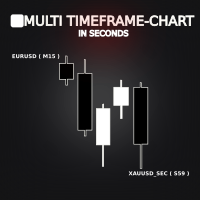
Multi Timeframe Chart in Seconds indicator allows users to visualize multiple timeframes or multiple symbols on a single chart. Instead of creating and opening a new custom chart with a different name, this indicator creates a custom chart and displays it on chart's main window, or the user can create multiple windows on the same chart using one indicator. This indicator serves the same purpose as custom charts for seconds, but the main purpose is to visualize multiple timeframes or symbols, fo
FREE

Hull Moving Average is more sensitive to the current price activity than a traditional Moving Average. It faster responds to trend change and more shows the price movement more accurately. This is a color version of the indicator. This indicator has been developed based in the original version created by Sergey <wizardserg@mail.ru>. Suitable for all timeframes.
Parameters Period - smoothing period, recommended values are 9 to 64. The larger the period, the softer the light. Method - smoothing m
FREE
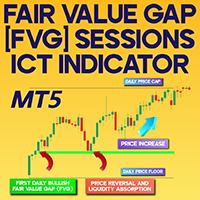
Fair Value Gap FVG Sessions ICT Indicator for MT5 The Fair Value Gap (FVG) Sessions Indicator for MetaTrader 5 streamlines the detection of price gaps that arise during trading sessions. This tool is designed to highlight market inefficiencies, marking bullish FVGs in green and bearish FVGs in orange . These zones often act as crucial support and resistance levels , assisting traders in spotting potential trade entry and exit points. Fair Value Gap Indicator Features The following table outlin
FREE

Probability emerges to record higher prices when RVi breaks out oscillator historical resistance level. It's strongly encouraged to confirm price breakout with oscillator breakout since they have comparable effects to price breaking support and resistance levels; surely, short trades will have the same perception. As advantage, a lot of times oscillator breakout precedes price breakout as early alert to upcoming event as illustrated by last screenshot. Furthermore, divergence is confirmed in
FREE

FusionAlert StochRSI Master is an indicator available for MT4/MT5 platforms, it is a combination of RSI & Stochastic indicator which provide "alerts" when the market is inside "overbought and oversold" regions combined for both indicators, results in more precise and accurate signals to be used as a wonderful tool, in the form of "buy or sell" signals. This indicator comes with many customization options mentioned in the parameter section below, user can customise these parameters as needful. Jo
FREE
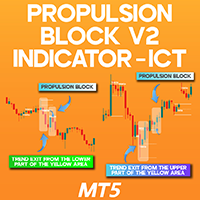
Propulsion Block V2 Indicator ICT MT5 The Propulsion Block V2 Indicator ICT MT5 is built upon the ICT trading methodology, allowing traders to identify key Propulsion Blocks that are often overlooked. This tool highlights these blocks using arrow markers on the price chart, marking areas where institutional investors and large market players establish or reinforce their positions. Due to the significance of these zones, experienced traders leverage them for strategic trade entries. Indicator S
FREE

This indicator show Gann Swing Chart (One Bar) with multi layer wave. 1. Wave layer F1: Gann waves are drawn based on candles. SGann wave(Swing of Gann) is drawn based on Gann wave of wave layer F1. 2. Wave layer F2: Is a Gann wave drawn based on the SGann wave of wave layer F1. SGann waves are drawn based on Gann waves of wave layer F2. 3. Wave layer F3: Is a Gann wave drawn based on the SGann wave of wave layer F2. SGann waves are drawn based on Gann waves of wave layer F3. ---------Vi
FREE

Indicador gratuito para Metatrader 5 que muestra en pantalla una caja rectangular para cada una de las sesiones de mercado "Londres, New York y Tokio". Se puede establecer la zona horaria de forma automática o mediante un valor de offset. Parámetros de configuración para cada una de las sesiones. Visible / No visible Hora Inicial Hora Final Caja sólida o transparente. Estilo del borde de la caja. Grosor del borde de la caja. Color.
FREE
FVG Breakout Indicator The FVG Breakout Indicator is an advanced tool designed for traders who want to track key price levels and detect breakout zones while identifying Fair Value Gaps (FVG) on their charts. This indicator automatically plots the previous day’s high and low (PDH/PDL), tracks support and resistance levels, and signals breakouts. Additionally, it highlights bullish and bearish Fair Value Gaps, helping traders capitalize on premium and discount zones in the market. Key Features: P
FREE

Indicator Name: DualClockWithSignalTime.mq5 Description: The DualClockWithSignalTime is a custom MetaTrader 5 (MT5) indicator designed to display three pieces of real-time information directly on the chart: Broker Server Time Local Computer Time Last Signal Time (BUY/SELL) This indicator is helpful for traders who need to monitor both the broker's time and their own local time, ensuring better synchronization of trading actions. Additionally, it automatically detects and displays the latest BUY
FREE

This news assistant is designed to get the economic events needed by traders from the main publishing sources ,that publish news in real time based on terminal's Market Watch with various and easy filters.
Forex traders use macroeconomic indicators to make informed decisions about buying and selling currencies. For example, if a trader believes that the US economy is going to grow faster than the Japanese economy, they might buy the US dollar and sell the Japanese yen.
Features of this produc
FREE
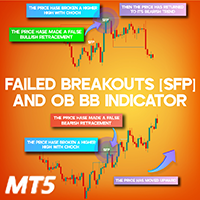
Swing Failure Pattern BB OB Indicator for MT5
The Swing Failure Pattern (SFP) indicator is a valuable tool in MetaTrader 5, designed to identify false breakouts and key market reversal points. This indicator provides a visual representation of significant price action events such as Break of Structure (BOS), Change of Character (CHoCH), and Fake Breakout (SFP). It is particularly useful for traders following price action strategies, ICT methodologies, and Smart Money trading concepts to pinpoin
FREE

When prices breakout resistance levels are combined with momentum oscillator breaks out its historical resistance levels then probability emerges to record farther higher prices. It's strongly encouraged to confirm price breakout with oscillator breakout since they have comparable effects to price breaking support and resistance levels; surely, short trades will have the same perception. Concept is based on find swing levels which based on number of bars by each side to confirm peak or trough
FREE
The Boom300 Spike Indicator is a powerful tool designed to identify significant price spikes in the market.
Key Features: Real-time Spike Detection: The indicator continuously scans the market for sudden spikes in price action, providing timely alerts when significant spikes occur. And recommend to use the 1Min chart Customizable Alerts: Traders can customize alerts to suit their preferences, including audible alerts, email notifications, and push notifications to mobile devices. User-Friendly
FREE

A heatmap is a graphical representation of data in two dimensions, using colors to display different factors. Heatmaps are a helpful visual aid for viewers, enabling the quick dissemination of statistical or data-driven information. The MP Heatmap indicator provides a graphical representation of the relative strengths of major currencies compared to others, organizing data from pairs into color-coded results and producing a clear overview of the entire Forex market. The MP Heatmap indicator dis
FREE

Excellent tracking performance and minimal noise! This trend detection indicator that avoids whipsaws and uncertain market noise and is also agile enough to react to changes in trend.
It is also designed to adapt to dynamic markets.
Functions mainly as a filter to help you trade in the direction of the trend.
Features.
Simple and easy to use. Low load and easy to try out The excellent tracking performance and smooth lines that make it ideal for market analysis Can be used as a trend filter for
FREE

Fair Value Gap (FVG) Indicator for MetaTrader 5
The Fair Value Gap (FVG) Indicator is an effective tool designed to spot trading opportunities in MetaTrader 5 by identifying imbalances in supply and demand. These imbalances, known as FVGs, emerge when the price moves aggressively. To explain simply, imagine three candlesticks: the gap between the first and third candlestick forms the " FVG ." This indicator highlights these gaps as dynamic boxes—green for bullish FVGs and red for bearish FVGs.
FREE
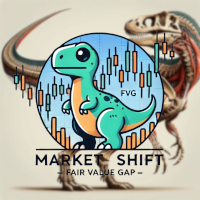
Market Structure Shift with FVG Indicator for MT5 This MT5 indicator from the apexfintech.net suite identifies market structure shifts and fair value gaps (FVGs) to provide traders with potential trading opportunities. It alerts users on these events via mobile notifications, enabling them to react quickly to changing market conditions. Key Features: Market Structure Shift Detection: Identifies bullish and bearish market structure shifts based on swing high/low breaks and significant candl
FREE
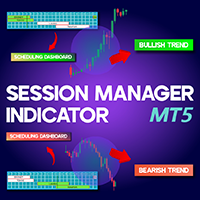
Session Manager Indicator MT5 Effective time management and understanding market activity are vital for traders in the fast-paced financial markets. Different trading symbols exhibit unique behaviors and levels of activity during specific time periods. The Session Time Manager indicator for MetaTrader 5 enables traders to monitor time and analyze price movements. This tool highlights key trading sessions—New York, London, Sydney, and Tokyo—by overlaying boxes on the price chart. «Indicator Insta
FREE
Simple SuperTrend indicator, similar to that of TradingView's.
Links:
All-In-One Supertrend Indicator MT4 Version
It has buffers for buy and sell signal, if you want to integrate this into an EA.
It helps traders easily identify trends by providing clear buy and sell signals based on price movements. Designed for simplicity, it’s easy to use and integrates well with various trading strategies, making it a great option for traders of all levels.
Happy trading!
FREE
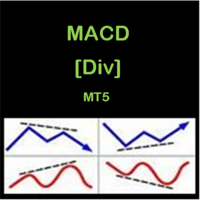
1. CONSTITUTION MACD [Div] MT5 is an indicator consisting of two oscillators (Main and Signal). This indicator draw arrows and lines in the main chart and subwindow chart according to the divergences detected. Using the inputs, we can: change the MACD values; change the colors of the divergence lines; enable and disable the alerts [poup up alerts and notification alerts]. enable or disable the drawing of divergence lines and arrows in the main chart or subwindow chart; 2. OPERATION CONDITIONS
FREE
The MetaTrader Market is the best place to sell trading robots and technical indicators.
You only need to develop an application for the MetaTrader platform with an attractive design and a good description. We will explain you how to publish your product on the Market to offer it to millions of MetaTrader users.
You are missing trading opportunities:
- Free trading apps
- Over 8,000 signals for copying
- Economic news for exploring financial markets
Registration
Log in
If you do not have an account, please register
Allow the use of cookies to log in to the MQL5.com website.
Please enable the necessary setting in your browser, otherwise you will not be able to log in.