Watch the Market tutorial videos on YouTube
How to buy а trading robot or an indicator
Run your EA on
virtual hosting
virtual hosting
Test аn indicator/trading robot before buying
Want to earn in the Market?
How to present a product for a sell-through
Expert Advisors and Indicators for MetaTrader 4 - 85

This script is a part of the Sounder_TopBottomLevels product which is intended to alarm the trader by sound when a Symbol's price goes above or below certain level(s). One of the product's features is a handy operation. You manage the levels by dragging lines on the chart with the mouse. Another feature is an optional Windows application which shows the chart that currently alarms the trader. And the sounds are customizable which may be useful for office with a number of the terminals running
FREE
Демо-версия утилиты ExactVol.exe Утилита ExactVol . ex 4 помогает трейдеру точно рассчитать размер лота и автоматически установить торговый ордер, исходя из входных значений и параметров ордера-указателя. Это необходимо для эффективного риск-менеджмента, когда нужно установить процент прибыли и процент риска на сделку в определенном соотношении, например 4:1. Предназначена для торговых стратегий, где используются уровни и линии поддержки/сопротивления. Ордер-указатель – ордер с минимальным о
FREE

How is your risk management?
How is your risk management? Check out this utility by tr1cky.com :
This utility simply closes all trades associated with the live symbol when your stop-loss or take-profit levels are breached/reached by a group of positions. This utility can be beneficial in several ways when applied to a group of positions: Aggregate Risk Management : By closing all trades associated with a live symbol when a stop-loss level is reached, it helps manage the aggregate risk across
FREE

The trading panel is designed to limit the risks of working advisors on one account, it is also possible to limit the risks of manually opened transactions.
The panel provides an opportunity for each advisor to select a part of the deposit in percentage or in the account currency that you can risk. When the specified values are reached, the trading panel will close the positions of this EA or deals opened manually.
You can set full account protection in percentage or account currency, under
FREE

This is a script for quick evaluation and selection of the most appropriate signals from the available database. The list can be sorted (ascending or descending) by the following criteria: Position in the Rating of Signals; The number of subscribers; Date of signal monitoring start; ROI (Return on Investment); Trading result in pips; Number of trades; Signal subscription price; Account balance; Account growth in percent; Maximum drawdown. Signals can be filtered by the following criteria: Accoun
FREE

Утилита предназначена для приёма котировок из терминала МТ5 и МТ4 и открытие оффлайн графиков для дальнейшего анализа. Котировки передаются по тем символам которые находятся в "Обзоре рынка" в терминале МТ5. Утилита служит исключительно для приёма котировок, не производит никаких торговых операций и не выводит ни какой информации на оффлайн графике. Передатчик котировок из МТ5: https://www.mql5.com/ru/market/product/41628 Для отображение оффлайн графиков нужно сделай всё по инструкции: 1. От
FREE

Virtual Exchange Reserve Equity Monitor In an environment where exchanges offer increasingly high leverage ratios, it is all the more important for traders to tightly regulate their level of equity . This software is designed to be run in the background on any virtual private server that can run Meta Trader 4/5. It implements basic equity control functions ahead of the broker---allowing users to set their own equity trailing stop, an equity limit to lock-in a certain profit margin, and a unive
FREE

The Scientific Calculator is a script designed to compute science, engineering and mathematics expressions.
General Description
The expression to calculate must obey syntax rules and precedence order, being constituted by the following elements: Integer and real numbers. Mathematical operators for addition (+), subtraction (-), multiplication (*), division (/) and exponentiation (^). Mathematical and trigonometric functions . Curved parentheses (()) to define the precedence and co
FREE

Open Popup Notification Please leave a review about this product to help other users benefit from it. " Free " Script to turn on pop-up notifications to view past trading alert messages including displaying account information. This script is compatible with MetaTrader 4 The script is easy to install and use, making it suitable for traders of all experience levels. There's nothing to worry about, including a freezing screen and any kind of effects on other chart windows. Disclaimer: This script
FREE

Demo is limited to the currency pair CADCHF. Full version: https://www.mql5.com/en/market/product/27237 Essentials for manual trading. The utility includes functions such as money management, automatic exits, hedging of positions, setting orders by date, OrderClose menu and others. Simple and clearly arranged, the tool works with one or more orders. Low tick rate compatible.
Features Display money management - right lot size is calculated from stoploss, account balance and risk appetite Schedu
FREE

The Order Selective Delete is a multi-symbol multi-timeframe script used to delete simultaneously various pending orders. General Description
The Order Selective Delete possesses three operation modes (Intersection, Union and All) that control the way as three pending order features (symbol, magic number and type) are used. The modes, available through the Selection Mode input parameter, relate to the features, available through the “Select by Feature” and “Feature” input pa
FREE

Indicator Profitability Check Introduction: IPC means "Indicator Profitability Check". Some features will be locked in free version. Also you cannot check result more than 1 month. For paid version, please visit: https://www.mql5.com/en/market/product/45247 Here Indicator Profitability Check is a custom script which will check the profitability of a buy-sell arrow based custom indicator’s signal profitability. So traders who are very confusing for a buy-sell arrow based custom signal indicato
FREE

Did you ever encounter a problem that your terminal failed to reestablish a connection and caused your EA to stop working? How much money did you lose because you were not aware of the connection error? Worry no more, I am here to present you a solution for your nightmare. This utility indicator sends a real time push notification or email when your terminal encounters a connection failure. You will be notified immediately even if your terminal is yet to establish a success connection to your br
FREE
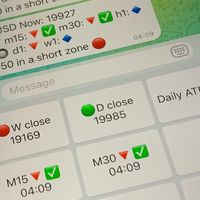
Did you know that additional telegram info panel will reduce your trade loosing? Today I was interested in completing a Telegram bot that shows the time of a confirmed exit from the overbought / oversold zones inside the buttons. Each button with timeframe will show where was used trade entry time signal. This happens at the close of the RSI period and also the closing of the bar in the opposite direction of the previous bar. There is also an indication of ATR level, Daily close price, Weekly c
FREE
With this utility, switching the object visibility for individual objects has never been easier. This will help eliminate the clutter that plagues MetaTrader 4 traders when they create objects and then go to a higher timeframe and see that the objects interfere with the visibility of the chart. The demo version of Visibility Switch only works on the EURUSD currency pair. The full version of Visibility Switch can be found here. By default, every new object created has its visibility set to the cu
FREE

Who will be interested in this product: those who are used to diversify the portfolio with a large number of pairs. those who work with a large number of orders those who trade news using pending orders (see the "Grid request" tab). The panel is designed to make managing a large number of orders as easy as managing one.
This is a lite version . GBPUSD, EURGBP and AUDUSD symbols are available.
"Trading" window "Request" tab The currency pairs and order types for opening are formed here. The pri
FREE

FastMove is a panel with 5 buttons, a notification area and a text entry. Its goal is to enable quick and simple execution. Buttons: MOVE - Move the interface BUY - Start of buy process SELL - Start of sell process L - Select quantity of lots % - Select quantity of percent of balance Areas: Notifications - This area displays notifications of the various states of the program and the commands sent. Text input - Here you enter the number of lots or the percentage of risk capital depending on the o
FREE
R E F R E S H 28 C H A R T S For traders who use a tool like "Volatility Watcher" and "OBOS Watcher" that use the 28 pairs of 8 commonly traded currencies.
You can find "Volatility Watcher" here: https://www.mql5.com/en/market/product/46475 You can find "OBOS Watcher" here: https://www.mql5.com/en/market/product/47894 8 C O M M O N L Y T R A D E D C U R R E N C I E S EUR - Euro GBP - British Pound AUD - Australian Dollar NZD - New Zealand Dollar USD
FREE

It can only be used in EURCHF / M15 . The Expert Advisor is a great tool that allows you to control your trade with ease and precision. The tool can be moved in the graphs and offers the following characteristics:
Instant order entry with a single click. Entry of pending orders using price tags and trend lines. Instant order closure with a single click. Instant order closure using trend lines as output levels that the broker can not see. We can modify the way to enter and exit the market, allow
FREE

Advisor Information: EG Connection Alert FREE every hour sends simple push notifications about the presence of a terminal connection to the server.
The utility will be useful to you if automated trading is carried out on a remote machine and there is no possibility to constantly check the operation of the terminal. Just install the adviser on any chart with any timeframe. You will receive notifications about the connection every hour. If no notifications are received, the terminal should be chec
FREE
SymbolAutoChanger MT4
There is also PRO version for MetaTreader5 There is also PRO version for MetaTreader4 This tool allows you to automatically change the chart symbols in a loop. Example: EUR → GBP → JPY → CHF → CAD → AUD → NZD You need only to set up interval in seconds between auto switch. Also, you can choose whether to switch between all symbols provided by your broker or only between symbols available in the Market Watch window. Demo version is limited to 4 symbols. Full version allows
FREE

Identify over 30 candlestick patterns with precision
This indicator recognizes over 30 Japanese Candlestick Patterns and highlights them beautifully on the chart. It is simply one of those indicators price action traders can't live without. [ Installation Guide | Update Guide | Troubleshooting | FAQ | All Products ]
Boost your technical analysis overnight Detect japanese candlestick patterns easily Trade reliable and universal reversal patterns Hop onto established trends safely using continua

The indicator detects the following types of Japanese candlesticks: Doji, Hammer and/or Hanging Man, Shooting Star and/or Inverted Hammer, Spinning Top, Maribozu. The indicator is intended for manual and/or automated trading within an Expert Advisor. There is a possibility to choose colors for bullish and bearish candlesticks. For automated trading, use any indicator buffer of the double type: 0, 1, 2 or 3, whose value is not zero!

The original Ilan EA for MetaTrader 4 This is the original Ilan EA for the MetaTrader 4 trading terminal. The strategy needs no advertising as it is well known even to novice traders.
Settings of the Expert Advisor The Expert Advisor can easily be set, while allowing you to adjust any important parameters of the strategy. Available Features: Unique MagicNumber for identification of trades; Trade direction option ( Trade direction ): buy only, sell only, or both directions simultaneously; Step

Overview The Expert Advisor sends notifications to a mobile phone, via e-mail or activates an audio alarm in case any changes are detected on the trading account: opening/closing positions, changing order parameters, balance or leverage. Also, the Expert Advisor can inform that Equity on the trading account has dropped below a specified value or Free Margin is small compared to Margin. The Expert does not trade, it only monitors your account.
Launching the Expert Advisor For the Expert Advisor

The indicator is intended for detecting big (long) and/or small (short) candlesticks. There is possibility of coloring the bullish and bearish candlesticks. The indicator can be used for manual and/or automated trading within an Expert Advisor. The indicator data that can be used for automated trading can be taken from one of four buffers of the double type: 0, 1, 2 or 3. Values must not be equal to zero.

The algorithm of this indicator is based on a high-performance digital filter. The unique digital filtering algorithm allows receiving timely trading signals and estimating the current situation objectively while conducting technical analysis. The indicator is effective on small and big timeframes. Unlike common classic indicators, digital filtering method can significantly reduce the phase lag, which in turn allows obtaining a clear signal earlier than when using other indicators.

The indicator of DeMark fractals. The indicator can be drawn on the basis of price data and on the basis of a moving average. There is a possibility to color the up and down fractals. The indicator can be used for manual and for automated trading within an Expert Advisor. For automated trading, use any indicator buffer of the double type: 0 - up fractals, 1 - down fractals! Values of the buffers must not be equal to zero. A moving average is drawn on the basis of input parameters: Calc_Method
We never know what market price will go on next second. That's why a trader needs to find a good way to have a good exit strategy. Quadro Multi Grid Scalper is a High Frequency Grid scalper using Dynamic Fibo Level, with only 3 maximum Opened order each cycle, will make less risk to your account. This EA uses Averaging exit system with changable martingale settings, and uses total profit target to closing all. Recommended Broker Parameters: Low spread less than 1 pip (you will have fast open an

Description A universal colored indicator Stochastic. The rising and falling lines and the levels of the indicator can be colored. The indicator can be calculated as the standard one on the basis of a price or as a derivative on the basis of the following nineteen other indicators included in the standard package of the MetaTrader 4 terminal: AD - an indicator of accumulation and distribution of volume. OBV - On Balance Volume. Volume - tick volume indicator. AC - indicator of acceleration. AO

Description A universal colored indicator MACD Histo. The rising and falling of the indicator histogram can be colored. The indicator can be calculated as the standard one on the basis of a price or as a derivative on the basis of the following twelve other indicators included in the standard package of the MetaTrader 4 terminal: AD - an indicator of accumulation and distribution of volume. OBV - On Balance Volume. Volume - tick volume indicator. Force - Force Index indicator. MFI - Money Flow

Description A colored universal indicator MACD Line (MA convergence-divergence indicator, shown as a histogram). The rising and falling of the indicator histogram can be colored. The indicator can be calculated as the standard one on the basis of a price or as a derivative on the basis of the following twelve other indicators included in the standard package of the MetaTrader 4 terminal: AD - an indicator of accumulation and distribution of volume. OBV - On Balance Volume. Volume - tick volume i

Effortless trading: non-repainting indicator for accurate price reversals This indicator detects price reversals in a zig-zag fashion, using only price action analysis and a donchian channel. It has been specifically designed for short-term trading, without repainting or backpainting at all. It is a fantastic tool for shrewd traders aiming to increase the timing of their operations. [ Installation Guide | Update Guide | Troubleshooting | FAQ | All Products ] Amazingly easy to trade It provides

Description A universal indicator RSI together with moving averages based on it. Depending on the need, moving averages can be disabled. You can color the indicator lines and levels: lines of RSI, moving average lines and thresholds of overbought and oversold levels. The indicator can be calculated as the standard one on the basis of a price or as a derivative on the basis of the following eighteen other indicators included in the standard package of the MT4 terminal: AD - an indicator of accu

Description A universal indicator CCI together with moving averages based on it. Depending on the need, moving averages can be disabled. You can color the indicator lines and levels: lines of CCI, moving average lines and thresholds of overbought and oversold levels. The indicator can be calculated as the standard one on the basis of a price or as a derivative on the basis of the following eighteen other indicators included in the standard package of the MetaTrader 4 terminal: AD - an indicato

Overview The script displays information about the trade account and the current financial instrument. Information about the trade account: Account - account number and type (Real or Demo); Name - name of the account owner; Company - name of a company that provide the access to trading; Server - trade server name; Connection State - connection state; Trade Allowed - shows whether trading is allowed on the account at the moment; Balance - account balance; Equity - account equity; Credit - amount

Description A multi-purpose multi-colored/multi-symbol indicator, which is a set of standard tools from the MetaTrader 4 terminal. The difference is that below the basic price chart it allows to calculate and build in a separate window any of the twenty indicators in a colored form, painting bulls and bears in different colors, for any financial instrument in accordance with the list below: AD - an indicator of accumulation and distribution of volume. OBV - On Balance Volume. Force - Force Inde

Robo T Expert Advisor is a non-indicator trading system. Expert Advisor settings: Level_ord - distance from the current price for placing initial pending Buy Stop and Sell Stop orders, the default value is 22. Lot_1 - initial lot for buy series, the default value is 0.1. Lot_2 - initial lot for sell series, the default value is 0.1. TakeProfit - profit level, the default value is 30. TSProfitOnly - only profit is trailed. If disabled, trailing is also performed in the negative stop-loss area. Th

Description A colored universal indicator AO (Awesome Oscillator). The rising and falling of the indicator histogram can be colored. The indicator can be calculated as the standard one or as a derivative on the basis of the following eleven other indicators included in the standard package of the MetaTrader 4 terminal: AD - an indicator of accumulation and distribution of volume. OBV - On Balance Volume. Volume - tick volume indicator. Force - Force Index indicator. MFI - Money Flow Index. ATR

This Multi TimeFrame indicator is based on the "Fractals" classical indicator. 2 Inputs: TimeFrame1; TimeFrame2; You can put any available TimeFrame values (from M1 (Period_M1) to MN1 (Period_MN1)) equal or greater ( >= ) than the Period of the current Time Frame. The last Fractals will shown as color lines (Dots Line) of Support and Resistance for the Price moving.

This is a smooth and responsive accelerometer which reveals the market trend and strength. [ Installation Guide | Update Guide | Troubleshooting | FAQ | All Products ]
Two moving averages indicate trend direction The histogram represents strength of the price movement It draws buy and sell zones as colored vertical lines Should be used as a confirmation indicator Customizable line widths and colors It implements alerts of all kinds This indicator is similar to MACD but aims to react faster to

This is a Multi-Time indicator which allows to display RSI and Stochastic indicators from upper timeframes on a single chart. As an example: a single chart EURUSD M5 and RSI (blue line) and Stochastic (yellow line) from H1.
Red Histogram is representing Lower trend and Green Histogram is representing Upper trend.

When you put this Multi TimeFrame Parabolic SAR indicator on the chart it will automatically use Parabolic SAR from next available 3 timeframes. Green arrow will show the beginning of Up trend and Red arrow will show the beginning of Down trend. If AlertsEnabled = true, the indicator will show the Alert (message window) with a text like this: "Price going Down on ", Symbol(), " - ", Period(), " min", " price = ", Bid; If eMailEnabled = true the Indicator will send you an eMail with the same text

The zero line is characterized the Flat trend.
V-shaped impulse indicates the entrance to the opposite direction. U-shaped impulse = entry orders in the same direction.
If AlertsEnabled = true, the indicator will show the Alert (message window) with a text like this:
"Price going Down on ", Symbol(), " - ", Period(), " min", " price = ", Bid;
If eMailEnabled = true the indicator will send you an eMail with the same text an Alert message with subject: "Trinity-Impolse" (of course you have to chec

The indicator displays the usual Moving Average with input parameters: maPeriod_1; maMethod_1; maAppPrice_1. Then it calculates and displays MA on MA1 with input parameters: maPeriod_2; maMethod_2. Then it calculates and displays MA on MA2 with input parameters: maPeriod_3; maMethod_3. If AlertsEnabled = true the Indicator will show the Alert (message window) with a text like this: "Price going Down on ", Symbol(), " - ", Period(), " min", " price = ", Bid; If eMailEnabled = true the Indicator w

Description A colored universal indicator MACD Classic (MA convergence-divergence indicator) that combines two indicators: MACD Line and MACD Histo. The rising and falling lines, the signal line and the indicator histogram can be colored. The indicator can be calculated as the standard one on the basis of a price or as a derivative on the basis of the following twelve other indicators included in the standard package of the MetaTrader 4 terminal: AD - an indicator of accumulation and distributio

Description The universal colored multicurrency/multisymbol indicator MACD Classic, consisting of two MACD indicators: MACD Line and MACD Histo. The indicator may be used with any broker, irrespective of the name of the financial instrument since it is necessary to manually enter the name as an input parameter. If you enter a non-existent or incorrect name of a financial instrument, you will receive an error message that this financial instrument is unknown (does not exist).
Inputs Currency_Nam

Multi TimeFrame Indicator "MTF CCI Trigger" based on the Commodity Channel Index from the upper TF (input parameter "TimeFrame") yellow line. Aqua line is representing ATR envelopes from the current TF. Green and Red arrows is triggered by CCI and represented UP and DOWN trends accordingly.

The BBImpulse indicator is based on the standard Moving Average indicator. You have MA input parameters:
maPeriod - Moving Average period;
maMODE - Moving Average mode (0 = MODE_SMA; 1 = MODE_EMA; 2 = MODE_SMMA; 3 = MODE_LWMA); maPRICE - Applied price (0=PRICE_CLOSE; 1=PRICE_OPEN; 2=PRICE_HIGH; 3=PRICE_LOW; 4=PRICE_MEDIAN; 5=PRICE_TYPICAL; 6=PRICE_WEIGHTED). Green Histogram is representing an UP-trend, Red Histogram is representing a Down-trend.

Multi TimeFrame indicator MTF ADX with Histogram shows ADX indicator data from the TF by your choice. You may choose a TimeFrame equal or greater than current TF. Yellow line is representing a price trend from the upper TF. Green line is representing +DI from the upper TF. Red line is representing -DI from the upper TF. Green histogram is displaying an Up-trend. Red histogram is displaying a Down-trend.

Description A colored universal indicator/oscillator based on crossing moving averages. The rising and falling lines of the indicator histogram can be colored. The combined use of the line and the histogram increases the level of the analysis when making a decision to open or close deals. The indicator can be calculated as the standard Price Oscillator or as a derivative on the basis of the following eleven other indicators included in the standard package of the MetaTrader 4 terminal: AD - an i

Description A universal colored multicurrency/multi-symbol indicator RAVI. Was proposed by T. Chand as a trend indicator. RAVI means Range Action Verification Index. The indicator may be used with any broker, irrespective of the name of the financial instrument since it is necessary to manually enter the name as an input parameter. If you enter a non-existent or incorrect name of a financial instrument, you will receive an error message that this financial instrument is unknown (does not exist).

Description A colored multicurrency/multisymbol oscillator of the market mood. The oscillator is designed for detecting the continuation or change of the market mood prior to its occurrence. An excellent example is the screenshots that show all the features of the oscillator. The oscillator may be used with any broker, irrespective of the name of the financial instrument since it is necessary to manually enter the name as an input parameter. If you enter a non-existent or incorrect name of a fin

Description The indicator determines the appearance of internal bars on the chart, and paints them in accordance with the bullish and/or bearish mood. The indicator can notify of the appearance of a formed internal bar by playing a beep, as well as display the time remaining until the end of the formation of the current bar in the format of <d:h:m:s, where: < means the current bar. d - days. h - hours. m - minutes. s - seconds. The bullish and bearish mood can be colored.
Inputs Sound_Play - a

This Indicator creates 2 white lines based on Exponential Moving Averag e of High and Low prices. You can regulate how many bars will be involved in the calculation with input parameter HL_Period. Red and Blue arrows are displaying the moment to go Short and Long trades accordingly.

The most common way to interpreting the price Moving Average is to compare its dynamics to the price action.
When the instrument price rises above its Moving Average, a buy signal appears, if the price falls below its moving average, what we have is a sell signal. To avoid a spontaneous entries one may use this update from Moving Average Indicator = Stepper-MA.

Envelopes technical Indicator is formed with two Moving Averages one of which is shifted upward and another one is shifted downward. Envelopes define the upper and the lower margins of the price range. Signal to sell appears when the price reaches the upper margin of the band; signal to buy appears when the price reaches the lower margin. To avoid a spontaneous entries one may use this update from Envelopes Indicator = Envelopes-Stepper.

The interpretation of the Bollinger Bands is based on the fact that the prices tend to remain in between the top and the bottom line of the bands. Abrupt changes in prices tend to happen after the band has contracted due to decrease of volatility;
If prices break through the upper band, a continuation of the current trend is to be expected;
If the pikes and hollows outside the band are followed by pikes and hollows inside the band, a reverse of trend may occur;
The price movement that has starte

Fibonacci sequence is defined by integer sequence: 0, 1, 1, 2, 3, 5, 8, 13, 34, 55, 89, 144, ... By definition, it starts from 0 and 1, the next number is calculated as a sum of two previous numbers. Instead of the standard moving average, the indicator uses the caluclation of average price in form:
Bar0 + Bar1 + Bar2 + Bar3 + Bar5 + Bar8 + Bar13 +... Input parameters: FiboNumPeriod (15) - Fibonacci period; nAppliedPrice (0) - applied price (PRICE_CLOSE=0; PRICE_OPEN=1; PRICE_HIGH=2; PRICE_LOW=

This indicator present a main Moving Average line with input parameters maPeriod_1, maMethod_1 and maAppPrice_1. The second line will be a calculation of the Moving Average data of a first line with input parameters maPeriod_2, maMethod_2. The third line will be a calculation of the Moving Average data of a second line with input parameters maPeriod_3, maMethod_3. To avoid a spontaneous entries one may use this indicator-stepper.

Description The indicator determines the appearance of the bars that signal of a reversal of current local moods and plays a beep. It also paints these bars in accordance with the bullish and/or bearish priority. You can select the color for bullish and bearish moods.
Inputs Sound_Play - a flag that allows the sound notification.
Use Detection of the reversal bar can be a signal to perform appropriate trading activities. The indicator can be used for manual or automated trading in an Expert A

Description The indicator determines the appearance of bars that notify of the reversal of the current trend, and paints them in accordance with the bullish and/or bearish mood. The indicator can notify of the appearance of a formed reversal bar by playing a beep, as well as display the time remaining until the end of the formation of the current bar in the format of <d:h:m:s, where: < means the current bar. d - days. h - hours. m - minutes. s - seconds. You can select the color for bullish and

Description A universal colored multicurrency/multi-symbol indicator of moving averages: Moving Average, Double Moving Average, Triple Moving Average . The indicator is drawn in a separate window, so below the main trading chart a user can see the development of another financial instrument. It is very useful when considering the combined values of various moving averages for different financial instruments below the main trading chart. The indicator may be used with any broker, irrespective of

Description A universal colored indicator of moving averages: Moving Average, Double Moving Average, Triple Moving Average . The indicator provides various opportunities for the analysis of prices based on different ways of constructing moving averages in the window of the main financial instrument. You can color bullish and bearish moods.
Inputs MA_Type - type of multiplicity: Moving Average. Double Moving Average. Triple Moving Average. MA_Period - the MA period. MA_Method - the averaging met

Description A colored universal multicurrency/multi-symbol indicator Bollinger Bands to be drawn in a separate window below the main financial instrument. The rising and falling line of the main indicator and Bollinger Bands can be colored. The indicator can be calculated based on one of the eleven basic indicators included in the standard package of the MetaTrader 4 terminal: AD - an indicator of accumulation and distribution of volume. OBV - On Balance Volume. Force - Force Index indicator. MF

Description A colored universal multicurrency/multi-symbol indicator Channel to be drawn in a separate window below the main financial instrument. The indicator uses the calculation method of the Price Channel indicator. The rising and falling line of the main indicator and the Channel lines can be colored. The indicator can be calculated based on one of the eleven basic indicators included in the standard package of the MetaTrader 4 terminal: AD - an indicator of accumulation and distribution o

Alex Profis is a fully automated Expert Advisor for Forex trading. The EA uses the strategy based on price levels' breakout. The main rule of the EA is to preserve and increase the account balance without large risks. Therefore, the EA is in the market for mere minutes, sometimes seconds per day. The best results are achieved on GBP/USD, EUR/USD, USD/JPY. The EA works on H1. The product requires a low-spread broker with accurate order execution. Real account monitoring: https://www.mql5.com/en/u

Description Keltner's colored channel indicator,also called STARC band, drawn in the main chart window. The indicator uses the calculation technique of the three drawing options: basic, improved and modified . The first two were proposed by Keltner, the third one - by a successful trader L. Rakshe. You can also search for your own best parameters of the indicator. The upper, middle and lower bands can be colored. The indicator includes the basic analytical tool of the market moods by Keltner. Th

This indicator (as almost all others) is based on classical Moving Averages. It shows the Average Bar under the current bar colored in aqua or over the current bar colored in orange. Input Parameters: ma_Period and ma_Method. The Average Bar maybe helpful to predict where the price will move in the nearest future. Of course, this "near future" depends of the current time frame.

Description A colored universal multicurrency/multi-symbol indicator ZigZag to be drawn in a separate window below the main financial instrument. The indicator may be used with any broker, irrespective of the name of the financial instrument since it is necessary to manually enter the name as an input parameter. If you enter a non-existent or incorrect name of a financial instrument, you will receive an error message that this financial instrument is unknown (does not exist). The indicator can
The MetaTrader Market is the best place to sell trading robots and technical indicators.
You only need to develop an application for the MetaTrader platform with an attractive design and a good description. We will explain you how to publish your product on the Market to offer it to millions of MetaTrader users.
You are missing trading opportunities:
- Free trading apps
- Over 8,000 signals for copying
- Economic news for exploring financial markets
Registration
Log in
If you do not have an account, please register
Allow the use of cookies to log in to the MQL5.com website.
Please enable the necessary setting in your browser, otherwise you will not be able to log in.