Watch the Market tutorial videos on YouTube
How to buy а trading robot or an indicator
Run your EA on
virtual hosting
virtual hosting
Test аn indicator/trading robot before buying
Want to earn in the Market?
How to present a product for a sell-through
Expert Advisors and Indicators for MetaTrader 4 - 56

Mumları tarayarak işlem arar yapay bir zeka gibi çalışır. (1 veya 1+5) işlem açar. Sadece BUY veya sadece SELL yönde işleme girebilir. Kullanılan indikatörler. 2MA MACD MOMENTUM FİBONACCİ MİNMAX TREND-1 TREND-2 Gerekli koşullar oluştuğunda işleme girer önce tek sonra istenilen yönde ilerliyor ise beş işlem daha açar . Parçalayarak kar alır. FİBONACCİ seviyelerini kontrol eder.
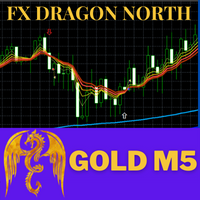
FX Dragon North Indicators is a trend indicator designed specifically for gold and can also be used on any financial instrument. Recommended time frame (XAUUSD:M5,M15,M30,H1,H4.) , (Forex: H1,H4,DAY) Can be combined with EA FX Dragon North X to increase the accuracy of EA FX Dragon North X and make more profit. ... SETTINGS Alerts - on off audible alerts. E-mail notification - on off. email notifications. Puch-notification - on off. Push notifications.

Please follow the "How To Trade" instructions exactly for best results Wycoff theory is vastly used by institutional traders but when it comes to retail traders the concept isn't well understood by most. It is even more difficult to implement in intraday & swing trading. This No REPAINT indicator helps you in analyzing the market cycles and plots buy/sell signals at the start of trending phase. It studies the market strength of bulls and bears and does a effort Vs reward matrix calculation befor
Pariteler(EURUSD M30) Fibonacci 2MA Momentum Trend1 Trend2 Support-Resistance-Pivot Parçalı kar alma Özel bir strateji ile yazılmış olan SCANNER yazılımı tarama yaparak gerekli koşullar oluştuğunda işleme girer. TakeProfit ve StopLoss bulunmaktadır. Martingalle ile işlem hacmini kar aldıkça arttırır. İşlem açıldığında dikey çubuk ile açılış tarihi ve saati ile ekranda uyarı verir. Ekranda bulunan bilgi ekranı ile kullanıcıya anlık bilgi aktarır.

This software tool is designed to streamline the process of creating horizontal trend lines and rectangles in your choice of five customizable colors. Drawing precise horizontal trend lines in MT5 can be challenging, but with this indicator, you can effortlessly create them in the colors that suit your preferences. Additionally, our tool provides a clear display of the price levels associated with the horizontal lines you draw. We value your feedback and hope you find this tool to be a valuable

Trend Capture uses advanced neural analytics method to identify the current trend of any symbol and initiate a trade. Also Trend Capture Monitor all trades initiated by it and do hedging by following various strategies used by professional traders. It Manages individual portfolio and close the trades with profits.
Trend Capture doesn't use dangerous method like Martingale, Grid etc., that can blow your account.
Refer Screenshot for result and test if before buy it.
Input Description bot

FADI GOLD EA is a fully automated TREND BASED EA designed to trade GOLD only. After years of research and hard work this is the only profitable strategy to crush the XAU/USD PAIR. The strategy is very unique and the trade will only be in the right direction of the trend and executed once all the conditions are met. The EA is very safe to use once used with the recommended settings and you can consistently grow the account overtime (DM for special set file for maximum profit). this is a very sp

The Border Crossing expert system does not use the history stored in the database to work. For his own needs, he uploads historical data online, creating his own database. In order to achieve good results in the real ticks mode on the tester, it is necessary to carry out optimization. The expert system works with ticks on all types of accounts. For the internal algorithm, the elementary unit of analysis is a tick.
The internal optimizer, after optimizing according to the specified principle,

Market Dynamics is for trend scalping. The blue is buy and red is sell. The lines are areas of price consolidation and regular bar candles are non decided. The price will consolidate between the support and resistance lines and then there is an breakout of price action out of the areas. Pic areas to scalp above or below and follow the main trends or day trade for scalps. How to: Blue is up Red is down Regular bar candles is undecided market Trade with major trends and breakouts of s/r levels

Idea Pro Trend Premium This EA is a Semi-auto Trading Panel with a variety of strategic settings, such as those listed below. It is excellent for scalping or long-term trading by traders. This EA is simple and convenient to trade and attach to the chart with the default settings on AUDUSD, EURUSD, GBPUSD and NZDUSD. Contact me immediately after the purchase to get the personal bonus!
How to use You can trade based on the trend that is displayed on the left-hand side of Info Panel. If the tren
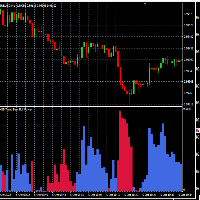
This indicator allows the visualization of the price movement in multiple chart times, as well as the Bull Market and Bear Market period and its corresponding strength.
Indicator Parameters TimeFramePeriod : Time frame TimeFrameAuto: Auto set next time frame FastPeriodCalc: Averaging fast period for calcule SlowPeriodCalc : Averaging slow period for calcule MultipleForce: force multiplier

Introducing the trend indicator! Ready trading system. The principle of the indicator is to automatically determine the current state of the market when placed on a chart. The indicator analyzes market dynamics for pivot points. Shows the favorable moments of entering the market with stripes. Can be used as a channel indicator or level indicator! This indicator allows you to analyze historical data, and on their basis display instructions to the trader on further actions. To find out how to dete

The Trend TRN trend indicator works using a special algorithm and a set of indicators. It finds the current trend based on many factors.
Trend TRN entry points should be used as potential market reversal points. The indicator works using the cyclic-wave dependence function. Thus, all entry points will be optimal points where the movement changes.
A simple and convenient indicator. The user can easily see the trends. You can use this indicator alone or in combination with other indicators ac

IMPORTANT : "Cange input Algo Mode from Testing To Scalp" Requirements Trading pairs XAUUSD Timeframe M 1, M5, M15, M30, H1 Minimum deposit $100 Leverage 1:100 Brokers Low spreads and zero stops level Features Fully automatic mode with adjustable inputs. Works by direct orders with hidden Advanced TP SL, Locking Profit, TrailingStop, Trailing Step, Trend Detect. Advanced algorithm for tracking position, time, volume, modification and exit. Filter for bad market conditions. T
Promotion $66 lifetime for you.
The principle of this indicator is very simple: detecting the trend with Moving Average, then monitoring the return point of graph by using the crossing of Stochastic Oscillator and finally predicting BUY and SELL signal with arrows, alerts and notifications. The parameters are fixed and automatically calculated on each time frame. Example: If you install indicator on EURUSD, timeframe M5: the indicator will detect the main trend with the Moving Average on this

Updated with a trend strength dashboard. No repaint, no recalculate FX Arrow Reversal is a simple non complicated arrow indicator meant for scalping trends. Discretionary methods of the trades choosing are used. Trendlines, oscillators, moving averages, channels or any other methods the trader wishes. The indicator works on any time frame and any asset. Use stop loss to preserve capital. Trade with larger trends and stay out of sideways markets. EA Based FX Arrow Reversal : https://www.

This indicator uses 2 trend filters. Great for scalping. Features alerts Settings: TrendFilterPeriod1 TrendFilterPeriod2 How to use: Attach to any chart with default settings, or set to your preference. Can be used on any time frame. If used on lower time frames, check higher time frames too. Buy : - Blue histo color. Sell : - Red histo color. Or backtest and use as you see fit for your strategy. Best results on Major Pairs, but can also be used on other pairs (Metals, Minors).
Important to no

Main Features
Detect the best and most successful point of trend and reversal trend Easy-to-use Intuitive easy setup Scan the number of candles – Amount of history bars to evaluate Configuring not required Watches multiple timeframes for support and resistance Customizable Trailing stoploss and takeprofit Automatic Lot Size Optimization Suitable for any time frame Suitable for any currency pair
This EA is fully automated and easy to use. This robot uses Moving Averages working i

Main Features Detect the best and most successful point of trend or reversal trend Easy-to-use Stop Loss and Take Profit Scan the number of candles – Amount of history bars to evaluate Intuitive easy setup Configuring not required Suitable for any type of instrument Suitable for any time frame Suitable for any currency pair This EA is fully automated and easy to use. This robot uses Moving Averages working in combination with RSI and MACD filters built in. It is a dynamic EA that is very active

Neural Bands is a scalping indicator. There are 2 different deviation bands for oversold and overbought levels. Color candles are to determine the trend if it passes the deviations and is showing a strong trend or if the color candles stop at the deviations and revert back to the mean. This indicator is a type of regression indicator trading ranges and breakouts in price. 15 min charts and above recommended. TRADE WITH THE LARGER TREND DIRECTION
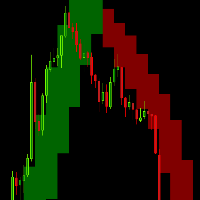
Anyone who is experienced in trading knows that longer time signals are trend signals. That's why it's always good to follow the trends of longer times to make a good trade.
With that in mind, I created the trend indicator in the background
Indicator Parameters TFBar - TimeFrame BackgroundEnabled - Enable Background NumbersOfBars - Numbers of Bar draw ColorUp - Color Up ColorDown - Color Down Smoothing - Heiken-Ashi Smoothing Average
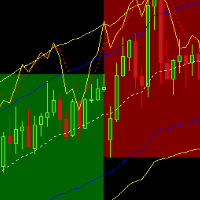
This indicator allows to observe the larger time trends and the stochastic channel on the chart
Indicator Parameters KPeriod - %K period. This is the number of time periods used in the stochastic calculation; DPeriod - %D calculation period Slowing - Slow K calculation period maPeriod - Averaging period maMethod - Averaging method maPrice - Averaging Price LineoverBought2 - line over bought 2 LineoverBought1 - line over bought 1 LineMidle - line midle LineOverSold1 - line over sold 1 LineOv

Twin Hunters is a bit risky but very profitble Expert Adviser.
Features This EA trades on both Trend Following and Contrarian Trading strategies, so it gains you profit in any market conditions. Frequent trades (it trades multiple times if the market conditions match). Weekend Filter Recommendation Symbol : XAU/USD Timeframe : 15M Minimum deposit : 5,000$ Low spread broker Settings Setting Instruction visual If TRUE, information board is activated
*When in use of strategy tester, it'll be q

What Is The Buy OR Sell MT4 Indicator? As the name suggests, the Buy-Sell Indicator is an indicator that tells traders about when to take the buy and sell position on the Forex price chart. This tool is a preference of many traders because it can provide solid indications of the trend and its reversals. In addition, it helps them simplify the hassle of choosing one or more indicators because this one tool alone is enough to provide them with a straight answer. When you apply this indicator

Hedge EA will turn your losing trades into winners using a unique hedging strategy. Once the initial trade moves into negative territory a predefined number of pips or change in signal, the recovery mechanism will kick in: it will place a limited amount of opposite trades at the signal, until all of them can be closed with a small gain. It can trade Crypto, Forex pairs, Metals, Indices but need you optimize. Fully automatic adviser, with a system for recovering from losses. You can choose to

PLEASE NOTE: You can customize the settings of all 3 EMA as per your requirement. The accuracy will change as per your settings.
100% Non repaint Pre-alert (get ready) signals Non-delay indications 24/7 signals 100% No lag No recalculating Lifetime license This is a EMA crossover indicator and its 100% non repaint indicator. The EMA_1 and the EMA_2 is based on which signal is generated. EMA_3 is a Higher EMA value which will remain below or above the candle (market) to identify the trend. M

This Robot allows the execution of orders following the trend, whether it is bullish or bearish, it has been tested in the EUR/USD pair in a time range of 8 years from from 2015 to 2022 with a few more than 1000% profit results, it has excellent capital management since it will depend on the The amount entered will also calculate the lottery to reduce the risk of loss.
The robot calculates the lottery from 100 dollars but it is recommended in accounts with a minimum of 1000 dollars The ro
MACD EXPLANATION Moving average convergence divergence (MACD, or MAC-D) is a trend-following momentum indicator that shows the relationship between two exponential moving averages (EMA's) of a price. The MACD is calculated by subtracting the 26-period exponential moving average (EMA) from the 12-period EMA. macd is one of the best momentum indicators macd is used by a lot of professional traders when it comes to continuous trade macd is the best choice if used properly even a ne
MACD EXPLANATION Moving average convergence divergence (MACD, or MAC-D) is a trend-following momentum indicator that shows the relationship between two exponential moving averages (EMA's) of a price. The MACD is calculated by subtracting the 26-period exponential moving average (EMA) from the 12-period EMA. macd is one of the best momentum indicators macd is used by a lot of professional traders when it comes to continuous trade macd is the best choice if used properly even a ne

Easy Technical Indicator is a powerful tool to detect the market trend and its strength . in addition, The signal Line reduce volatility and convert main trends to reliable Buy or Sell Signals --- Contact me in messages for free gift after purchase! --- HISTOGRAM:
It shows the main trend of the market. A histogram above zero means that the market is bullish A histogram below zero means that the market is bearish The height of the histogram bars indicates the strength of the trend weak,

Özel Stratejisi ile çalışıyor. Kullanılan işleme giriş İndikatörler(ATR-SAR-KAMA-RSI-TREND-ATR2) Lot ayarını.0. 20 başlattığınız da hedefini Kar Al giderken önce 0.10 daha sonra kalanın ardından 0.5 lot olacak 0.3 ve en son da 0.2 lot kapatır. Parçalayarak Kar alır. ATR ile takip eden Zararı durdur. Görsel Ekranda Kar-Zarar ve Sermaye -Bakiye bilgileri eklenmiştir.

Floating gain meter is the manual trading system that works with local trends and it's scalping. Histogram represents bull/bear floating trend gain. Green color histogram shows choppy market with bullish pressure, Orange - shows choppy market with bearish pressure. Lime and Red colors shows "boiled" places in market. As a rule buy arrow is placed after strong Down movement when it's power becomes weak and choppy market starts. And sell arrow is plotted after strong Up movement when it's power

Trend speed vector - is the oscillator for manual trading. System measures trend direction and it's speed. Histogram shows 4 colors: Lime --> Strong up movement with good gain speed; Green --> Up movement with low gain speed Red --> Strong down movement with good gain speed; Orange --> Down movement with low gain speed Green and Orange histograms show weak market's movements and thуese places excluded from signal points. Buy arrow is plotted during strong down movement when bearish gain speed i

Floating peaks oscillator - it the manual trading system. It's based on Stochastik/RSI type of oscillator with dynamic/floating overbought and oversold levels. When main line is green - market is under bullish pressure, when main line is red - market is under bearish pressure. Buy arrow appears at the floating bottom and sell arrow appears at floating top. Indicator allows to reverse signal types. Main indicator's adjustable inputs : mainTrendPeriod; signalTrendPeriod; smoothedTrendPeriod; tre

Precautions for subscribing to indicator This indicator only supports the computer version of MT4 Does not support MT5, mobile phones, tablets The indicator only shows the day's entry arrow The previous history arrow will not be displayed (Live broadcast is for demonstration) The indicator is a trading aid Is not a EA automatic trading No copy trading function
The indicator only indicates the entry position No exit (target profit)
The entry stop loss point is set at 30-50 PIPS Or the front

Triple trend index is the manual trading system/indicator. It looks for trend reversal points according to main trend index datas. Indicator represents 4 lines. 3 lines shows trend power by main market's parametres. 4th line (OrangeRed) is the main index. When line is above zero level - market is bullish, value below zero show bearish pressure. Indicator "looks" for weak places(reversal points) on bullish market to plot a sell arrow and weak places(reversal points) on bearish market to plot a

Impulse fractals indicator - is counter-trend oriented complex market fractal pattern. Market creates bull/bear impulse, trend starts, fractals on impulsed wave are an agressive pullback signals. Buy arrow is plotted when market is bearish and it's impulse showed up-side fractal, and sell arrow is plotted when market is bullish and it's impulse showed dn-side fractal. Main indicator's adjustable inputs : impulsePeriod - main period of impulse histogram filterPeriod - smoothes impulse accordi

TPM Cross (trend power moving cross) - is a trend following strategy based on custom signal points. Indicator consists from main custom moving chart line and trend power line. Indicator defines up and down movements by it's trend power and custom moving direction. When current market's trend looses it's power and opposite trend starts - power trend line crosses moving and indicator plots an arrow. Main indicator's adjustable inputs : movingPeriod - period of moving line trendPeriod - period

XFlow shows an expanding price channel that helps determine the trend and the moments of its reversal. It is also used when accompanying transactions to set take profit/stop loss and averages. It has practically no parameters and is very easy to use - just specify an important moment in the history for you and the indicator will calculate the price channel.
DISPLAYED LINES ROTATE - a thick solid line. The center of the general price rotation. The price makes wide cyclical movements around the

This indicator takes input from the RSI, combined with a trend filter. Great for scalping. Does not feature any alerts and is best used manually. Settings: TrendFilterPeriod RSIPeriod Set these parameters to your preference. How to use: Attach to any chart with default settings. Can be used on any time frame. If used on lower time frames, check higher time frames too. Buy : - Wait for blue histo color to cross above level 50, then open buys. **Best results when checking the higher time frames to
That is my master piece invented new Forex indicator Copyright 2010 to 2100 (316009) for Sami A. Saydam. This indicator is showing the real Support and Resistance levels in dynamical ways as movable red lines with time, also works on all time charts' intervals. The price movements are strongly respecting those red lines and either confirmed break them or just touching them and can't break them up or down then move toward the right directions. This new techniques are the real alerting system ca

EA SUPER MATAELANG PRO
See Live Result : https://www.mql5.com/en/signals/2040079?source=Site +Profile+Seller https://www.mql5.com/en/signals/2146550?source=Site +Profile+Seller
About EA:
This EA uses some very sophisticated indicators. Can detect trend direction with high accuracy. It also has a safety system to anticipate if the price direction is not in the same direction as the position. Using security in the form of an averaging or martingale system Best used in the m15 time frame. Th

The Th3Eng Ninja indicator is based on an analysis of the right trend direction with perfect custom algorithms. It show the true direction and the best point of the trend. With Stop Loss point and Three Take Profit points. Also it provides a secondary entry points in dots arrows style. And Finally it draws a very helpful lines from entry level to TP1, TP2, TP3, SL levels or the reverse signal, and all current/old signals status.
How to use the indicator
No complicated steps , Just follow 2

Taking as baseline Diamond Trend Indicator, which has provided good results so far detecting Trends , here is coming up a new Expert Advisor where DT and IHeOS Cloud indicators are working together. It is recommended to use 1:500 or above to mitigate typical margin default risks. Works in any timeframe for FX, GOLD/AUXUSD, BRENT... not tested with Indexes DIHeOST EA instance tracks its own operations, if you want to use more than one DIHeOST EA (and/or any of my other EAs) in the same accou

Advance Trend Intellegence EA is Powefull Expert Advisor base on trend following strategy. This expert using advance dynamical algorithm to cathching the market trend. With this EA orders that are made accurate entry orders in the market in tune with the trend signal. This EA have a good performance that has been tested more than 1 years with real ticks history data.
Although this EA can be use on any pairs, but please Use this EA on EURUSD Pair at M15 timeframe. Account type : HEDGE.
Adva

The KT Tether Line is a trend-following tool consisting of three indicators that work together to generate trading signals. It can correctly identify market trends while signaling trade entries. It was first introduced by Bryan Strain in the Stock & Commodities magazine in 2000 in "How to get with the trend and out at the end."
The Concept
When a market trend is confirmed, the most challenging part is determining the timing of the entries. This indicator alerts you to potential trend reversal

Robot FX-TR1 EA. examines the market.(EURUSD) There are TP and SL. First, it opens a single trade and opens other trades that you specify (1+1.1+2.1+3.1+4.1+5) at certain intervals in the direction of the trade it opens. You can set your risk ratio to 2-3-4-5%. It uses 8 indicators for profit. These indicators (BUY) or (SELL) give the same signal direction. Indicators:(MA1-MA2-RSI-MACD-TREND1-TREND2-MINMAX-VOLUME) and SUBRES instantaneously control. Period: M30 Pair: EURUSD Support-Resistance I

KT Forex Trend Rider uses a trend following algorithm developed specifically for the Forex market to provide reliable buy & sell signals across the major currency pairs. It works best on major FX pairs and all time-frames.
Features
It comes with a Multi-Timeframe scanner that can search for upcoming signals across all the time-frames. It comes with four preset profiles to facilitate trading for scalpers, tick-trend, swing, and trend traders. It marks the potential reversal points in the mark
KT XMaster Formula is a buy & sell signal indicator that works magically on most of the timeframes and currency pairs when used correctly.
The indicator uses calculations based on moving averages, RSI, and MACD. It is usually appropriate for scalping and trend trading - whether you are a novice or an experienced trader, the signals generated by this indicator are simple to understand and implement.
Overview The indicator comprises green and red dots arranged in wavy lines. These dots corre

In MetaTrader, plotting multiple horizontal lines and then tracking their respective price levels can be a hassle. This indicator automatically plots multiple horizontal lines at equal intervals for setting price alerts, plotting support and resistance levels, and other manual purposes. This indicator is suitable for Forex traders who are new and looking for chances to make quick profits from buying and selling. Horizontal lines can help traders find possible areas to start trading when the
The KT De Munyuk is a trend-based indicator that uses Parabolic SAR to identify the market direction. The indicator shows the PSAR in the form of green/red dots using a separate window. Buy Signal: When a green dot appears after a series of at least three red dots. Buy Exit: When a red dot appears on the current or next higher time frame. Sell Signal: When a red dot appears after a series of at least three green dots. Sell Exit: When a green dot appears on the current or next higher

This Expert Advisor is developed to trade the signals from the Zig Zag Indicator. The Bot opens Long positions, at the first value of the descending Zig Zag Indicator, and closes them at the appearance of an ascending Zig Zag. The Bot opens Short positions, at the first value of the ascending Zig Zag Indicator, and closes them at the appearance of a descending Zig Zag. EA is suitable for both Range trading and Trend trading.
This Expert Advisor is developed to catch Strong Directional Movements in the Markets - when the market goes out of Range (Range Breakout) or when it follows the Trend (Trend Breakout), or when trading News Data. The Bot will open a Long position at the first value of the ascending Zig Zag. The Bot will open a Short position at the first value of the descending Zig Zag. The main Advantage of this Bot is that it adds positions to already profitable ones and thus we maximize the Profit from the Ca
Zig Zag Multi Time Frame Indicator counts in how many consecutive candlesticks the current Zig Zag "lit" on the different Time Frames. It can be used for both trend signal strategies and range breakout strategies. Shows simultaneously on all Frames in how many candles we have had Zig Zag value in the current swing. The Zig Zag period can be adjusted in the Indicator settings.
M1 Arrow Scalping - shows signals on the M1 period, does not redraw entry points and can work on all major currency pairs + metals (gold/silver). The indicator analyzes the market using algorithms for determining price patterns and shows the trader the price reversal points on the chart. The red dot shows that the price will turn down and the blue dot shows that the price will turn up. The indicator also sends signals to the phone in the form of PUSH notifications. Therefore, you do not need to
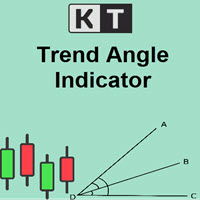
The KT Trend Angle helps to identify ranging and trending markets. The idea is to only enter a trade following the market trend if the slope is steep enough.
An angle is the ratio of the number of bars to the number of points: The bars mean the time offered by standard (M1, M5, etc.) and non-standard time frames. Points represent the unit of price measurement with an accuracy of 4 or 5 decimal places.
Input Parameters Period: An integer value to define the intensity of angled trendlines. A

Seven copies left at $99 USD. Next price is 149 USD
Smooth Lift is an indicator-based trading system that includes 7 indicators, including trend indicators, volume indicators and indicators of possible price movement strength. They are used to confirm the analysis of the main Smooth Lift trading system. The trading is performed on 24/5.
The strategy was developed taking into account the movement of the currency pair USDCHF and the best trading performance is on it.
Recommendations: - H1 U

The Magic MA Moving Average Indicator is a market analysis tool that has more than 30 types of moving averages that the trader can use to gauge the market trend.
Among the types of moving averages that the trader can visualize are the most common MAs (SMA, EMA and SMMA), adaptive moving averages such as FRAMA and KAMA and other MAs based on innovative calculation and analysis methods such as LSMA, ZLEMA and others.
The indicator is designed to display all these moving averages on a single c

This indicator uses a special algorithm to plot the 4 lines for trading. Great for scalping. Features alerts. Settings for trend filters. How to use: Simply attach to any chart with default settings. Buy when the three pink lines converge below the green line. Sell when the three pink lines converge above the green line. Best results when looking at three or more time frames, and the three blue lines have just converged below or above the green line.
Use as you see fit for your strategy. Best r

This trading system requires the user to manually add Fibonacci, trend lines, horizontal lines, channel to perform semi-automatic or manual trading. The trading system can also be used in the tester.
Trading panel provides: spread information margin information free marging Information The swap information to order for lots (requires your dealer support)

StarBounce è un indicatore NO REPAINT che sfrutta i livelli importanti dei timeframe superiori. StarBounce disegna i livelli di Apertura, Chiusura, Massimo e Minimo delle candele di uno specifico timeframe e su questi livelli cerca dei re-test. Si cercano candele con corpo sopra/sotto un livello e minimo/massimo oltre il medesimo livello. Si possono filtrare le candele segnale con diversi filtri selezionabili, attivabili, disattivabili con variabili esterne. Number of trending candles: permette

Dema divergence points - is the manual trading system based on double exponental moving divergence. Histogram represents 4 colors : yellow - strong up trend, orange - up movement, blue - down movement and aqua - strong down trend. Up arrow is poltted when dema crosses current price up - but phase is still strong down (aqua color), down arrow is poltted when dema crosses current price down - but phase is still strong up (yellow color). Main inputs : mainPeriod - main dema calculation period; f

MultiTrendLines - мультивалютный индикатор для автоматизации графического анализа трендовых линий. Позволяет быстро выполнять трудоемкий анализ трендовой ситуации на рынке. Использует точные математические алгоритмы выделения ключевых точек рынка для извлечения трендовой струкртуры инструмента. За счет применения корреляционных сигналов можно улучшить симметричную оценку поведения инструмента. Включает в себя возможность точно задавать необходимый уровень глубины и угла трендовой линии. Основной

The effectiveness of the adviser is confirmed by trading on real accounts. Signal https://www.mql5.com/ru/signals/1714293 The Invest Time Classic uses many different strategies, including mean reversion, trend following, and a smart grid system with variable take profit levels that adapt to market conditions. Unlike conventional grid systems, where the risk is very high compared to the potential profit, Invest Time Classic will only open trades under suitable market conditions, which is conf

Trend reversal index - is the manual trading system that works with overbought , oversold levels and reversal patterns. Sell arrow is plotted when indicator is higher than overbought level and here forms reversal pattern, all pattern points located higher than overbought level. Opposite with buy arrow : ndicator is lower than oversold level and here forms reversal pattern, all pattern points located lower than overbought level. Main Indicator's Features Signals are not repaint, late or disapp

ASI fractals with DPO filter - is the manual trend-following system. ASI fractals are the base of every trend. System plots an arrow when fractal pattern appears on ASI indcator and DPO direction is same as incomming signal. System has several ways of usage : simply indicator, indicator with suggested arrows, arrows with single targets and arrows with common profit targets. User can simply switch indicator's modes directly from chart. Main Indicator's Features Signals are not repaint,non-late or

StarSwing è un indicatore NO REPAINT che unisce in un unico strumento oscillatori e indicatori di forza. I parametri esterni permettono di bilanciare il peso delle componenti e di regolare a proprio piacimento l'indicatore stesso. StarSwing, graficamente, è composto da segmenti di 2 colori: uno rappresentante il rialzo e uno il ribasso. Il colore non dipende dalla pura direzione del segmento ma dal trend di fondo calcolato dall'indicatore stesso. Sul grafico, si può far disegnare una media mobi

ROC acceleration-deceleration is the manual system for medium-term scalping. Indicator based on custom ROC system which defines bullish/bearish market and especially acceleration-deceleration of tendention in the market's main direction. Buy arrow is plotted during bearish market when current trend decelerates and sell arrow is plotted during bullish market when current trend decelerates. Main Indicator's Features Signals are not repaint,non-late or disappear(exept cases when system recalculat

We do not want to make you confused with an imaginary high profit screenshot from Strategy Tester which has no relation/guarantee of future profit! We just want to tell you the real thing about our EA. TrendEx Pro has been developed to trade on Gold specially, combining multiple strategies algorithm to ensure Trend catching and trading on. It can identify both short and long trends and opens positions accordingly with excellent built-in risk management logic. There is no use of any dangerous met
IMPORTANT: Set Work = false in settings. A. What is A2SR-DASH?
It is a dashboard indicator for the A2SR indicator (needed on same chart) here - https://www.mql5.com/en/market/product/5225 It solves the problem of having many charts open with A2SR loaded on each having to switch back and forth. + Visually shows movement of price flowing between Open price to ADJ or ADF. + Acutual SR levels displayed as golden dots across all pairs! + Quickly find "first test" SR levels. + Gives timely alerts
The MetaTrader Market offers a convenient and secure venue to buy applications for the MetaTrader platform. Download free demo versions of Expert Advisors and indicators right from your terminal for testing in the Strategy Tester.
Test applications in different modes to monitor the performance and make a payment for the product you want using the MQL5.community Payment System.
You are missing trading opportunities:
- Free trading apps
- Over 8,000 signals for copying
- Economic news for exploring financial markets
Registration
Log in
If you do not have an account, please register
Allow the use of cookies to log in to the MQL5.com website.
Please enable the necessary setting in your browser, otherwise you will not be able to log in.