Watch the Market tutorial videos on YouTube
How to buy а trading robot or an indicator
Run your EA on
virtual hosting
virtual hosting
Test аn indicator/trading robot before buying
Want to earn in the Market?
How to present a product for a sell-through
Technical Indicators for MetaTrader 4 - 96
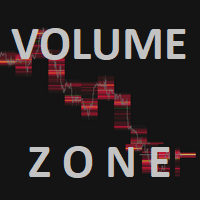
This is an indicator that shows high volume zones and very important points such as V-POC, Average Volume and V-WAP, its use is very similar to the volume Profile but has much more use, You can adjust the time interval in which the zone is to be built, I recommend high compartments type D1, W, M. But if you are using very low time intervals you can also use lower TF zones. If you need an indicator that shows the variable volume zone range frames there is ...HERE...
Volume Zone is an adv
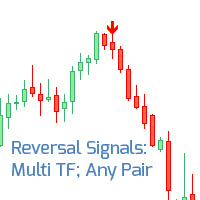
Multi-currency indicator of reversal signals. My #1 Assistant : includes 65 + functions | Contact me if you have any questions They are calculated based on the oversold and overbought levels. It works on any trading instruments and any timeframes. The arrow colors can be changed in the settings.
There are notification options: in the terminal and on the mobile device.
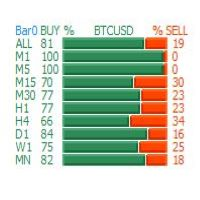
This MT4 indicator, Bull Bear Visual MTF V2, summarize the strength color graphic and percentages of power for both Bull and Bear in current market emotion stage which will show you in multi timeframes (9) and sum of the total Bull and Bear power strength which is an important information for traders especially you can see all Bull and Bear power in visualized graphic easily, Hope it will be helpful tool for you for making a good decision in trading.

https://www.mql4.com The price trend indicator
The price trend indicator accurately shows the changes in market prices , At the same time, this index also shows the future trend of the market price . The indicator does not redraw and does not lag. The recommended time frame is not less than H1 . When the market price is in the light green range, the market is in the rising range, and when the market price is in the light purple range, the market is in the falling range

Scalper indicator designed for accurate entry into trade transactions. Designed for intraday and medium-term trading on any instrument. The indicator does not redraw and does not lag. There is a possibility of visual and sound notification of the appearance of a signal to enter. The indicator also sends signals to digital buffers, which makes it possible to create automated trading systems based on it.

The uniqueness of the KN-13 Ind indicator allows you to see order books on the chart. It is based on the algorithm for order book traders. The MT4 terminal chart displays the depth of the order book and the time of its formation. The direction displays the color, this allows us to understand the market mood in the most informative way. The settings allow you to dynamically adjust to any trading mode both for scalping and for medium and long-term trading.

The uniqueness of the Draga KN MIX Ind indicator allows you to see the order books on the chart. It is based on an algorithm for order book traders. The MT4 terminal chart displays the depth of the order book and the time of its formation. Direction reflects color, this allows us to most informatively understand the mood of the market. The settings allow you to dynamically adjust to any trading mode, both for scalping and for medium-term and long-term trading.

A "Volume Profile" is an advanced charting indicator that displays total volume traded at every price level over a user specified time period. The main components of the volume profile are POC ( Point Of Control - the price level, at which the maximum number of contracts were executed during a selected period), VAH ( Value Area High - the highest price in the Value Area) and VAL ( Value Area Low - the lowest price in the Value Area).
When we settled on the original indicator, we spent a lot o

The most crucial price level in any "Volume Profile" is the "Point of Control" . Is the price level with the highest traded volume. And mainly, is the level where the big guys start there their positions, so it's an accumulation/distribution level for smart money.
The idea of the indicator arose after the "MR Volume Profile Rectangles" indicator was made. When creating the "MR Volume Profile Rectangles" indicator, we spent a lot of time comparing the volumes with those from the volume profil

In the "Masters of Risk" trading system, one of the main concepts is related to places where markets change direction. In fact, this is a change in priority and a violation of the trend structure at the extremes of the market, where supposedly there are or would be stop-losses of "smart" participants who are outside the boundaries of the accumulation of volume. For this reason, we call them "Reversal Patterns" - places with a lot of weight for the start of a new and strong trend. Some of the imp

" A trading range occurs when a financial instrument trades between constant high and low prices over a period of time. The upper part of the trading range of a financial instrument often provides price resistance, while the lower part of the trading range usually offers price support. Traders can enter in the direction of a breakout or breakdown from a trading range... "
This is the "Classical Theory" understanding of ranges. We have a different understanding of the nature of ranges and th

TRENDIEST TREND LINE ️️️️️ Do you want to become a constantly profitable 5-star forex trader? ️️️️️
Trendiest Trend Line is a one of a kind trend line indicator, Trend lines work until the market reverses or consolidates. Easily stay out of the chop and stay in the long trends!
Key Features of Trendiest Trend Line Stay in strong trends longer with confidence Clearly shows you when the market is ranging to save you money Entry signals help you get in at a good price 100% reliable

The Trend Display is a nice additional Tool to identify the current trend of the pair you want to trade.
It shows you the direction of the trend in the separate charts.
That way you have a nice overview of the direction in one chart.
You do not need to swap between each time frame to identify the trend.
I wish everyone the most possible success when trading FX. Thank you for using that Indicator.
Reborn master
The MT4 indicator finds turning points for entering trades. Works without redrawing and delays!
The indicator ideally determines the points of the beginning of a trend or correction for entering trades for currencies, crypts, metals, stocks, indices.
The first 10 sales will be with a 40% discount, then the price will be without a discount
Benefits: Signals are not redrawn! and are shown at the moment of appearance, and since the signal can appear at any time, the indica

This MT4 indicator, Stochastic Visual MTF, summarize the oscillator values in color graphic for both Main and Signal in current market emotion stage which will show you in multi timeframes (9) and sum of the total Main and Signal oscillator values which is an important information for traders especially you can see all oscillator values in visualized graphic easily, You can add more by Shift, Hope it will be helpful tool for you for making a good decision in trading.

The Point Transition trend indicator is based on price divergence. If you do not have your own trading strategy yet, you can use our ready-made trading strategy. The indicator will help in finding entry points when analyzing the price chart. The indicator displays information in a visual form. Has one Length parameter. It can be used as a filter in trading. The indicator can work both for entry points and as a filter. Do not forget that the approach to trading must be complex, additional informa
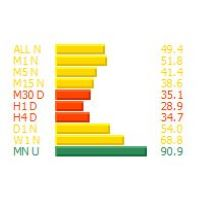
This MT4 indicator, Rsi Visual MTF, summarize the oscillator values in color graphic in current market emotion stage which will show you in multi timeframes (9) and sum of the total Rsi oscillator values which is an important information for traders especially you can see all oscillator values in visualized graphic easily, Hope it will be helpful tool for you for making a good decision in trading.

Active Channel is a non-redrawing channel indicator based on moving averages. The key difference between the Active Channel indicator and other channel indicators (for example, from the same Bollinger) is that the Active Channel takes into account not simple moving averages, but twice smoothed ones, which, on the one hand, makes it possible to more clearly determine the market movement, and on the other hand makes the indicator less sensitive.

The Arrows Forecasters indicator is simple, visual and effective trend detection. The intelligent algorithm of the indicator determines the trend with a good probability. Uses just one parameter for settings. The indicator shows the points of potential market reversal. Ready-made trading system.
The indicator does not redraw and does not lag. Works on all currency pairs and on all timeframes. You should remember that using a combination of forecasting tools, it is advisable to choose 2-3 indi

The Trend Goblin indicator identifies the mainstream trend. They help to analyze the market on a selected time frame. Easy to set up and works on all pairs and all time frames. Trend indicators provide an opportunity to classify the direction of price movement by determining its strength. Solving this problem helps investors enter the market on time and get good returns.
It is extremely important for any trader to correctly determine the direction and strength of the trend movement. Unfortuna

Schrodinger Channel is a non-redrawing channel indicator based on moving averages, it takes into account not simple moving averages, but twice smoothed ones, which, on the one hand, makes it possible to more clearly determine the market movement, and on the other hand, makes the indicator less sensitive. Signals are not redrawn and can be used immediately after they appear. This means that there is no need to wait for a new confirming bar. The lower and upper bands are used as support / resista

Most often, a good trend is visible on a price chart visually. But an experienced trader should clearly understand the current balance of power in the market before entering. The Trend Regulator indicator will help the trader to make decisions by helping him with the appropriate signals. The intelligent algorithm of the Trend Regulator indicator shows the points of potential market reversal. A strategy for trading with the trend, filtering market noise and all the necessary features built into o

Fibonacci Retracements Pro The Fibonacci Retracements Pro is a powerful yet easy to use indicator. It automatically plots all the important Fibonacci retracement and extension levels for you. FRP is dynamic powerful and seamlessly adjusts to whatever timeframe you are analyzing. Fibonacci Retracement Pro is optimized for ALL timeframes and ALL Currency pairs, Indices, Commodities, and Cryptocurrency pairs. Trade with improved confidence and maximize your success rate. Benefits Dynamic and Power

This FX indicator shows exactly when you need to buy or sell a position and is based on moving average indicator (golden cross and dead cross). If a golden cross or dead cross is detected, arrows will appear and an alert will sound. If you see the up arrow , the price will go up . When there appear down arrow , the price will go down . So you can decide easily buy or sell based on the information which you can gain from moving average! You can adjust the period in parameter settings. Default nu

The indicator works on the principle of the difference between two oscillators. You can set the periods for the fast and slow oscillator, as well as the position relative to the given level. This indicator will take your trading to a whole new level.
Settings: FastPeriod - fast oscillator period. SlowPeriod - the period of the slow oscillator. LevelSignal - signal level. Index - the bar from which to take data, 0 - the current bar, 1 - the previous one.
The indicator works on all timeframes

The indicator works on the principle of drawing buy and sell arrows, based on the signals of the built-in algorithm. The indicator definitely needs a flat filter. This indicator will take trading to a new level. Works on all timeframes and currency pairs. It is advisable to use the indicator in conjunction with other tools for more reliable signals and making a more balanced decision.

The Secret Channel is an extended version of the Bolinger Bands. For those who use konals when trading. For this indicator to work, a moving average with a MAPeriod period is taken - the number of bars for analysis. As a result, two channels will be built, one shows the limit of the price in 70% of the time for the selected number of bars, the other shows the limits of the price 90% of the time for the selected number of bars. The channel calculates the limits within which any indicator or price

Indicator for working with a Trend. Trend is your friend! The digital indicator helps to find the optimal points of entry into the market, to stay in the trend as much as possible. If the trend and direction change, exit the position in time. The indicator is recommended for use on timeframes H4 and higher. Works on any trading instrument. The indicator menu contains options for fine tuning the signals and color gamut. Happy trading!
Fundamental Signals Indicator is a Non-Repaint Indicator with a powerful calculation engine that can predict market movement over 3000 pips (30000 points). The indicator does not analyze the market fundamentally, it is named fundamental because it can predict trends with large movements, no complicated inputs and low risk. Also Indicator can alert on market trend changes.
Using Indicator :
The Indicator is very simple and without complicated input parameters. (No need to optimize anythin
Trade Zone SupDem - индикатор служит для определения зон спроса/предложения. В возможности входят такие функции, как отображение зон уже пробитых, зон к которым цена еще не доходила с момента определения, и подтвержденным, к которым цена уже доходила, но не пересекала полностью. Сами зоны можно определять, как с текущего таймфрейма, так и со старшего. Важно помнить, что если необходимо отображения зон с нескольких таймфреймов, то придется прикреплять к графику несколько копий индикатора, и при э

This is Command Prompt(CP) for MT4. By using this,you can access info that only brokers and programmers can access. For example,do you know your freeze level,margin mode,or how much memory used by MT4? Knowing these info,you can improve your trading.
How to Use Type following commands into command prompt box(Shown in photos.) and press Enter. For example,if you want to know maximum permitted amount of a lot,then type "maxlot". By typing "info",CP will show all commands available. By typing "he

GT_Volume - это универсальный индикатор подходящий для всех валютных пар. Показывает текущий объем на горизонтальных уровнях. Объемы рисуются по мере движения цены. Все просто и нет ни чего лишнего. Индикатор очень помогает быстро определить сильные уровни сопротивления и поддержки, работает шустро! Есть возможность поменять цвет и выбрать день на котором отображать объемы.
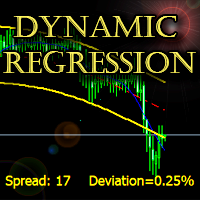
The indicator builds a dynamic regression channel with high accuracy without lagging.
Channel deviation is calculated using a unique formula and displayed on the graph.
Support: https://www.mql5.com/en/channels/TrendHunter
Can be used on any timeframe and any instrument. MT5-version: https://www.mql5.com/en/market/product/64257 Can be used as a ready-made trading system, as well as an addition to the existing one.
Settings: Fast Period - Fast smoothing period; Slow Period - Slow smoo

Order Squeeze Easy to use indicator to predict the market movement with calculated HIGH important levels. These levels are calculated in the lowest time frame with candle details. Ind calculates the quantity of market tick, volume per tick, and orders per candle. So with this statistical data, you catch the important price levels that supply and demand in the market are attractive for sellers and buyers. Institutes and banks trade with huge order lots and they need a lot of sellers for their

The Search for Reversal trend indicator can be used both for pipsing on small periods and for long-term trading. Indicator showing signals for entry. Displays both entry points and the trend itself. Shows statistically calculated times to enter the market with arrows. Using the indicator, you can optimally distribute the risk coefficient.
Uses all one parameter for settings. When choosing a parameter, it is necessary to visually resemble so that the corresponding graph has an excellent projec

The key difference between the Real Channel indicator and other channel indicators (for example, from the same Bollinger) is that the Real Channel takes into account not simple moving averages, but twice smoothed ones, which, on the one hand, makes it possible to more clearly determine the market movement, and on the other hand makes the indicator less sensitive. Real Channel is a non-redrawing channel indicator based on moving averages.

The Direction Arrows indicator tracks the market trend while ignoring the sharp market fluctuations and noise around the average price. The indicator implements a kind of technical analysis based on the idea that the market is cyclical in nature. It catches the trend and shows favorable moments of entering the market with arrows. The indicator can be used both for pipsing on small periods and for long-term trading.

Индикатор Adapter определяет господствующую тенденцию, помогает анализировать рынок на выбранном временном интервале. Прост в настройке и работает на всех парах и всех временных интервалах.
Индикаторы тренда дают возможность классифицировать направление ценового движения, определив его силу. Решение этой проблемы помогает инвесторам вовремя войти в рынок и получить хорошую отдачу. Для любого трейдера крайне важно правильно определить направление и силу трендового движения. К сожалению, единст

Balanced Costing - shows signals - can be used with an optimal risk factor. The indicator can be used both for pipsing on small periods and for long-term trading. The Balanced Costing trend indicator uses reliable algorithms in its calculations. Shows favorable moments for entering the market with arrows, that is, using the indicator is quite simple.
Works on all currency pairs and on all timeframes. Of course, the approach to trading should be complex and in order to make a decision, you sho

The indicator of tick volumes Better Volume MT4 allows you to assess the general mood of the market and quite accurately catch the moments of the formation of large movements. The indicator is a color arrows on chart window. In the calculation of Better Volume MT4 the Price Action combinations are taken into account, the values of the volumes with the height of columns and color marking are displayed. Input parameters: MAPeriod - period for calculating the moving average for volume; Right_Valu
THE SCALPER SIGNALS BUY AND SELL ENTRIES / REENTRIES , BASED ON THE PRICE ACTION OF BARS
IT HAS MULTIPLE MODES AS SELECTED , Which will provide different price action signals . The Signals are further filtered using Higher Time Frame Trend Analysis. For Example - (1) The Signals Of reversal points entries of the Higher Time frame can are plotted over any lower time frame , Giving robust signals (2) The Signal Of Lower time Frame - plotted only when the higher time frame is also in th

Ichimoku Map (instant look at the markets) - built on the basis of the legendary Ichimoku Kinko Hyo indicator.
The task of the Ichimoku Map is to provide information about the market strength on the selected time periods and instruments, from the point of view of the Ichimoku indicator. The indicator displays 7 degrees of buy signal strength and 7 degrees of sell signal strength.
The stronger the trend, the brighter the signal rectangle in the table. The table can be dragged with the mouse.
T

Clidro FX is a complete trading system designed and developed by Auxrum Analytics targeting the EURUSD, USDJPY, and GBPUSD FX pairs. It is currently available to MetaTrader 4 users. The Clidro FX algorithm, along with the optimized money-management and order-management rules sets up the basis for excellent trading results consistently over an extended period of time. The fundamental premise of the system is that each FX pair displays its unique quantitative characteristics while oscillating thro
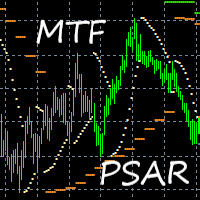
This indicator gives you the PSars for multiple time frames: M1, M5, M15, M30, H1, H4, Daily, Weekly, Monthly. Features Alert function for current Psar. Good results on M5. How to use: Download M1 history for testing. Hover over the different colors to see different timeframes. Simply attach to any chart. Take note of higher time frames before entering trades on lower time frames. (Zoom the H1/H4/Daily chart out completely) Sell when Multiple PSars cross above the price. Example: M1-M5-M15-M30-H

Sometimes we need convincing data to make sure our robot, or our indicator goes exactly the way it should be. Sometimes we find out that the data is inaccurate , it can be void , or it has the same data as the previous one . that is why sometimes we find a message on the screen " Waiting for Update ". The system is trying to refresh and reload the data.
The Refresh Charts indicator. This Indicator Utility will solve those problems with just one click . It will refresh and extract data from

Extended version of the indicator of the same name. Optimized work order. Added settings to the indicator menu for finding accurate signals. There are separate settings for Buy and Sell.
Scalper indicator designed for accurate entry into trade transactions. Designed for intraday and medium-term trading on any instrument. The indicator does not redraw and does not lag. There is the possibility of visual and sound notification of the appearance of a signal to enter. The indicator also sends sig
This indicator indicates trend with thick blue and red LINE based on Golden cross, Dead cross, and MACD. You can adjust the number freely in parameter settings(MA Period, MACD Value). Thus, you can adjust this indicator to your trading currency type, period, and so on. This indicator's default number is suited for USD/JPY M30 or H1 trade. This indicator's default number is set for USDJPY. So if you want to use this indicator with other currency pair, or time frame, please change it t

Trend and Signals indicator scans 30 trading Instruments (Forex, Metals and Indices). It uses special algorithm on the current market based on Pure Price Action and display the overall trend and signal on the dashboard. When signals are produced the indicator sends alert and notification. Strategy for Signals This indicator uses the daily timeframe to determine the direction of the trend. The hourly timeframe is used to identify possible entries. Main trend and is determined by strong Bull
This Indicator can help you to identify your entry. Enter when the arrow appears. The Indicator shows you as well the trend direction. you can see at the attached image the profit you would have made. If the trend goes against you it shows the minus pips. The Indicator is working on all frames and all pairs. Please consider carefully before you enter as the FX Market is unpredictable.

Akendicator X is a Non-repainting Indicator for trading at 5-15 minutes Timeframe. Akendicator X extimates with clear arrows, in which direction the next candlestick will move. Pratically, when the length of the last candle reaches and exceeds a particular value (called Candle Power) immediately, after its closing, an arrow appears indicating whether the next candle could be Bullish or Bearish. I created a manual in pdf where you should learn exactly how to use AKENDICATOR X correctly; I will s

SETIS TREND FILTER is a multi timeframe sophisticated MT4 indicator, created by french professionnal traders and quants experts , in order to detect the best trades for any markets (forex, commodities, indexes, stocks, cryptos and so on...)
Quantums France , is a french start-up, that codes advanced trading solutions, both for retails such MQL4 indicators but also python experts advisors for sophisticated investors.
This indicator does not repaint and actualize its functions in realtime .

LE Oscillator - индикатор предназначенный для поиска локальных экстремумов, определения текущей тенденции. В расчетах индикатора используется авторская методика. С помощью индикатора можно определять места возможного разворота цены желательно в направлении тенденции, но также с достаточной точностью и против нее. Также с помощью индикатора можно определять текущую тенденцию. Индикатор подходит для любых валютных пар, но для адекватного отображения показания необходимо, чтобы было достаточно ис
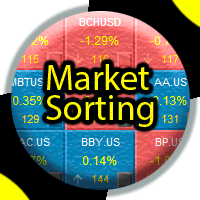
Индикатор производит поиск различных паттернов и сортировку рыночной информации.
Полученную информацию фильтрует и выводит на экран, обновляя ее с заданной периодичностью.
Имеется возможность сохранять собственные списки инструментов.
Имеет сортировку по:
названию инструмента; типу инструмента; по диапазону значений от N до M; выделенным в ручную маркерам;
Важно!!! Индикатор спроектирован так, чтоб была возможность
добавлять новые паттерны и значения для сортировки.
Если вам необход
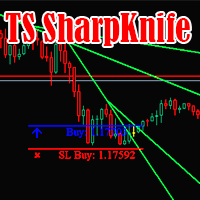
The SharpKnife trading strategy is formed into one indicator. The indicator informs with a message (Alert or mail) about the need to make deals.
Check it out in the strategy tester right now! Support: https://www.mql5.com/en/channels/TrendHunter The indicator is completely ready for operation immediately after installation.
Can be used on any trading instrument.
Recommended for use on timeframes 1H and higher. Settings: Signal Trend direction - Alert of the trend direction; Number of last

The Signal Point Channel indicator predicts the most likely short-term price movement based on complex mathematical calculations. One of the biggest challenges traders face is finding a trading system that's right for them. This indicator is designed to detect trends in price movement and allows you to quickly determine not only the direction of the trend, but also to understand the levels of interaction between buyers and sellers. It has no settings and therefore can be perceived as it signals.

The Analytical Trend indicator can track sustained price movement in a specific direction. In this case, the movement itself can be downward, upward or sideways, when the market movement does not have a pronounced direction. The indicator works on the basis of two moving averages and an oscillator. Using the signal search algorithm, the indicator generates signals in the form of arrows. Flexible settings allow you to receive more accurate signals for opening positions. You can quickly understan

Identify Take - trend trading strategy, market noise filtering and all necessary functions built into one tool! The system itself shows in the form of arrows when to buy and when to sell. Uses only one setting parameter. Simple, visual and effective trend detection.
The intelligent algorithm of the Identify Take indicator shows the points of a potential market reversal. Most often, a good trend can be seen visually on the price chart. But an experienced trader must clearly understand the curr
Telegram Channel & Group :https://t.me/joinchat/sdHZOjGc9V0xYjQ0
V.I.P Group Access: Send Payment Proof to our Inbox https://easypippin.com/ The Easypippin collector indicator gives u a indication of direction,based on several settings all put together to make it Easy to detect where the market possible is going to. The indicator gives u a X inthebox and a X , if u see them painting together the possible direction is strong. The indicator also can be used as a support and resistence zone.

The MA is a simple tool that smooths out price data by creating a constantly updated average price . The average is taken over a specific period of time. This is a Multi Time Frame Exponential Moving Averages indicator. It made for a M5 TF and shows a Moving Average data from H1 (white line) and M15 (magenta line). If a M15 EMA crossed a H1 EMA from bottom up then you may go Long. If a M15 EMA crossed a H1 EMA from top down then you may go Short.
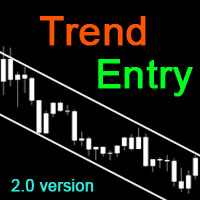
----< High Accuracy Entry Signals and Trend Indicator >----
TrendEntry could tell you the trend direction, resistance and support, when to open orders and where to set stoploss & takeprofit. this is a multifunctional indicator, can work well on all symbols and timeframes.
Features:
real-time analysis of trend direction filter out all the minor waves show resistance and support along as price goes give highly accurate entry signals frequently send alert in popup, email, notification way a
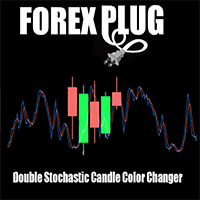
---------------------------------------------------------------------------------------- Double Stochastic Candle Changer ---------------------------------------------------------------------
Features Find overbought and oversold situations Trading always trading towards the trend *Non-Repainting* For Desktop MT4 Only *Great For Scalping *Great For Swing Trading *Arrow Entry Alerts *Mobile Alerts *Works On Any Timeframe *Works On Any Mt4 Pair
Basic Strategy Look for shorts when the price
Simply the " Wilder Exponential Moving Average " An exponential moving average with a somewhat different formula. It is one of the most common and widely used moving averages on various trading platforms. It can be used on all symbols, from forex to indices, it has a single parameter with a default value of 10 It can also be used within expert advisor, I hope it will be useful.
For metatrader 4 - MT4 version
There are 2 oscillator plots - fast & slow. Fast plot shows the price location with in the medium term channel, while slow plot shows the location of short term midline of cycle channel with respect to medium term channel.
Usage of this is similar to %b oscillator. The slow plot can be considered as the signal line. This makes use of the default 10/30 values of Hurst Cycle Channel, but may need tuning for your instrument.
This indicator can also be used t

Description
The Quantum Awesome Oscillator indicator is based on the standard Bill Williams Awesome Oscillator (AO) indicator. It has two parts. The lower part is a colored histogram of the oscillator (divided into two sides - above zero and below zero and, accordingly, colored in two colors - blue for buying and red for selling) and a trend curve line (shows the direction of the global trend). The upper part - arrows showing market entry points, as well as dashed lines showing Stop-Loss and T

Description
The Quantum Awesome Oscillator Pro indicator is based on the standard Bill Williams Awesome Oscillator (AO) indicator. It has two parts. The lower part is a colored histogram of the oscillator (divided into two sides - above zero and below zero and, accordingly, colored in two colors - blue for buying and red for selling) and a trend curve line (shows the direction of the global trend). The upper part - arrows showing market entry points, as well as dashed lines showing Stop-Loss a
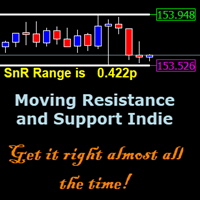
Moving RnS Indicator is created for many functions which is highly useful for the traders. It is a versatile tool that can make whole lots of difference in a trader's trading career. If the best must be gotten from this tool, the trader must study the way it works especially as explained here and more can be discovered because of its functions. It can also be used along with other indicators but if understood well, it can be used alone to get good results.
When attached, it starts moving acc
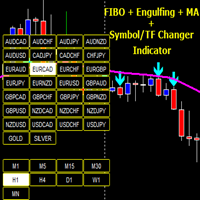
Fibo Engulfing Changer Trading System
Fibo Engulfing Changer Trading System is a great indicator created to locate an engulfing candle on the Chart with the aid of an Arrow and Popup alerts system. For accurate working of an engulfing candle based on market structure, it must be used with an Moving Average but we discovered that Moving average is subjected to individual trader's preferences, therefore it has been coded in a way that the Trader can choose MA he/she desires with a preferred PER
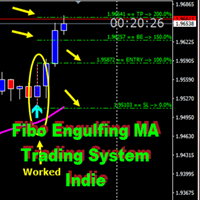
Fibo_Engulfing_Trading_System
Fibo_Engulfing_Trading_System is a great indicator created to locate an engulfing candle on the Chart with the aid of an Arrow and Popup alerts system. For accurate working of an engulfing candle based on market structure, it must be used with an Moving Average but we discovered that Moving average is subjected to individual trader's preferences, therefore it has been coded in a way that the Trader can choose MA he/she desires with a preferred PERIOD, SHIFT, METH
An indicator to draw a graph of account current and historical state such as Balance, Equity, Margin, Free Margin, Margin Level, Drawdown, Account Profit, Deposit and Withdrawals.
Indicator Inputs : Draw Balance Graph Draw Equity Graph Draw Margin Graph Draw Free Margin Graph Draw Margin Level Graph Draw Drawdown Graph Draw Account Profit Graph Connect Gaps by Lines Sign of DDs on Profit Sign of DDs on Loss
Tips : The Indicator will draw historical balance graphs and deposit/withdraw arrow

The indicator displays a stock chart of a non-standard type, in which the price and time have the same value.
The usual chart of Japanese candlesticks does not take into account all the information that the time analysis can give. Renko charts do not use all the information that price can give in relation to time. The "Chart Price and Time" indicator takes into account price and time equally and shows the predominance of price or time.
Taking into account price and time equally gives an i
The MetaTrader Market is the only store where you can download a free demo trading robot for testing and optimization using historical data.
Read the application overview and reviews from other customers, download it right to your terminal and test a trading robot before you buy. Only on the MetaTrader Market you can test an application absolutely free of charge.
You are missing trading opportunities:
- Free trading apps
- Over 8,000 signals for copying
- Economic news for exploring financial markets
Registration
Log in
If you do not have an account, please register
Allow the use of cookies to log in to the MQL5.com website.
Please enable the necessary setting in your browser, otherwise you will not be able to log in.