Watch the Market tutorial videos on YouTube
How to buy а trading robot or an indicator
Run your EA on
virtual hosting
virtual hosting
Test аn indicator/trading robot before buying
Want to earn in the Market?
How to present a product for a sell-through
Technical Indicators for MetaTrader 4 - 95

Hello Traders, A very simple but useful tool for an automatic traders. An indicator that allows you to adjust the speed of the strategy tester in a very simple way. Just drag the indicator into the chart before launching the strategy tester and adjust the speed manually, and that's all! Buttons can be located in any part of the chart as you like, just enter the x and y coordinates --------------------------------------------------------------------------------------------------------------------
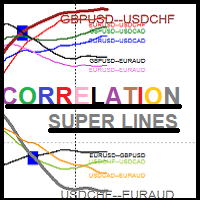
SUPER Correlation Lines for Symbols Multi timeframes Multi Currencies Indicator Each line indicates 2 symbols correlation based on Multi timeframes symbols strength calculations
5 symbols -> 10 correlation indicator lines Strategy:1 is based on selecting the NEW weaker/stronger correlation line : *****New Weaker Line Crossing DOWN the old weaker line : SELL SYMBOL1 && BUY SYMBOL2 *****New Stronger Line Crossing UP the old weaker line : BUT SYMBOL1 && SELL SYMBOL2
You close trades when

Perfect Entry Spotter Indicator with Alert is based on a combination of Support Resistance, Fractals, Alligator and Moving Average indicators, based on an intense research. It has alert included with option to enable/disable it. You can trade based on it with high accuracy. Recommended trading rules: 1. Buy - Wait for the Lime arrow to appear and trade in the direction of the trend (trend going up). 2. Sell - Wait for the Red arrow to appear and trade in the direction of the trend (trend going d

This indicator is customizable to whatever settings you preferred
you only buy above the ema, and sell only under the ema using the stochastic as an entry and the ema to filter bad trades DEFAULT SETTINGS: Stochastic(8,3,3) EMA (200) *Non-Repainting
*For Desktop MT4 Only
*Great For Scalping
*Great For Swing Trading
*Arrow Entry Alerts
*Mobile Alerts
*Works On Any Timeframe
*Works On Any Mt4 Pair
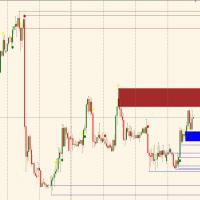
It automatically tracks the supply and demand zones and indicates the current trend. Once you have identified the trend on the main time frame just wait for the price on the operating time frame to arrive in the near future of a demand (buy) or supply (sell) zone and execute the trade. It is recommended to wait for the higher time frame trend and operational time frame to be aligned and operate exclusively on the areas indicated by the. Developed the right awareness you can achieve more and more
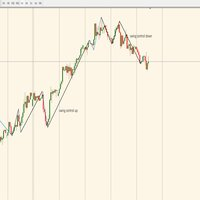
Indicator automatically translates control swings (trend-dominated market) and correction swings (retracing market); It is a simple indicator to be combined with your strategies in order to improve them and enter the market only when the trend is in control; Check on the largest time frame how the market is moving (swing black color control or swing blue color correction) from here, going down from time frame to set its operation in the direction of the trend. OPERATIONAL EXAMPLE: LOCATE DOWNWAR

We Trade Live Trend Max 500-1000 Pips Our team of engineers have programmed a great tool which we have used to success and will aid you in making better decisions when placing a trade, it is better than anything available on the market at the moment! try & Test Against other products and see for yourself how amazing this is. Our Main Objective is to help you as traders discover how you can take a simple trading setup and make consistent profits. We provide the fundamentals needed to trade the ma

We Trade Live Trend Levels This indicator is a fantastic addition to the We Trade Live Trend Max this helps filter out noise and helps with better entries into a trade this add on is a must have and we use it all the time along side We Trade Live Trend Max this is a fantastic tool to help with entering a trade and exiting a trade, This indicator Calculates Volume strength indicating levels of support and resistance for a trade, measures momentum in a market making buying or selling into the

This indicator identifies the major and minor swing high and low points on a chart. It then takes the most recent swing and draws a fibonacci pattern of retracement and extension levels to give you an idea of where price may move next. It allow allows you to set a pair of moving averages to help identify the direction of the overall trend. There are configuration parameters for the major and minor swing and the moving averages.

indicator for binary options the signal appears along with the opening of a new candle and signals it complete lack of redrawing recommendations buy signal blue arrow pointing up sell signal red arrow pointing down expiration time and recommended 1 candle of the timeframe used if the trade turns out to be unprofitable, you can increase the amount and open the trade again on the next signal the instrument is easy to set up, only two periods Optimal settings are already set by default the indicato

LinearRegressionDecomposition ( LRD ) Linear Regression Decomposition has been calculated using a very complex method.
Basically, by examining the retractions of the price movements of the instruments on the Metatrader platform, it is aimed to decompose these movements linearly.
The indicator is shown on the graph with two separate lines.
The red line is our main indicator and handles the price divergence.
The blue line filters the red signal.
For example, for a buy signal to occur: the red

After Purchase, Please Contact
t.me/hakimsann
These Indicator are Mixed on All Logical Value Such As
Trend
Support and Resistance
Candle Pattern
Price Action
we Combine
2 Bollinger Band
6 Zigzag Periods
4 Relative Strength Index Period
1 MACD Trend
Support and Resistance
Price Action
Pattern Candle
Avoiding Doji On Market Can Be Applied On Every Market
24-7
Maksimum Martingale lv 5.
First stake 0.4% Balance

Murrey Math Multi Timeframe Indicator Support/Resistance
Murrey Math Lines are strong tools to plot the support and resistance levels.
Murrey Math Multi Timeframe Indicator draws multi timeframe MM lines on a smaller tf chart.
General Information: According to Gann, prices move in 1/8's, these 1/8's act as points of price support and resistance as an entity's price changes in time. Given this 1/8 characteristic of price action, Murrey assigns properties to each of the MML's in an a given

The Velocity of price change ( VP ) indicator shows the average rate of price change at those characteristic time intervals where this rate was approximately constant. The robust algorithm used in VP to smooth out the price from its random jumps, ensures the reliability of the indicator reading, which does not react to simple price volatility and its insignificant movements. The indicator allows you to track trends and the moments of their reversals , during which t

Koala Trend Line Introduction : I made this indicator to help traders find trend better, this indicator can show you current trend line.
As you know trend line must draw between 2 highest or lowest points.
So the main logic is to find highest and lowest points. Indicator find all highest and lowest points in history and show them by red and blue dots.
These highest and lowest points calculated according to depth value. depth value is adjustable , and user can change it.
What does depth mea

The ATR Levels Indicator For MT4 is an indicator that is built specifically for traders who use the Meta Trader 4 for their trading analysis, charting of different currency pairs and trading assets, doing their technical analysis and making trading decisions all through the trading day as they work.
One of the first major advantages of using the ATR Levels Indicator For MT4 is that it automatically helps the trader to spot very important levels in the markets based on the Average True Range In
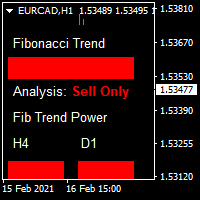
Our buy and sell indicator provides precise entry points, guiding you on when to buy and sell while indicating the trend bias. This tool minimizes drawdowns and increases your winning percentage by aligning with the trend. Buy signals are represented by blue boxes alongside candles, signaling optimal entry points. Conversely, red boxes indicate sell signals. Additionally, the secondary indicator, Fibonacci trends, further enhances decision-making by complementing the primary signals.
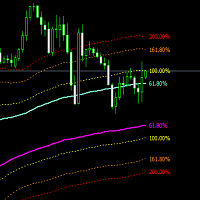
DYNAMIC CHANNEL Forex is a Metatrader 4 (MT4 (MT4)) indicator and the essence of this technical indicator is to transform the accumulated historical data. Forex DYNAMIC CHANNEL Indicator provides for an opportunity to detect various peculiarities and trends in price dynamics which are invisible to the naked eye. Based on this information, traders can assume further price movements and adjust their strategy accordingly.
Dynamic channel, which is calculated based on the maximum distance between

What Is Currency StrengtT Indicator?
A currency strengthT indicator is a graphical tool that shows the strength of a currency. Common indicators usually show the strength of a currency in relation to another currency, however, with some calculations it is possible to find the absolute strength of each individual currency.
Therefore, a currency strength matrix indicator (or meter) is a tool that tries to express the absolute strength of a currency, so that you can compare this strength with
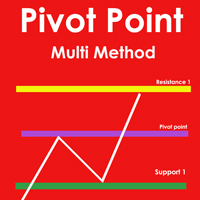
Pivot Point Multi Method is a fully automatic pivot point indicator and indicate support and resistances (S1,S2,S3,S4,R1,R2,R3,R4) based on four Methods that you can select on of them Pivot point detection and drawing support resistances Methods( Classic ,Camarilla ,Woodie ,Fibonacci)
Pivot Point Multi Method is working on all time frames and all currency pairs and gold silver and crypto currencies .
Recommended Setting : Pivot_Method select one of the methods ( Classic ,Camarilla ,Woodi

The trading system is designed to work with gold on time periods: 30M, 1H. The indicator allows you to adjust to the market situation.
Parameters for 1H : PERIOD=9F , FILTER=300 .
Parameters for 30M : PERIOD=22B , FILTER=450 .
A small adjustment to a specific broker is allowed .
If you change the amount of history displayed, you may also need to adjust the parameters.
The indicator is not redrawn.
"Gold n XAU" uses different rules for entering a trade and different ru
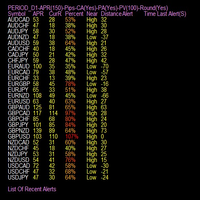
Indicator is able to alert by pop and acoustic alarm the achievement of the average price range of the last periods so as to be able to set our operation. It allows different percentage variables reached and periods of variation according to the parameters entered. Apply your reverse strategies to achieving that threshold so you get higher success rates. Indispensabile per le strategie reverse intraday.
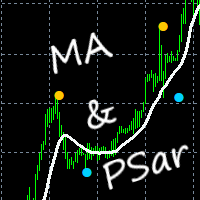
This indicator gives you PSar crossings in the form of blue and yellow dots on the chart, as well as a Moving Average. Parameters: MAPeriod (Change to your preference) Alerts PSarStep PSarShift PSarMaximum How to use: Simply attach to any chart with default settings. Sell on yellow dots, with white MA line above price. Buy on blue dots, with white MA line below price. Best results when checking the higher time frames before entering trades. Best results on Major Pairs, but can also be used on o

The Cauchy distribution is a classic example of a fat-tailed distribution. Thick tails indicate that the probability of a random variable deviating from the central trend is very high. So, for a normal distribution, the deviation of a random variable from its mathematical expectation by 3 or more standard deviations is extremely rare (the 3 sigma rule), and for the Cauchy distribution, deviations from the center can be arbitrarily large. This property can be used to simulate price changes in th

!!!!UPDATED VERSION!!!!
Multi Currency Strength Indicator is the ultimate simple multi-currency strength dash meter that consists of Signal provider and automated labelled levels, that is effective for beginners and seasoned traders to enhance their strategies. The Author coded the program for the aim of bringing simplicity yet effective indicator that is user-friendly for all who use it. Try it out , its worth a try. INDICATOR INCLUDES: 1.Push Notification to get notifications on MT4 App o

This indicator XX Power indicator.Indicator displays trend movement. Indicator helps to buy and sell.In dicator displays arrow and line. Features
FiltPer - displays indicator period.
How to understand the status: If the Trend color is green, trend is up. I f the Trend color is red, trend is down.
//////////////////////////////////////////////////////////////////////////////////////////////////////////////////////////////////////////////////// ///////////////////////////////////////
Start Signal is one of the most reliable tools for trading in the financial markets With the help of Start Signal, you can trade both Bnary Options and other markets Such as Forex Initially, Start Signal was developed for Binary Options But during the trading, it was decided that it is also well suited for scalping Moreover, it provides good accuracy Perfect for both beginners and experienced traders The signals are extremely simple and straightforward You don't need to analyze a lot of infor

the indicator is designed for trading in financial markets for scalping, pipsing the tool uses support and maintenance levels in its algorithm own strategy and unique development signals up arrow buy down arrow sale recommended for use on timeframes up to 15 m you can trade from signal to signal pay attention to the transaction no more than 2% of the deposit.
A good and reliable tool if you follow the rules of money management Developed according to its own strategy on a unique algorithm The indicator is completely sharpened for binary options Binary Luck is very easy to use, nothing needs to be configured Just add to the chart and you can start trading Perfect for both beginners and experienced traders Signals are simple and straightforward Up arrow buy Down arrow sale Recommended time of expiration and 1 candle For one deal no more than 3% of the d

We Trade Live Trend Candle Stick can help identify potential trend in the market when trading, spot market trends and predict future prices. We Trade Live Trend Candle Stick has a smoother look, as it is essentially taking an average of the movement. candles will stay RED during a downtrend and Green during an uptrend . We believe It's useful for making candlestick charts more readable and trends easier to analyse. As a breakout trader you are looking for trades that are ‘breaking out’ of
As a trader you are looking for to enter trades at the perfect time. This indicator takes advantage of any price action and indicates when a certain level has been made and a potential break out is going to be made. THIS IS BEST USED ON THE 1DAY CHART WITH WE TREND LIVE MAX Check LTF (Check Long time frame) feature added to 5mins , 15mins, 30mins 1hr & 4Hr chart which will check the trend on all frames times in particular the 4hr trend. so if a alert is received to buy or sell and the trend is

Definition : VPO is a Volume Price Opportunity. Instead of using bars or candles with an Open, High, Low, and Close price, each "bar" in a Market Profile is represented by horizontal bars against the price It is called Market Profile terminology.
In other words volume-price-opportunity (VPO) profiles are histograms of how many volumes were traded at each price within the span of the profile.
By using a VPO chart, you are able to analyze the amount of trading activity, based on volume, for eac

Fibonacci Magic Pivot Levels The Fibonacci Magic Pivot Levels is a powerful yet easy to use indicator . It continuously monitor s intra-day price action and uses complex algorithms to calculate and detect key support, resistance and pivot levels, using the D1 timeframe as a filter. The Fibonacci Magic Pivot Levels is optimized for H4, H1, M30, M15, M5 & M1 timeframes and can be used on ALL Currencies, Indices, Commodities, and Cryptocurrency pairs . Trade with improved confidence an

This indicator is a must have tool that scans the active chart for candlestick patterns. It labels each bar according the candlestick pattern(s) that it finds enabling you to more easily analyze price action and be more informed about your trading decision. There are 103 common and uncommon possible patterns plus 6 new patterns based on research that the indicator can identify. If a candlestick(s) meets the requirements for multiple patterns, the bar will be labeled with up to 4 patterns names f
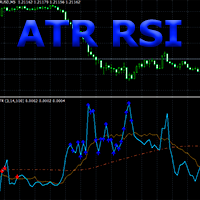
Composition of ATR and RSI indicators.
The ATR RSI indicator compares two calculations of the ATR indicator with the Fast and Slow periods on one chart, plus the line of the average and the overbought and oversold zones of the RSI indicator.
ATR shows the values of the volatility change in the currency pair in points, taking into account the period specified as a parameter. The entry points provided by the RSI indicator show a very good risk-reward ratio in volatile and trending markets. ATR

Follow a step-by-step system that detects the most powerful breakouts!
Discover market patterns that generate massive rewards based on a proven and tested strategy.
Benefits You Get On Indicator: Unique price action based algorithm. Powerful combination to any trading strategy. Auto-detects entry, exit, stop loss & take profit levels. Auto-calculates statistics of signals. Never repaints, never backpaints, never recalculates. Signals strictly on the "Close of the bar". Works in all symbol

XMaster Scalping NEW - a simple indicator that determines the beginning and end of a trend. It can be said very well, even ideal for both scalping and medium / long-term trading. When plotted on a chart, it is located in the basement, which gives you the opportunity to draw trend lines / levels on the price and look into the basement at the indicator.
How to use: It's simple. Sale yellow, buy green. The colors can be changed in the settings.
Additional trading information: Works bes

The indicator helps the trader in identifying potential liquidity levels. The algorithm used in this indicator checks the behavior of the asset taking into account the price levels, momentum and volume analysis.
Features:- Parameters for signal optimization and alerts.
Usage:- The levels formed by the indicator can be helpful to traders in identifying potential entries, breakouts or reversals. it can assist traders of technical trading background or even pure price action trading. Examples o

This indicator shows a candlestick combination based on dodge, dodge and pin-bar. This combination is similar to fakes, but has a different logic. The logic is to be on the side of the force after the uncertainty. It has proven to be effective. You also get a quick guide to using the indicator and my almost 24/7 support. The indicator is universal and useful for trading binary options (you will receive additional rules on this issue), forex, ETF, cryptocurrencies and much more. Supports timefram
Indicator for Binary options Binary Dream Trader Expiration time and 1 candle Timeframes from m1 to m15 No redrawing Any money management can be used If it is a martingale, the profitability will increase It is not recommended to use Martingale on a small account Signals Blue up arrow buy signal Red down arrow sell signal It is recommended to avoid trading during strong news releases

All Candlesticks Library is an indicator that provides an intelligent Pattern Recognition system with a REALLY WIDE RANGE of candlestick variations! There are over 100 candlesticks patterns, from common doji and consolidation variations and series of well-known momentum and breakout candles to rare patterns we don't see everyday.
PLUS, it comes with(NOT 100% ACCURATED, yet fair enough) Statistics ! You can choose either you see it, the candlesticks ,both or none of them, change the
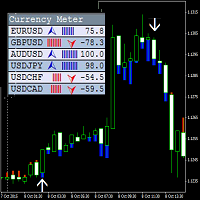
Данный индикатор рисует на графике стрелки, которые являются сигнала на вход и выход из сделки, а также в качестве фильтра индикатор окрашивает каждую свечу в синий и красный цвет. Дополнительно ко всему в левом верхнем окне показывается сила тренда и его направление по основным парам. У индикатора новая логика, которая существенно отличает его от множества аналогов. Он дает ранние сигналы на вход и на выход, свои значения не перерисовывает — то есть, если индикатор дал сигнал на вход в сделку,

The Perfect Supply & Demand Indicator for the MetaTrader 4 Platform ! It comes packed with the following features...
Supply & Demand Zones
The indicator charts Supply & Demand Zones on your favorite profiles. It works on all time frames and in all markets. Fresh & Used Zones
The indicator color codes each zone so that you know if it's fresh or not.
When the zone is no longer fresh it changes color, indicating that price have already traded at the level once or multiple times before. Stru
Being flat is a position taken by a trader in Forex trading when s/he is unsure about the direction of currencies trading in the market. If you had no positions in the U.S. dollar or your long and short positions canceled each other out, you would be flat or have a flat book
A flat market is one where there is little price movement; the market typically trades within a tight range, rather than forming a clear up or down trend. This indicator shows potential fl
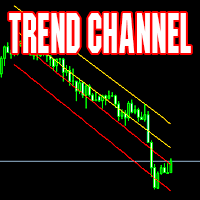
Channel indicator. Calculated dynamically. Suitable for both working in the direction of the trend and inside the channel. Excellent results when working on timeframes from 4H towards the center of the channel.
Example of use: when the price touches one of the extreme lines - opening a deal in the center of the channel with a take profit on the nearest middle line of the indicator. MT5 version The indicator can be used in expert advisors (4 buffers), receiving data in a standard way. Support:

The indicator determines the most important component of any trading system - the possible exit point from the transaction.
As the price moves, depending on the market situation, the indicator builds goals. The target becomes relevant when the price starts moving towards the target. If the movement is strong, then it may take a certain number of targets to stop or reverse price. The accumulation of targets is most likely able to stop the price. Some goals are executed several times.
But the

Multi Information Panel designed to give alot more precision to both trade entries and exits and provide an instant snapshot of a currency pair’s movement. Multi Information Panel works on any currency or timeframe (or it should) and displays the following in the bottom right corner of the chart..
A graph of Stochastic Oscillators on timeframes M1 up to D1. An indication of the market trend using EMA’s on timeframes M1 to D1. The direction of the MACD on the current chart, and crossing of the

Volume, momentum, and market strength are key indications that price is about to move in a certain direction. The Volume-solution indicator is one indicator which can help traders objectively classify a momentum type of trade setup as one having volume and strength or not. What is the Volume-solution Indicator? The Trading Volume indicator is a custom technical indicator which works somewhat like a market sentiment indicator. It indicates the strength of the bulls and the bears of the market. Wh

A universal tool for determining trends, flats and trading on graphical patterns. Combines the techniques of Gan, Elliot, and Murray. Just place it on the chart and it will show the direction and speed of the price movement, highlight the turning points.
Maltese cross will help you accurately determine the key points in the history, plan trading actions and accompany open transactions. Basic principles
Maltese Cross displays the Trend, Flat and Impulse lines before and after the selected mom
This indicator calculates support and resistance prices in multi-timeframe with different formulation and draw them on the chart that style do you choose. And If you want, Indicator can alert you when the current price arrive these pivot levels. Formulations: Classic, Camarilla, Woodie, Demark, Floor, Fibonacci
Alert Options: Send Mobil Message, Send E-mail, Show Message, Sound Alert
Levels: PP, S1, S2, S3, S4, S5, R1, R2, R3, R4, R5, TC, BC and Middle Points Why do you need this indicator:

Action Alert indicator generates and writes data on the chart when performing any modification to the dead process. Expertise Properties: An audible alert is issued in the name of the operation and the labor that has been made You only need one chart Writes the processed operations in clear handwriting The font color can be controlled on the chart Setting Action Alert indicator
What is meant by it is to alert me any change in my deals of , it will reverse if any new deal comes out, a
The Better Volume indictator improves the comprehension on volume by coloring the classical histogram bars . The colors point out differents nature of volume . Further through two buttons and without change the main chart it is possibile to change the time frames and navigate among three symbols . The alerts will work accordingly. For each symbol can be choosed the LookBack and Ma periods . The possibility to show/hide the indicator allows you to focus on the price .
The subwindow can be hid
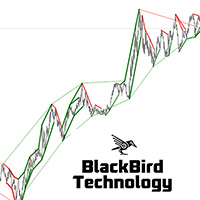
Multi Level Trend Direction is an indicator that identifies the most accurate buy/sell swing points with the highest probability, based on multi-level Zig Zag Swings. The indicator draws a color Zig Zag at the Higher Highs, Higher Lows, Lower Lows and Higher Lows in the chart, but based on two level Zig Zag Swing. If the fast price swing is in line with the trend of the slow price swing, then the buy/sell trend lines are bigger. If the price swing is against the trend, no lines are drawn to si

We present a unique product for analyzing the effectiveness of arrow indicators! With it, you can process the signals of any arrow indicator, find out their effectiveness , collect statistics on successful signals , and select the best parameters — all these features are included in the settings!
The indicator works with the signals of the arrow indicators, forming signals from them. Arrow Trade collects signal statistics: the tableau displays the number and percentage of successful and unsuc

The MA Bounce Strategy is a strategy that seeks to long FX pairs on a strong uptrend as they bounce off their MA support and shorting FX pairs on a strong downtrend as they bounce off MA resistance. The best suitable periods of moving averages for that strategy are 18, 30, 50. This indicator helps to identify and find place for potential market entry by MA bounce strategy. Read More information about MA Bounce Strategy . By default MA Bounce Strategy indicator is configured for trading of M1

This is a volume profile where you can customize the time period you want. You can do this with a line or choose automatic functions such as showing the volume from the last time period. The indicator also shows the maximum volume value (VPOC - VOLUME POINT OF CONTROL) and the average value, colors and settings you can adjust as you like, there are many possibilities. If you need an indicator that shows the constant volume time frames there is ...HERE... Volume Profile is an advanced charting
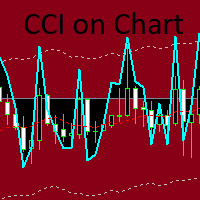
CCi indicator with dynamic levels based on the standard MA, taken as the basis for reading the levels, and modified data of the standard CCi relative to the MA. The input parameter CutCCi, if greater than 0, limits the vertical drawing of the CCi graph, but does not affect the calculations. There are 3 options for displaying arrows: arrows when crossing levels to exit the level zone - trend, arrows to return after exiting the level zone - reverse and crossing the zero level (red MA line). You ca
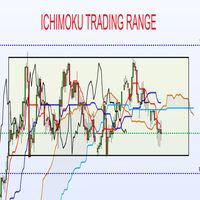
scanner de gamme commerciale Ichimoku: ne manqué plus le début d'une gamme. capable de suivre plusieurs paires cet indicateur surveille: les croisements de SSA et SSB (cela indique une forte possibilité de la mise en place d'un range) il identifie les bougies de retournements Il vous alerte quand les deux éléments apparaissent (croisement + bougies). vous pouvez ajouter le filtre du stochastique, ainsi l'alerte se fera seulement s'il y en compétemment le stochastique en surachat ou survente 80/

Concept of Market Profile was created at Chicago Board of Trade (CBOT) by trader Peter Steidlmayer and first published during the 1980s as CBOT product. Market profile by itself is not a stand-alone strategy, but a different way how you can view the market and make better trading decisions.
They have seen a market as an auction process which is affected by supply and demand the same way as every other auction, for example, development of prices of food, gas etc.
The price goes up as long

The indicator builds "psychological levels": levels of round numbers and intermediate levels of round numbers.
Round numbers play an important role in forming support and resistance levels. There is a pattern in which the decline or growth of the price can stop at round numbers.
The level whose price ends at 0 is the level of a round number of the first order. Intermediate level, this is the level between two round levels, for example, between 10 and 20 this is level 15.
In the " Num_Zero
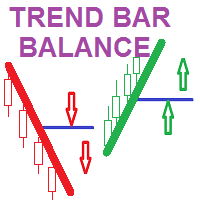
Trend Bar Balance Indicator Simple indicator based on trend detection and support resistance breakage It detects the major trend and the minor support and resistance levels *** a signal for UP /BUY is detected and alerted in a BULL trend and a resistance level break *** a signal for DOWN /SELL is detected and alerted in a Bear trend and a support level break THE POWER OF THIS INDICATOR I USE IT WHEN YOU COMBINE ITS DAILY SIGNALS FROM DIFFERENT CHART SYMBOLS AT SAME TIME AND CLOSE ALL ORDERS BY

DESCRIPTION: The theory of the indicator is that currencies that are traded in the European session sleep at night. And when they wake up, they go to the golden mean of Fibonacci, their own way.
At night, a channel is formed from which they want to get out, in the morning with renewed vigor on the road. The upper level of the channel is the buy zone.
The lower level of the channel is the sell zone. The objectives of the hike are marked with colors at the top and bottom.
The indicator outp

Many forex traders spend their time looking for that perfect moment to enter the markets or a telltale sign that screams "buy" or "sell". And while the search can be fascinating, the result is always the same. The truth is… there is no guaranteed way to trade the forex markets. As a result, traders must learn that there are a variety of indicators that can help to determine the best time to buy or sell a forex cross rate. Our indicator definitely does this! This strategy is created by traders fo
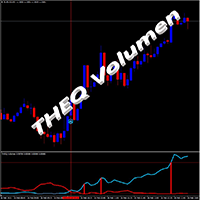
THEQ Volume is a volume oscillator. Trade following trends or possible reversal. THEQ Volume also includes THEQ Volume Arrows, indicator with signals and alerts, and THEQ Volume EA for real / demo, backtesting and optimizing or make your own strategy. Additional indicator and Robot EA are shipped separately after payment. THEQ Volume does not repaint, has no lag and the signals never disappear when the candle closes. It also has a pre-signal to be ready and get into the market fast. You will hav
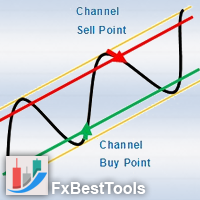
Channels Indicator is an All-In-One Indicator with a powerful calculation engine. The Indicator contains 4 different and usual methods for finding channels on the market. Indicator is powered by a visual interface and with various selections of alerts and notifications.
Testing Indicator : Strategy Tester does not respond to your clicks on panels (This is metatrader tester limitation). Thus input your desired settings on the indicator pre-settings and test.
Using Indicator :
Display
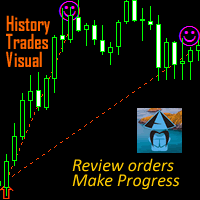
Name: History Trades Visual Purpose: Show history orders' open&close time&price ,drawing the route. You can review the trades, help analyzing and getting progress. Advantage: Easy to use, small and stable, no interference with other indicators and objects on charts.
Step of using: 1. List the history orders in account history page in MT4. 2. Click this indicator from the directory, then the history traders will be shown in the main chart for current symbol. 3. For better visual display acc

This indicator, Bull Bear Easy MTF, summarise the strength color graphic and percentage of power for both Bull and Bear in current market emotion stage which will show you in multi time frames and sum of the total Bull and Bear power strength which is an important information for traders especially you can see all Bull and Bear power in visualized graphic easily, Hope it will be helpful tool for you for making a good decision in trading.

Индикатор Trading Strategy призван помочь трейдерам в поиске оптимальных входов в сделку и выходов из неё. В его основе лежат показания технических индикаторов (MA, RSI, ATR и др.), а также авторский алгоритм, связывающий их сигналы в единое целое. Индикатор даёт сигналы на покупку и продажу в виде стрелочек: стрелочка вверх — сигнал на покупку, вниз — на продажу. В правом верхнем углу показаны сигналы индикатора на 6 таймфреймах (M1, M5, M15, M30, H1, H4) данной валютной пары.
Индикатор с

This indicator Matrix X indicator.Indicator displays Stochastic oscillator,Williams Percent Range,DeMarker,Relative Strength Index,Matrix trend movement. Indicator helps to buy and sell.Matrix trend = (Stochastic+WPR+DeMarker+RSI)/4. Features
KPeriod - displays Stochastic K period. DPeriod - displays Stochastic D period. Slowing- displays Stochastic Slowing. Stochastic_Method - displays Stochastic Method. Stochastic_price - displays Stochastic Price. WPR_per - displays WPR period. Dem_per - dis

The Objective indicator can be viewed as a complete trading system. The indicator analyzes market dynamics for pivot points. Can be used as a channel indicator or level indicator!
The principle of operation of the indicator is to automatically determine the current state of the market when placed on a chart. Shows favorable moments for entering the market in stripes.
This indicator allows you to analyze historical data and, based on them, display instructions for further actions on the trad
Do you know why the MetaTrader Market is the best place to sell trading strategies and technical indicators? No need for advertising or software protection, no payment troubles. Everything is provided in the MetaTrader Market.
You are missing trading opportunities:
- Free trading apps
- Over 8,000 signals for copying
- Economic news for exploring financial markets
Registration
Log in
If you do not have an account, please register
Allow the use of cookies to log in to the MQL5.com website.
Please enable the necessary setting in your browser, otherwise you will not be able to log in.