Watch how to order a trading robot
Read the Rules before you post an order or execute it
How to Order a Trading Robot in MQL5 and MQL4
See a sample Requirements Specification to order a robot
New orders in the category:
30 - 100 USD
300 - 1000 USD
30 - 40 USD
30 - 50 USD
30+ USD
Job finished
Execution time 53 days
Feedback from employee
Stay away from this customer
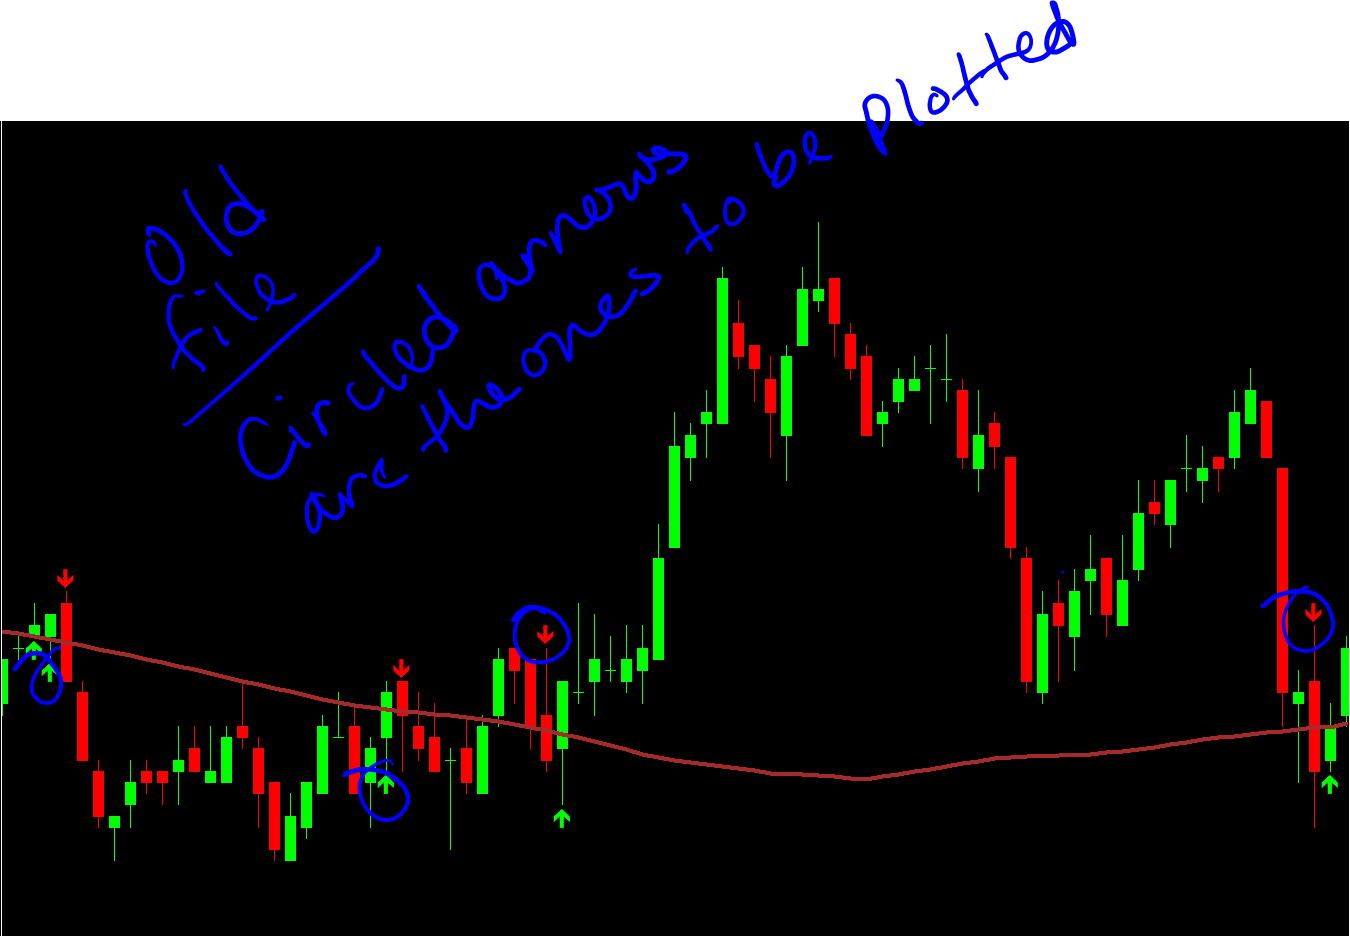
Specification
I need to label the chart with an up or down arrow if the moving average intersect within the body of the candle.
the arrows should be plotted every other intersection within a day
Responded
1
Rating
Projects
103
20%
Arbitration
6
0%
/
83%
Overdue
3
3%
Free
2
Rating
Projects
623
33%
Arbitration
29
72%
/
7%
Overdue
19
3%
Free
3
Rating
Projects
53
17%
Arbitration
7
0%
/
100%
Overdue
5
9%
Free
4
Rating
Projects
30
63%
Arbitration
0
Overdue
4
13%
Free
Published: 1 code
5
Rating
Projects
1456
63%
Arbitration
21
57%
/
10%
Overdue
43
3%
Free
6
Rating
Projects
138
41%
Arbitration
30
7%
/
77%
Overdue
17
12%
Free
7
Rating
Projects
149
31%
Arbitration
32
34%
/
41%
Overdue
43
29%
Free
Similar orders
Hello, Hope you are doing well. I need urgent help with a project, and if done successfully, there will be long-term work available. Requirements: Accurate POC Calculation: Identify the POC (Point of Control) as the price level with the highest traded volume within a selected session or time range. Allow users to select volume source: trade volume, tick count, or bid/ask volume. Correct Value Area Calculation (68%)
Very important note \ You must provide a working prototype that can be tested for 3 days before choosing you as a developer or giving you the project to ensure that you fully understand the terms of work (so that no type of disagreement occurs) \ It does not redraw itself \ It hangs on the M1 time frame \ Its signals appear exactly with the beginning of the candle (not late)
Hello to all, I'm looking for a coder that has a great attention to details and is able to code me and EA that works on anytime frame chart.. For example H4 chart, currencies, indices, stocks, or commodities using a fast MA (e.g. 20) crossing a slow MA (e.g. 120) as its core signal, with optional confirmation filters (RSI levels and H4 candle breakouts). It must be fully configurable with MA periods, ATR settings
I need a modification of the standard Donchian indicator that is already included in the MT5 terminal (I can provide you with the source code; alternatively it can be found in the Data Folder at MQL5\Indicators\Free Indicators). I want it to draw a cross and a box (a horizontal line and a vertical line at the point of candle close, as well as a box around the crossing point [see image "Example 1" attached]; thickness
I have a purchased MT4 custom indicator (Rapid Trend.ex4) located in the Market folder: MQL4 > Indicators > Market > Rapid Trend.ex4 I want to create a new custom indicator ( iCustomRapidTrend.ex4 ) that: Uses the original Rapid Trend indicator via iCustom with path input: Market\\Rapid Trend.ex4 Adjusts the width and size of the lines and arrows (Green/Red lines: width 2; Up-arrow Blue and Down-arrow Magenta: size
Create an Arrow indicator for me
30+ USD
Hi coders, Please i need an indicator created from different indicators and if it's fine, i wil appreciate, will really appreciate. Please i need only professional programmers. If you are very good, will select you immediately
LOT SIZE WITH MULTIPLIER WHEN INITIAL TRADE ENTERED WHEN PARABOLIC REVERSES IT SHOULD NOT CLOSE OPEN ENTRY AND DO HEDGING AS FOLLOWS: PARABOLIC BUY MOVING AVERAGE BUY OPEN TRADE BUY 0.01 WHEN PARABOLIC REVERSE AGAIN ENTER SAME LOT & HEDGE THE POSITION 0.01 SELL WHEN AGAIN PARABOLIC BUY ENTER IF MULTIPLIER IS 2 THEN 0.02 BUY AGAIN PARABOLIC SELL 0.02 AS SO ON.. AS BELOW EXAMPLE.. First Buy: 0.01 Reverse → Sell: 0.01
Hello, I wanted to modify a Zig Zag indicator and make it better. The zig zag indicator is basically running on percentage reverse rather than pipe amount. For example: a signal appears when the market has reached a certain percentage. This is creating many false signals especially when its slow or fast movement. It also misses a lot of highs and lows. I believe the solution is to remove the percentage function
Project Name: Automatic Trend Channel and Bounce Detection Indicator Platform: TradingView (Pine Script v6) or lastest version Project Description: I want an indicator that automatically detects trend channels and bounce signals without manual drawing. It must: Identify swing highs and swing lows using pivot logic (for example, 5 candles left and 5 candles right), Draw a dynamic channel based on these swing points
Dashboard panel for indicator + Fiboanacci + Bullish candle + Bearish candle + Candle highier high + Candle highier low + Candle Lower high + Candle Lower low + Strong signal candle + PO3 + Session + examples
Project information
Budget
30+ USD
For the developer
27
USD
Deadline
to 1 day(s)