Specification
I need a modification of the standard Donchian indicator that is already included in the MT5 terminal (I can provide you with the source code; alternatively it can be found in the Data Folder at MQL5\Indicators\Free Indicators).
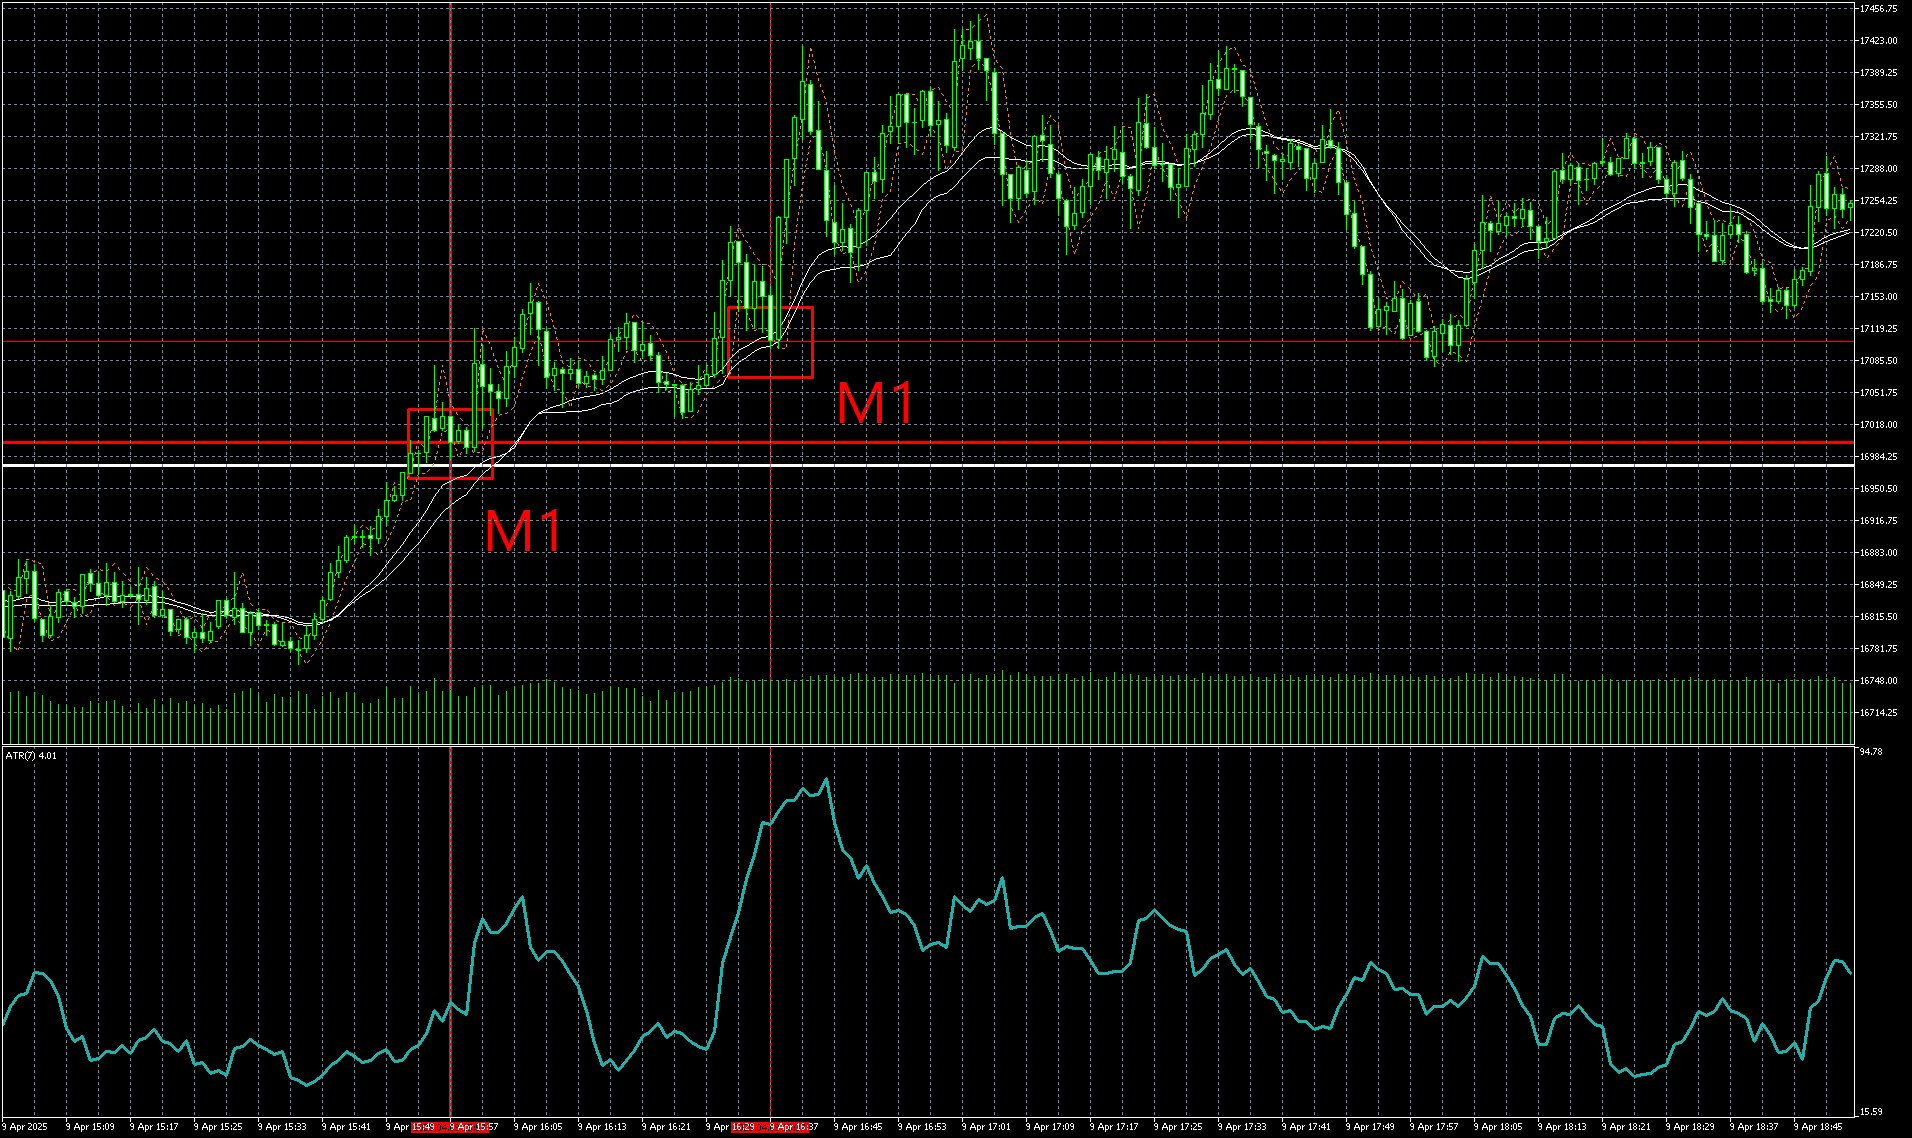
I want it to draw a cross and a box (a horizontal line and a vertical line at the point of candle close, as well as a box around the crossing point [see image "Example 1" attached]; thickness of the lines should be auto adjusting in reference to "clearness of signal" as outlined below) every time the upper or lower line of the Donchian channel is crossed by the candle (candle closing above upper or beneath lower line; the middle line is not important and can be ignored, yea even deleted). If the upper line is crossed, the cross and box should be of green color, if the lower line is crossed, the color of the cross and the box should be red (ideally these color settings should be modifiable).

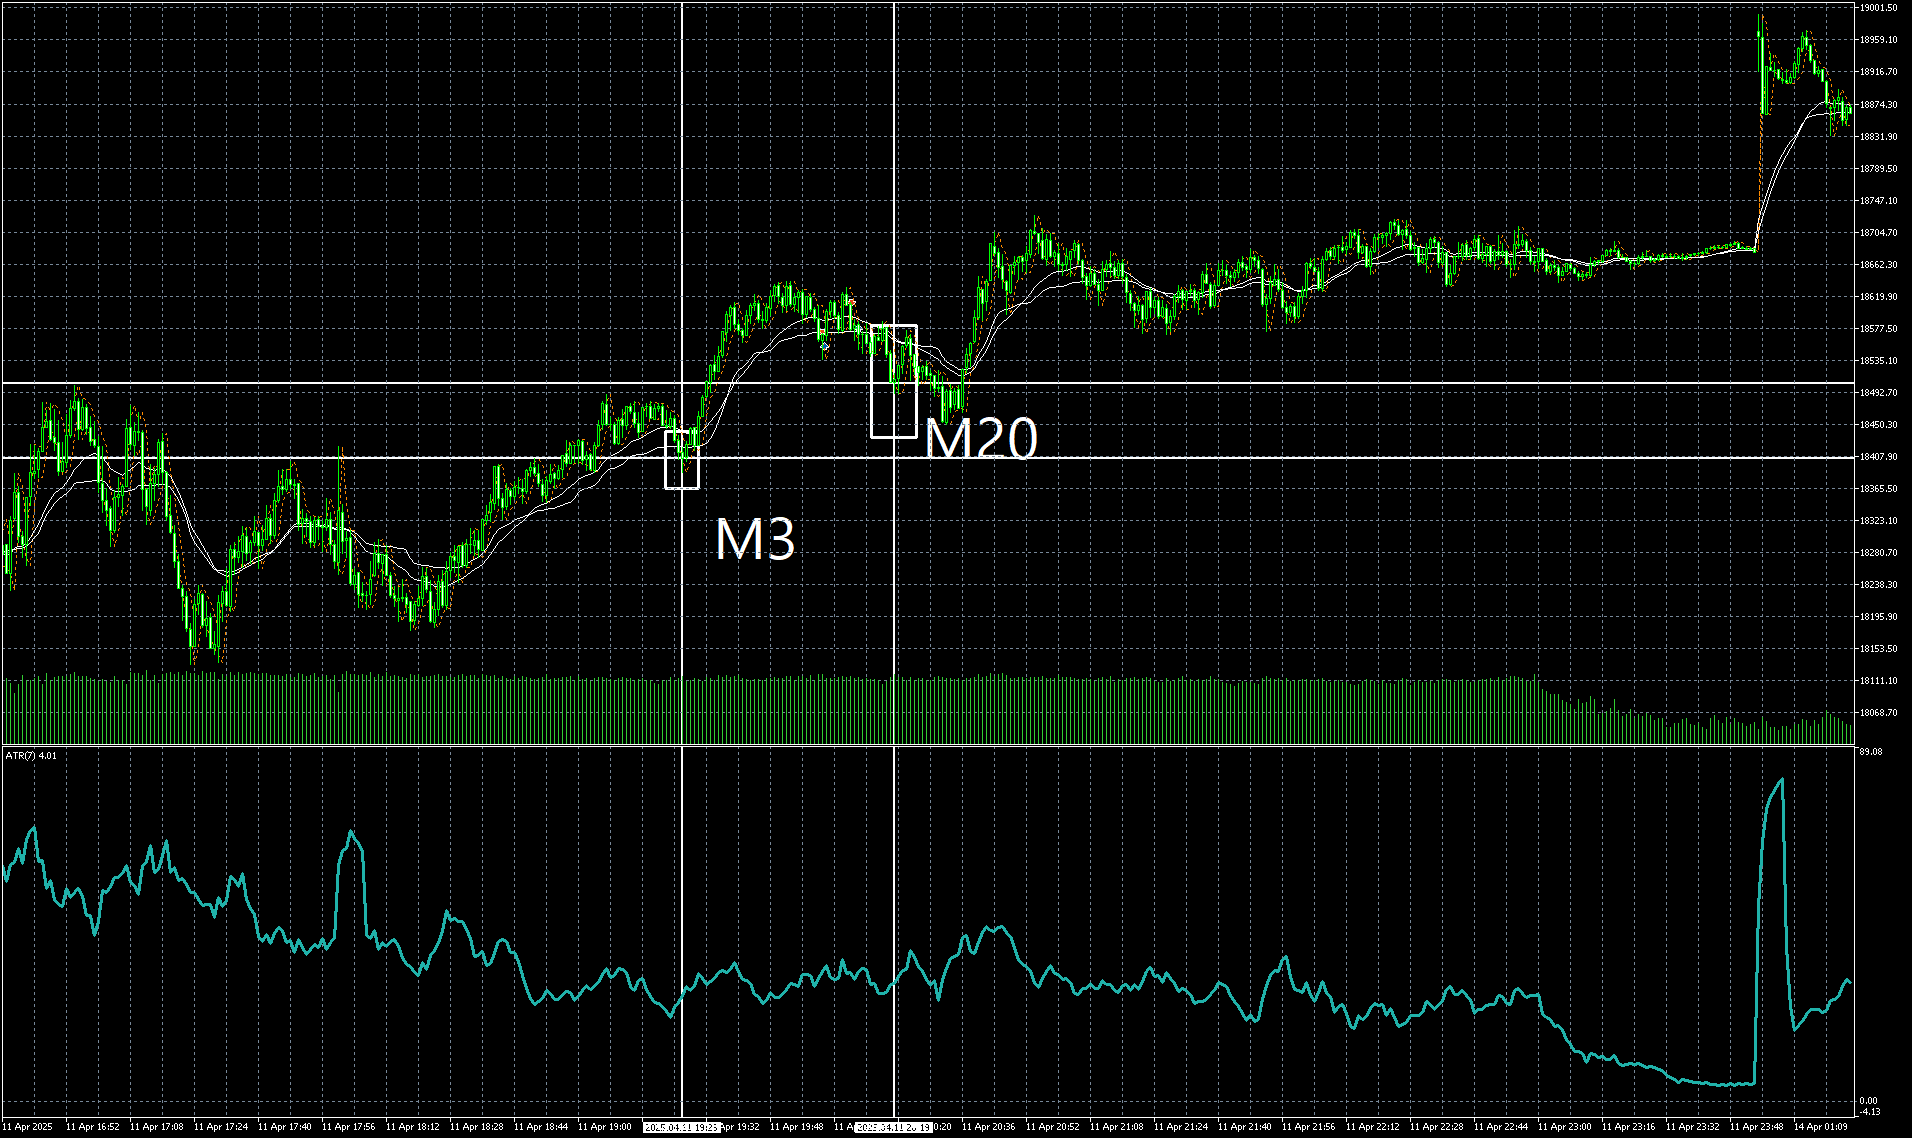
The indicator shall take into account all available timeframes on MT5 (M1, M2, M3, M4, M5, M6, M10, M12, M15, M20, M30, H1, H2, H3, H4, H6, H8, H12, D, W, M; ideally it should be selectable in the settings to only select a few of these timeframes or all) and plot it on the chart, no matter what the current timeframe setting of the chart window is. There should be an indication at every cross with box referring to the timeframe that cross and box belongs to (see image "Example 2"; it does not have to look exactly like in the example image below).

These lines (the cross) and the box shall vanish (delete) or be turned to white (should be selectable in the settings) if the price moves beyond that line beyond a certain threshold. The threshold is measured in points. For example if the price moves 1000 points below the red line, the lines and box with timeframe indicator are deleted (or turned to white, depending on the settings). There has to be an option to define what the respective threshold is for each timeframe. E.g.: Threshold for M1: 1000 points, Threshold for M2: 2000 points and so on. This threshold also should be depending on a certain symbol's ATR for the respective period of time and there must be the the option to set a "baseline" or "reference" value in relation to the ATR. For example: Setting the baseline setting to 1000 points @ ATR 50. So when the ATR rises to 100 the indicator shall automatically set the threshold to 2000 points, or, if the ATR plummets to 25, then the indicator should automatically set the threshold to 500 points: If ATR is only half the baseline setting, then the threshold should also be one half of the baseline setting, and so forth: if ATR plummets to a value of 12,5, then the threshold should be 250 points, and so on. There must be the option to refer to the ATR of a certain symbol, regardless of the symbol the indicator is applied to. For example: The indicator is applied to EURUSD, but for the calculation of the threshold, the ATR of XAUUSD M1 is used. Also, there must be the option to set a fixed value ATR and with that deactivate the automatic adjustment to current ATR.
The current ATR that the indicator uses to calculate the current threshold should be the highest of the day, which shall be determined from 3 p.m. (MT5 terminal time) until end of day. Before 3 p.m. the average value of the ATR peak values of the last 5 trading days shall be used, unless there is a peak before 3 p.m. (between beginning of trading day and 3.p.m.) that is higher than this calculated average, in which case this higher peak is to be used. The highest value after 3 p.m. till end of the day shall be used as a reference ATR value, even if it is lower than the average of the peaks of the last five trading days. But if the value of before 3 p.m. (beginning of trading day till 3 p.m.) was set instead of the average of the last five days and the value after 3 p.m. does not exceed this value, then the value of before 3 p.m. shall remain for the day, as it is the highest of the day.
The current applied ATR value shall always be visible somewhere on the chart, maybe in some corner of the window or, if implemented in this indicator, on a screener panel which shows all current green or red signals as an overview (panel is not a must). At each cross and box, apart from the indication of the timeframe, there should be also an indication of the respective ATR that was the reference when drawing the cross and the box (not visible in the example images).
The "clearness of signal" mentioned above in the second paragraph should be tiered threefold in relation to the amount of the price candle surpassing the crossed line (yet not reaching the threshold value): If the threshold is for example 1000 points, tier one would be 0-333 points (thick line, thickness 5), tier 2 would be 334-666 points (medium line, thickness 3), tier 3 would be 667-999 points (thin line, thickness 1). If price goes beyond 999, that is 1000 or more points in this case, beyond the crossed line then the signal is invalid and the lines will be deleted or become white colored. If at a later point the cross line is surpassed by a value of points that belongs to another tier, the thickness of that crossed lines and box should be adjusted automatically accordingly.
There must be the option to specify the number of bars taken into consideration with no max limit of bars.
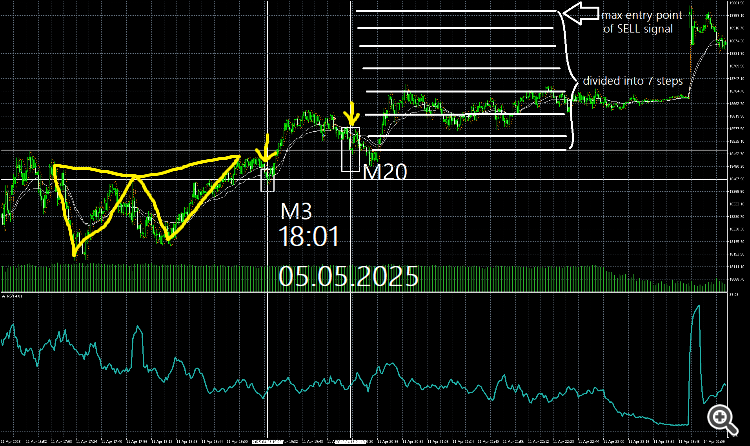
There must be the option to exclude certain time periods of the year (two separate time periods, with the option to only use one or none) from being taken into consideration, like "don't plot cross and box between March 10th and May 5th and also not between August 3rd and September 9th". So there must be the option to either draw lines at all times or only in the non-excluded time periods of the year when one or optionally two time periods are excluded.
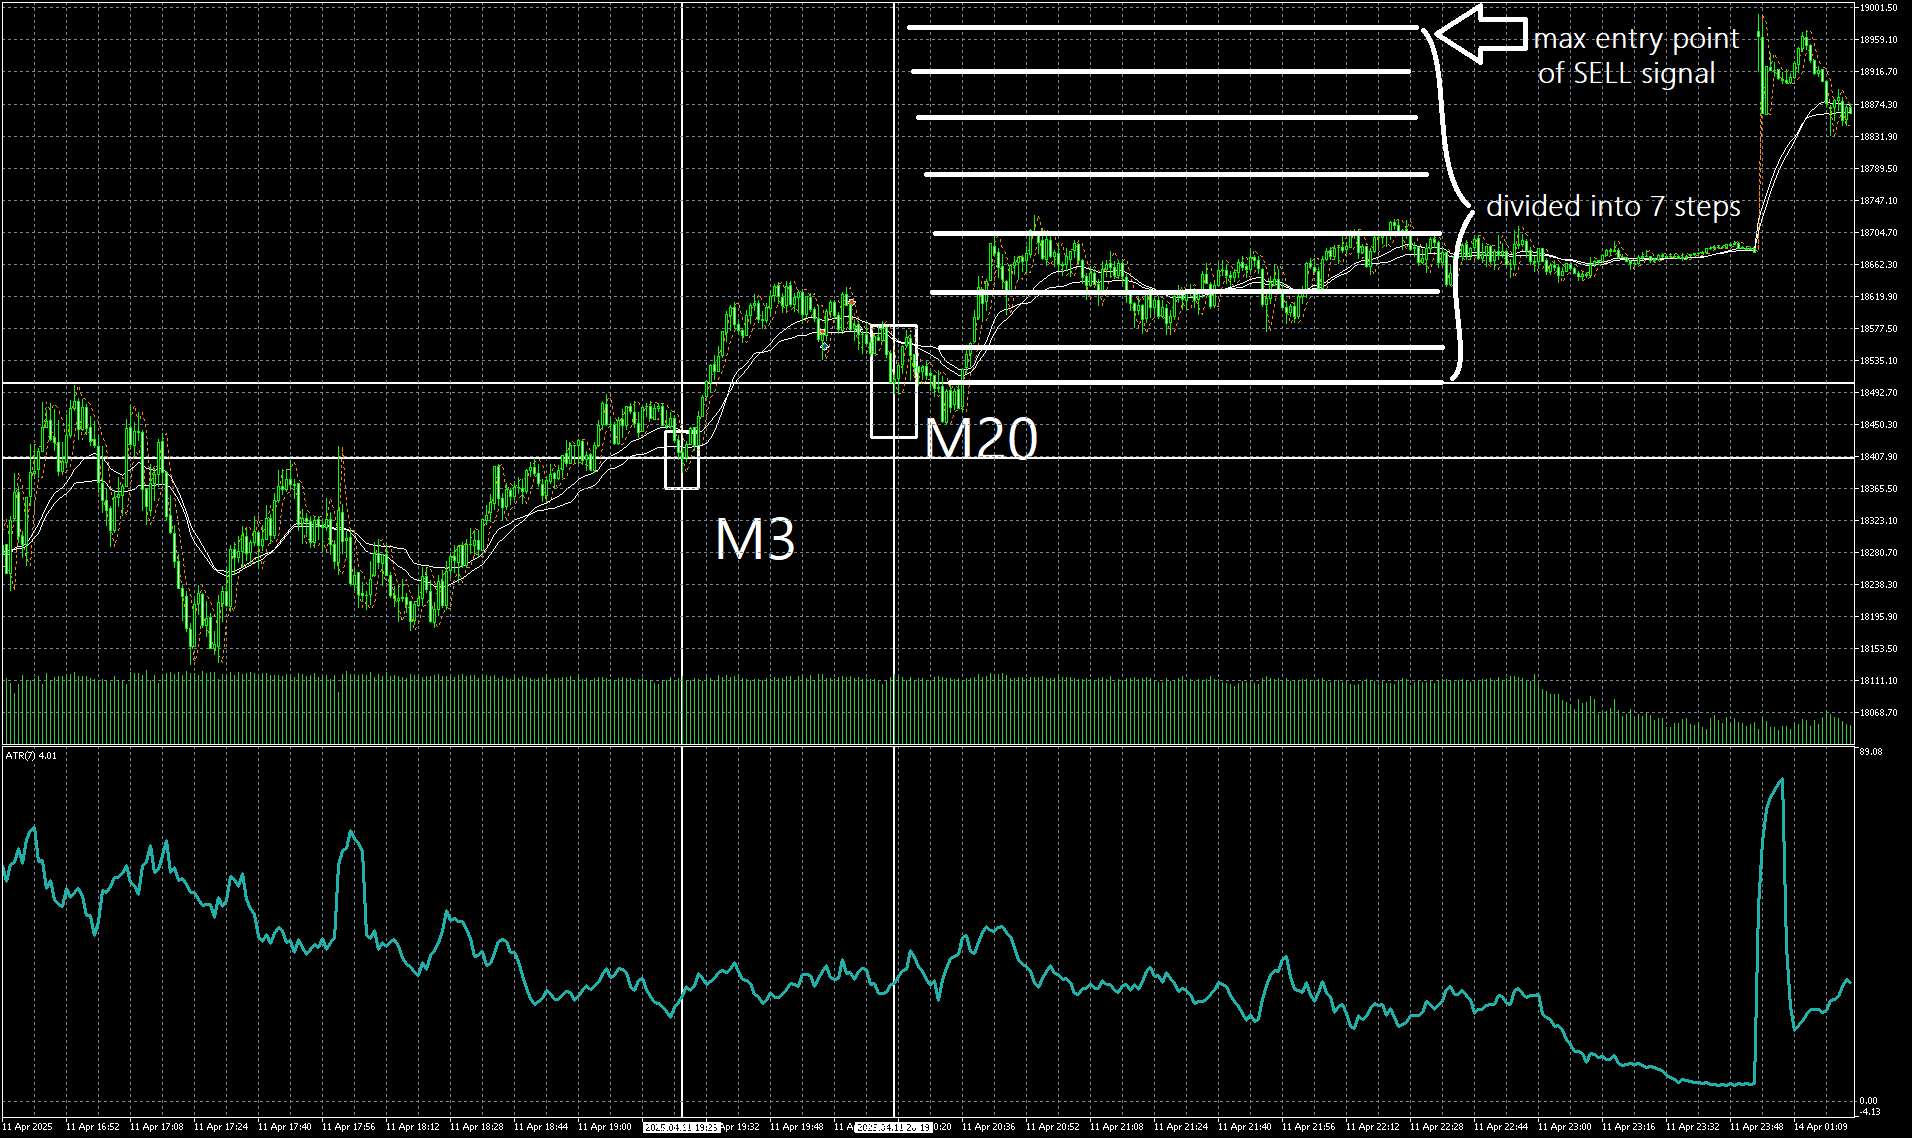
Additionally, there should be the display of possible entry points, also dependent on the currently applied ATR, as described above. It should be possible to either have one entry point (which would be the "max entry point", the farthest away entry point) or to have several intermediary entry points, of which the furtest away from the cross and box is the mentioned "max entry point". For example: Let's say that the currently applied ATR value is 50 and the "max entry point" is set to 1000*ATR value which would be 50.000 points away from the cross and box. This would be the "max entry point". Alternatively there should be the option to divide this 50.000 points range into 10 steps (or another number of steps as set in the options of the indicator), so one entry point each 5.000 points displayed as a line (red for "sell from here", green for "buy from here") on the chart, called "entry lines". All the entry lines should be deleted from the chart (or made white colored) once the cross and box are deleted (or made white colored), as outlined above (when price moves beyond the crossed line beyond the threshold value). Example picture:

There should be the option of alerts for each entry point, like "entry point 1 reached", "entry point 2 reached", and so forth.
Ideally this should be programmed in a way that would make it possible to turn this Indicator into an EA later on.
If there are any questions/need for clarification, please reach out to me.