You are missing trading opportunities:
- Free trading apps
- Over 8,000 signals for copying
- Economic news for exploring financial markets
Registration
Log in
You agree to website policy and terms of use
If you do not have an account, please register
ResSupFibo - indicator MetaTrader 5
The indicator shows the momentum of the price of the currency pair with a marking Fibo levels. The display shows two lines of pink and blue, thus indicating the direction of the entrance to the market, and marking of Fibo levels. If the price breaks the bottom line, you need to sell if the top, then buy the contrary. Good work on the timeframes of H1 and above. Support and resistance lines are calculated as the number of local extremes of the bars, input parameter defined indicator iPeriod.
This is interesting indicator to check breakout/breakdown of the price movement especially during the ranging market condition waiting for direction. As I understand - pink line is for sell level to be broken, and blue (upper) line is for buy trade in case the price breaks this line to above:
Anyway, it may be interesting to check about how this indicator works when market will be opened on Monday for example.
Forum on trading, automated trading systems and testing trading strategies
How to Start with Metatrader 5
Sergey Golubev, 2013.09.20 08:21
Summaries :
====
Forum on trading, automated trading systems and testing trading strategies
How to Start with Metatrader 5
Sergey Golubev, 2015.02.03 18:48
Market condition setup (indicators and template) is hereInteresting article found (old but interesting): My First "Grail"
The word "grail" is now often used among modern programmers ironically. It means for them the impossibility to create a "universal" program for all occasions. As to programming in MQL4, this word means impossibility to create an expert that would give fantastic effects in the real trading.
In reality, forex is the reflection of a complex conglomerate of phenomena - economic and industrial relations, human characters, politics. Moreover, and this is even more important, it cannot be simply formalized. Experienced traders recommend to enter the market only if there are three to five or even more signs indicating the possible trend.
At the same time, the regularities determined by now cannot completely provide a deep basis for market forecasting with high probability of success. The contradictory prognoses made by leading analysts of eminent banks and financial organizations confirm this. All analysts, without any exception, can very well interpret the events that have already happened, but only a few of them can give a sequence of really confident prognoses.
Let us be just towards them: These people do what they can do, most of them have a long trading experience and much knowledge we can envy. However, let us call things by their proper names: practically all of them are often mistaken. They can look big, enjoy more or less popularity, sometimes make a handsome fortune ("gurus" of different kinds are really well described in the Alexander Elder's book titled Trading for a Living: Psychology, Trading Tactics, Money Management), but the fact remains that even experienced analysts are often mistaken.
So, considering these circumstances, what are the chances of a first-time programmer who is just making his or her first steps in trading on Forex? Let us try to retrace the pathway that the beginner goes in his or her quest of the "Grail".This is the other version of forecasting indicator (i-DRProjections). The indicator is forecasting the daily high/low for the current day. It means: if we attach this indicator when the market will be opened so we can get predicted high/low for this day for example:
Prediction of the daily price ranges. This indicator shows the current day support and resistance levels forecast on the bases of the previous day price levels. The formula for calculating the levels are described in Thomas Demark's The New Science of Technical Analysis.
Forum on trading, automated trading systems and testing trading strategies
How to Start with Metatrader 5
Sergey Golubev, 2013.08.04 18:27
If you are totally new to this website and
there are some pages which will help you to start :
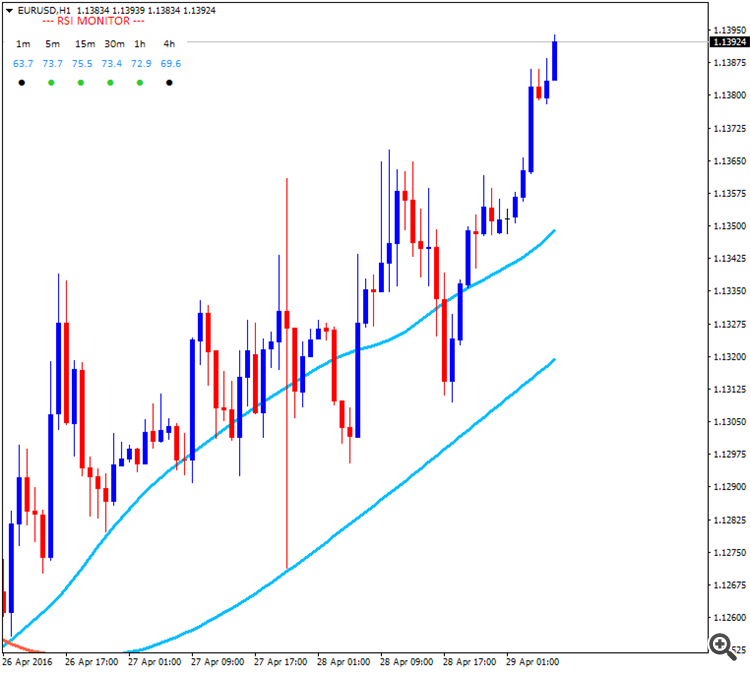
This is very interesting (and very usefull) RSI indicator: RSI Monitor - indicator for MetaTrader 4

Description:If you trade with RSI indicator, here is another way to use it. This indicator will draw a small panel that shows all RSI values on all timeframes and will alert you when the price enters the Oversold, Overbought zones.
Features:Forum on trading, automated trading systems and testing trading strategies
strategy
Sergey Golubev, 2016.03.24 17:43
The Strategy
Forum on trading, automated trading systems and testing trading strategies
All about MQL5 Wizard : create robots without programming.
Alain Verleyen, 2013.10.10 12:07
Trading Signals available from Codebase.
Not provided with standard library, if you want to use one of them, you have to download and install it.
From Metaquotes.
Trading Signals of Candlestick Patterns + Stochastic
Trade Signals Based on Dark Cloud Cover/Piercing Line
Trade Signals Based on Bullish/Bearish Meeting Lines
Trade Signals Based on 3 Black Crows/3 White Soldiers
Trade Signals Based on Bullish Engulfing/Bearish Engulfing
Trade Signals Based on Morning/Evening Stars
Trade Signals Based on Hammer/Hanging Man
Trade Signals Based on Bullish Harami /Bearish Harami
Work in progress...
ZigZag Signal - indicator for MetaTrader 4
This is signal indicator based on zigzag which is placing the arrow on the chart if the following pattern was fomred (for sell, and opposite pattern for buy):
For example: