strategy
 price action is still the best strategy in my opinion, what about you?
I was thinking that it is Bullish Engulfing Candle Pattern but it looks more as Bullish One White Soldier
Forum on trading, automated trading systems and testing trading strategies
Sergey Golubev, 2013.11.07 08:22
Trading the Bullish Engulfing Candle Pattern
Talking Points
- Candlestick analysis can be worked into any active Forex trading strategy.
- The bullish engulfing candle can spot potential reversals in price.
- Traders can look for candles to signal a resumption of the EURUSD bull trend.
Spotting price reversals and continuations through the interpretation of price action is an important skill for Forex traders to master. Candlestick analysis can help make this process easier. Candle pattern interpretation does not only make navigating the market easier, but it can also be a useful trading tool. With this idea in mind we will focus on recognizing and trading one of the markets most clear cut price action signals, the bullish engulfing candle pattern.
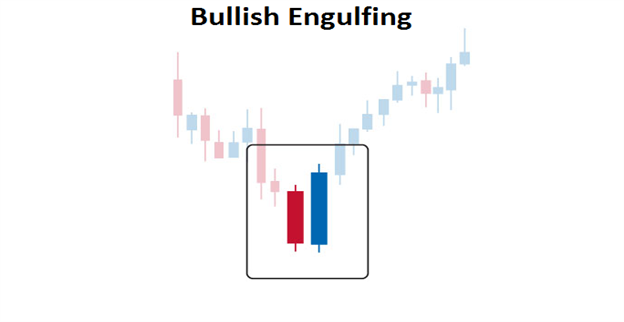
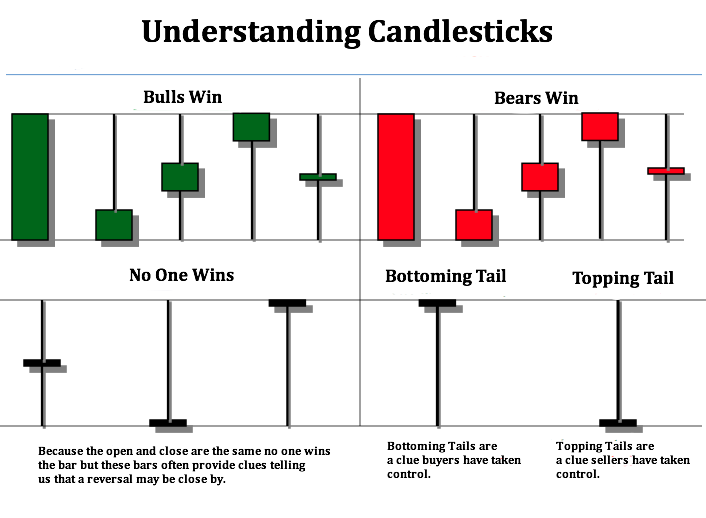
What is a bullish engulfing pattern?
A bullish engulfing pattern is a candlestick pattern normally foundafter
a period of downward market pressure. Pictured above we can see that
the bullish engulfing candle pattern is actuallycomprised of two
completed candles! The first candle will normally depict the end of the
currency pairs established weakness. This first candle can come in a
variety of shapes and sizes and will vary from chart to chart.While it
is notdirectly related to the next engulfing pattern, this candle should
denote the end of the markets current decline. Small candles such as
dojis are considered preferable in this position though, as they can
reflect market indecision in the current trend.
The second candle in the pattern is arguably the most important. As seen
above, this candle is expected to stick out from price action and close
as a long blue candle. This large move in price signals a return to a
bullish market bias with newupward price momentum surging towards higher
highs. To be considered a complete bullish engulfing candle pattern,
the high of this blue candle should close well above the high of the
previous candle. The higher this blue candle advances, the stronger our
signal is considered. A new push of upward movement in this position on
the chart, reflects new buyers overtaking the previous strength of the
sellers.This action can be used in conjuncture with an established
uptrend,with buyers looking to enter the market on refreshed strength.
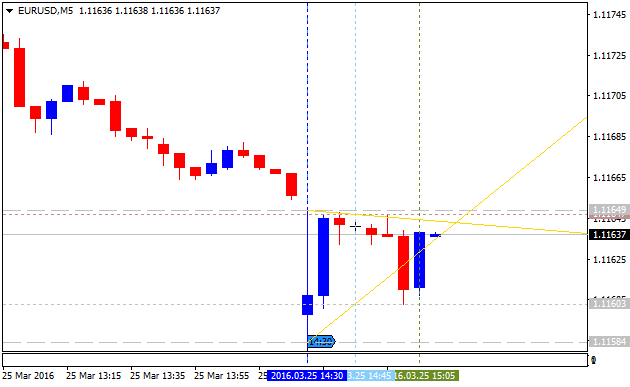
Let’s look at a current example :

Charting the EURUSD
Once you are familiarized with identifying the bullish engulfing candle
pattern it can then readily be applied to your trading. Above is an
excellent example of the pattern in action on a daily EURUSD chart. The
EURUSD is currently in a standing uptrend, beginning with a strong
bullish engulfing candle completed on July 10th. Along the way there
have been price retracements against this now mature trend, but we can
see many of these declines have ended in a fresh bullish engulfing
candle. These surges in price have confirmed the resumption of the
broader trend, while creating new buying opportunities.
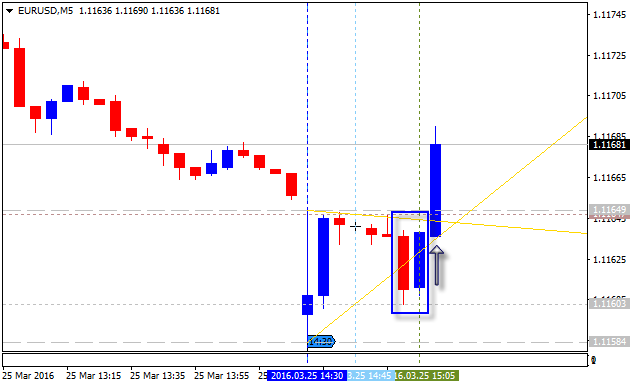
Currently, this scenario may be playing out yet again. Highlighted in
green, there is another potential bullish engulfing pattern forming on
the EURUSD Daily chart. Traders will be watching this candle for a
confirmation to signal the resumption of the bull trend after last
week’s decline. If the price of the EURUSD does remain supported,
traders should take this as a bullish market signal and look for the
pair to move towards higher highs.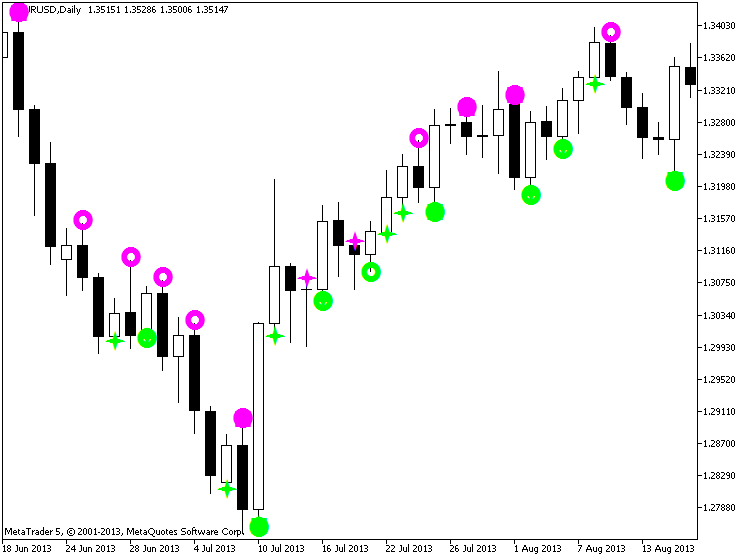
Forum on trading, automated trading systems and testing trading strategies
All about MQL5 Wizard : create robots without programming.
Alain Verleyen, 2013.10.10 12:07
Trading Signals available from Codebase.
Not provided with standard library, if you want to use one of them, you have to download and install it.
From Metaquotes.
Trading Signals of Candlestick Patterns + Stochastic
Trade Signals Based on Dark Cloud Cover/Piercing Line
- Dark Cloud Cover/Piercing Line + CCI
- Dark Cloud Cover/Piercing Line + RSI
- Dark Cloud Cover/Piercing Line + MFI
- Dark Cloud Cover/Piercing Line + Stochastic
Trade Signals Based on Bullish/Bearish Meeting Lines
- Bullish/Bearish Meeting Lines + CCI
- Bullish/Bearish Meeting Lines + RSI
- Bullish/Bearish Meeting Lines + MFI
- Bullish/Bearish Meeting Lines + Stochastic
Trade Signals Based on 3 Black Crows/3 White Soldiers
- 3 Black Crows/3 White Soldiers + CCI
- 3 Black Crows/3 White Soldiers + RSI
- 3 Black Crows/3 White Soldiers + MFI
- 3 Black Crows/3 White Soldiers + Stochastic
Trade Signals Based on Bullish Engulfing/Bearish Engulfing
- Bullish Engulfing/Bearish Engulfing + CCI
- Bullish Engulfing/Bearish Engulfing + RSI
- Bullish Engulfing/Bearish Engulfing + MFI
- Bullish Engulfing/Bearish Engulfing + Stochastic
Trade Signals Based on Morning/Evening Stars
- Morning/Evening Stars + CCI
- Morning/Evening Stars + RSI
- Morning/Evening Stars + MFI
- Morning/Evening Stars + Stochastic
Trade Signals Based on Hammer/Hanging Man
- Hammer/Hanging Man + CCI
- Hammer/Hanging Man + MFI
- Hammer/Hanging Man + RSI
- Hammer/Hanging Man + Stochastic
Trade Signals Based on Bullish Harami /Bearish Harami
- Bullish Harami/Bearish Harami + CCI
- Bullish Harami /Bearish Harami + MFI
- Bullish Harami/Bearish Harami + RSI
- Bullish Harami/Bearish Harami + Stochastic
Work in progress...
"Plotting of candlestick charts and analysis of candlestick patterns is an amazing line of technical analysis. The advantage of candlesticks is that they represent data in a way that it is possible to see the momentum within the data.
Candlesticks give a vivid mental picture
of trading. After reading and a little practice, candlesticks will be
part of your analytical arsenal. Japanese candlestick charts can help
you penetrate "inside" of financial markets, which is very difficult to
do with other graphical methods. They are equally suitable for all
markets."
Forum on trading, automated trading systems and testing trading strategies
Something Interesting in Financial Video November 2013
Sergey Golubev, 2013.11.07 08:41
Candlestick Charting - Bullish Engulfing Pattern
The Strategy

Harga Action adalah akhir ketika Anda menggabungkan dengan Dukungan dan Resistance.
ya,,,valid confirmation of price action when it is in the support and resistance...good luck bro
This is Bullish One White Soldier:
I mean - this one (this is exact pattern which Doritegal mentioned in his first post of this thread):
- Free trading apps
- Over 8,000 signals for copying
- Economic news for exploring financial markets
You agree to website policy and terms of use