Forum on trading, automated trading systems and testing trading strategies
Something Interesting in Financial Video November 2014
Sergey Golubev, 2014.11.30 08:15
How to Trade the Wedge Chart Pattern Like a ProThe Falling Wedge:
The falling wedge pattern is characterized by a
chart pattern which forms when the market makes lower lows and lower
highs with a contracting range. When you find this pattern in a
downtrend it is considered a reversal pattern as the contraction of the
range indicates the downtrend is loosing steam.
The Rising Wedge:
The rising wedge pattern is characterized by a chart pattern which forms when the market makes higher highs and higher lows with a contracting range. When you find this pattern in an uptrend it is considered a reversal pattern as the contraction of the range indicates that the uptrend is loosing steam.
Forex News Trading Strategy For The 4th - 8th of January
This is fundamental analysis for the week using ff economic calendar as the example. For more about economic calendar for Metatrader 5for traders and for developers - see this topic: All about Calendar tab and Macro Economic Events.
Forum on trading, automated trading systems and testing trading strategies
All about Calendar tab and Macro Economic Events.
Alain Verleyen, 2013.03.17 16:54
For traders
MT5 user interface
- If you can't view the calendar tab, probably it's a choice a your broker :
- New Video : How to delete Calendar Events from charts ?
- New Video : How to disable Calendar Events from charts ?
- New Video : How to export Calendar Events ?
- New Video : How to show only selected Calendar Events on a chart ?
- Main documentation for using the tab, can be found here.
Analysis
- What is Fundamental Analysis and how use MT5 for that.
- What are the events and the available indicators in calendar tab?
For developers
- A good demonstration about using calendar economic events from code.
- Documentation about object use by Calendar (See OBJ_EVENT).
Forum on trading, automated trading systems and testing trading strategies
Something Interesting in Financial Video September 2013
Sergey Golubev, 2013.09.19 08:00
120. Economic Releases that Move the US DollarAs you can probably imagine, we could spend many lessons and multiple hours going over each of the economic indicators that affect the price of the US Dollar. It is for this reason, that before getting into any of the actual indicators, I wanted to give everyone an overview of the broad things that move the market. As we have discussed in previous lessons the two broad categories that pretty much everything that moves the forex market fits into, are trade flows and capital flows, as covered in module 3 of this course.
Once you have an understanding of this, all that is necessary to understand how economic numbers move the dollar, is to understand which numbers are important to the market at the time, whether those numbers fit into the trade flows or capital flows category, and how they should affect the dollar as a result.
As we learned in module 8 of our basics of trading course, how the market reacts to economic releases is generally determined by two factors:
1. How important the market considers a particular release to be.
2. How close to market estimates the number comes in at. Remember that markets anticipate news, so generally if an economic release comes out as expected, there is very little if any market reaction to that release.
How important the market considers a particular economic release to be, is something that changes over time depending on what is happening from a US Dollar fundamentals standpoint. If there are worries that the economy is going into recession, then the market is going to be extra sensitive to any numbers, such as non farm payrolls and consumer spending, which may provide early warning signs that this is the case. Conversely, if the economy is heating up and the markets are worried that inflation may become a problem, then the most market moving numbers may be price data releases, such as the CPI and the PPI. For your reference, according to Dailyfx.com the most market moving indicators for 2007, in order of importance were:
1. Non Farm Payrolls
2. FOMC Releases
3. Retail Sales
4. ISM Manufacturing
5. Inflation
6. Producer Price Index
7. The Trade Balance
8. Existing Home Sales
9. Foreign Purchases of US Treasuries (TIC Data)
We have discussed most of these indicators already, and for those which we have not, a quick google search, and review of the indicator in the context of whether it fits into trade flows or capital flows, should answer the question of why they move the market.
Although I am probably a little biased since I used to work with the people who run the site, I am a very big fan of Dailyfx.com as the place where I go to find out what economic data is due for release, and for commentary on the number after the release. They have a great global calendar which you can find at the top of the site as well as tons of both technical and fundamental commentary on everything that affects the US Dollar and forex market in general.
For this lesson specifically, if you click the calendar button at the top of the site you will see they have all of the economic data releases from the major countries of the world with the time of the release, the previous number, the forecasted number and the actual number which is updated after the release. You will also notice here they have links for the more important numbers giving a definition of the release, the relative importance of the release, and the latest news release relating to that release.
If you click back to the homepage of the site you will see lots of fx related reports which the Dailyfx staff puts out throughout the day. Two of my favorite reports are the Daily Fundamental report by Kathy lien, and the US Open Market Points by Boris Schlossberg which you can find in the middle of the page.
As we discussed in module 8 of our basics of trading course, the best way to get a feel for how economic numbers affect the market, and which numbers are in focus, is to start following the market on a daily basis and seeing how it reacts to various news events. As this is the case, I highly recommend following the commentary on Dailyfx.com as well as the forex commentary on InformedTrades.com, and start putting your analysis to practice on your real time demo accounts. If you have not registered for a free realtime demo account I have included a link above this video where you can do so.
Forum on trading, automated trading systems and testing trading strategies
Financial and trading videos - Table of Contents
Alain Verleyen, 2013.10.02 17:42
Famous traders / Interviews.
- Why Watching the News Can Hurt Your Trading by Alexander Elder
- First Step to Trading Success: Choose Your Proper Time Frame by Alexander Elder
Forum on trading, automated trading systems and testing trading strategies
Something Interesting in Financial Video January 2014
Sergey Golubev, 2014.01.19 07:43
01: NON FARM PAYROLL (Part 1) - ECONOMIC REPORTS FOR ALL MARKETSThis is the 1st video in a series on economic reports created for all markets, or for those who simply have an interest in economics. In this and the next lesson, we cover the Employment Situation Report, also known as Non Farm Payroll.
============
Non-farm Payrolls (metatrader5.com)Non-farm Payrolls is the assessment of the total number of employees recorded in payrolls.
This is a very strong indicator that shows the change in employment in the country. The growth of this indicator characterizes the increase in employment and leads to the growth of the dollar. It is considered an indicator tending to move the market. There is a rule of thumb that an increase in its value by 200,000 per month equates to an increase in GDP by 3.0%.
- Release Frequency: monthly.
- Release Schedule: 08:30 EST, the first Friday of the month.
- Source: Bureau of Labor Statistics, U.S. Department of Labor.
============
FF forum economic calendar :
- Source : Bureau of Labor Statistics
- Measures : Change in the number of employed people during the previous month, excluding the farming industry
- Usual Effect : Actual > Forecast = Good for currency
- Frequency : Released monthly, usually on the first Friday after the month ends
- Why Traders Care : Job creation is an important leading indicator of consumer spending, which accounts for a majority of overall economic activity
- Also Called : Non-Farm Payrolls, NFP, Employment Change
============
mql5 forum thread : Non-Farm Employment Strategy
============
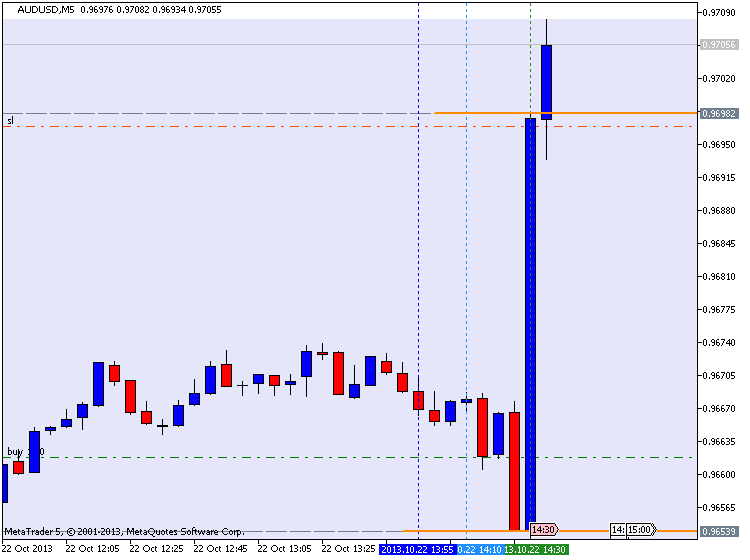
AUDUSD M5 with 45 pips in profit (by equity) for NFP :
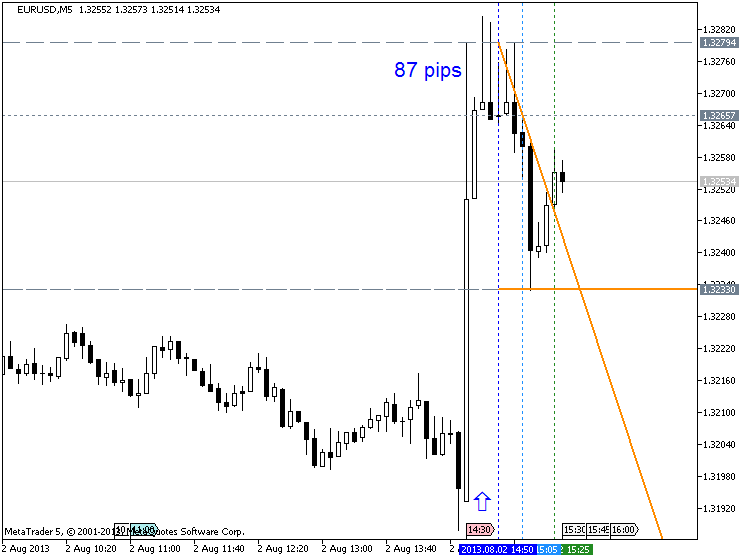
EURUSD M5 : 87 pips price movement by NFP news event :
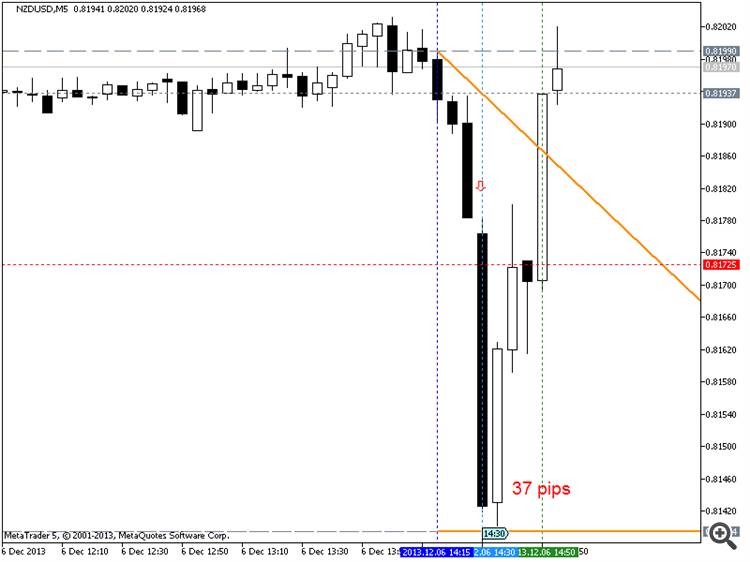
NZDUSD M5 : 37 pips price movement by USD - Non-Farm Employment Change :
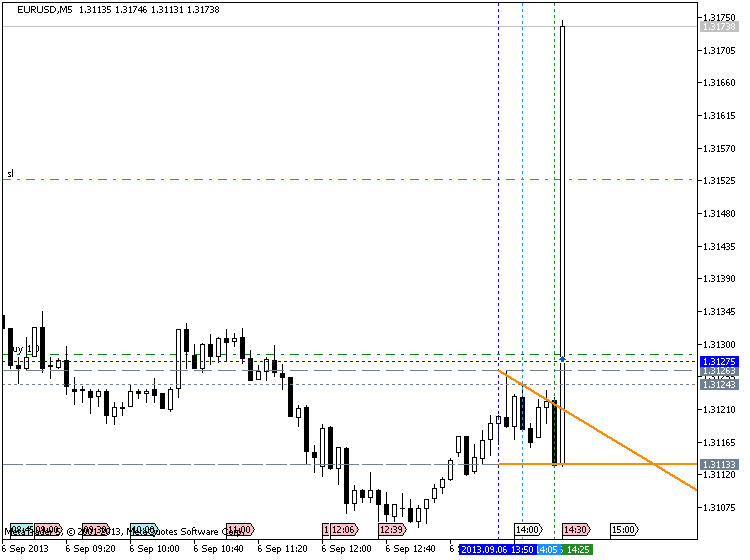
Trading EURUSD during NFP :
==================
Forum on trading, automated trading systems and testing trading strategies
Something Interesting in Financial Video January 2014
Sergey Golubev, 2014.01.23 12:58
02: NON FARM PAYROLL (Part 2)- ECONOMIC REPORTS FOR ALL MARKETS
This is the second part of video lesson about nfp. The first part of the lesson is on this post :
============
Forum on trading, automated trading systems and testing trading strategies
Something Interesting in Forex Video May 2013
Sergey Golubev, 2013.05.27 16:57
Trading the Oil Price
Crude oil can be effected by political tensions and people's views on the economy; it is a very volatile market and can easily move 200 to 400 points a day. It is as such one of the more volatile markets out there.
Forum on trading, automated trading systems and testing trading strategies
Something Interesting in Financial Video February 2014
Sergey Golubev, 2014.02.18 15:17
How to make money in crude oil
Forum on trading, automated trading systems and testing trading strategies
Something Interesting in Financial Video November 2014
Sergey Golubev, 2014.11.27 10:23
Suri Duddella, Webinar: The Success and Failure of Chart Patterns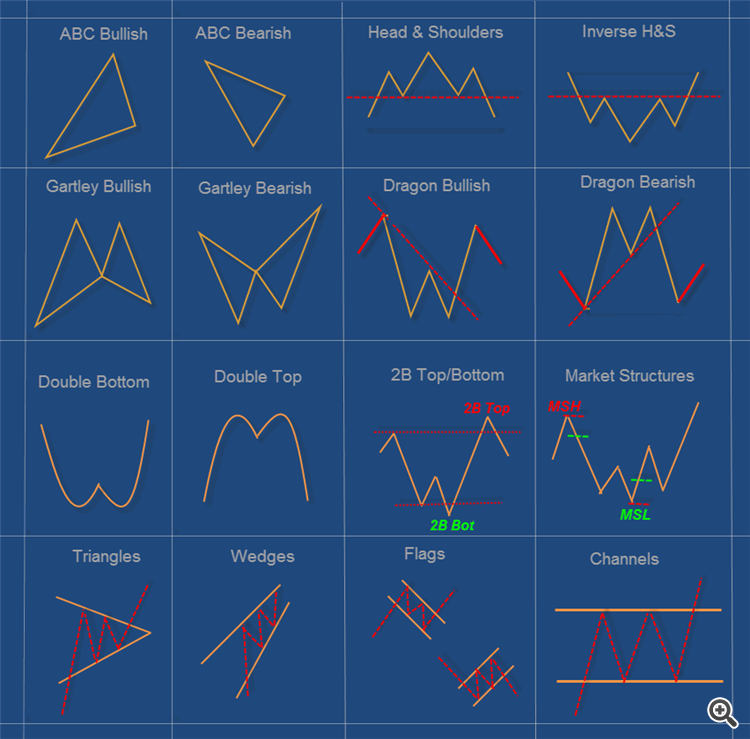
Suri Duddella, 19+ years full-time Futures/Equities/Options Trader.
Patterns based Algorithmic Trading. Author -- "Trade Chart Patterns
Like The Pros" book.
- Chart Pattern Modeling
- Essential pattern structure components and analysis
- Practical statistics of patterns success and failures
- Examples of many patterns
======
A chart pattern is a distinct formation on a stock chart that
creates a trading signal, or a sign of future price movements. Chartists
use these patterns to identify current trends and trend reversals and
to trigger buy and sell signals. 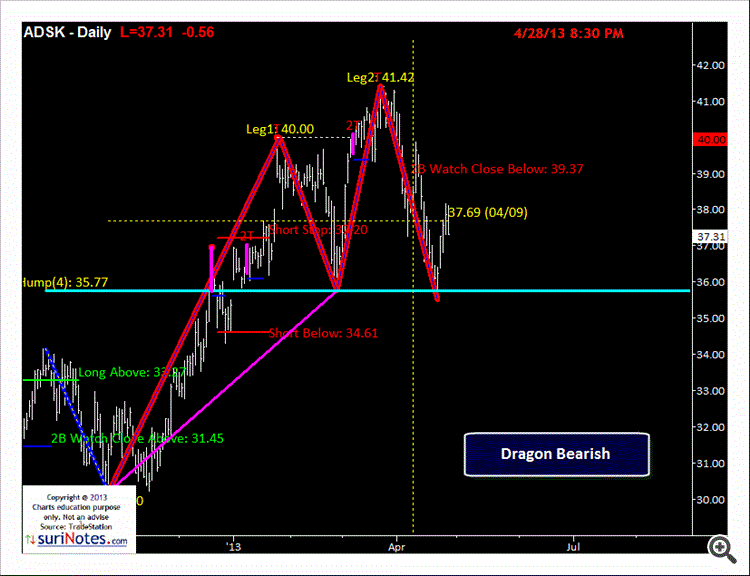
Identifying chart
patterns is simply a system for predicting stock
market trends and turns! Well, a trend is merely an indicator
of an imbalance in the supply and demand. These
changes can usually be seen by market action through
changes in price. These price changes often form
meaningful chart patterns that can act as signals
in trying to determine possible future trend developments.
Research has proven that some patterns have high
forecasting probabilities. These patterns include:
The Cup & Handle, Flat Base, Ascending and
Descending Triangles, Parabolic Curves, Symmetrical
Triangles, Wedges, Flags and Pennants, Channels and
the Head and Shoulders Patterns.
Forum on trading, automated trading systems and testing trading strategies
Something Interesting in Financial Video August 2013
Sergey Golubev, 2013.08.27 08:30
85. Forex Trading - Characteristics of the Main Currencies
Over 80% of all currency transactions involve the US Dollar. As you can
probably imagine after hearing this, currency traders pay heavy
attention to what is happening with the US Economy, as this has a very
direct affect not only on the US Dollar but on every other currency in
the world as well. Japan, which is the second largest individual economy
in the world, has the third most actively traded currency, the Japanese
Yen. After experiencing impressive growth in the 60's, 70's and early
80's Japan's economy began to stagnate in the late 1980's and has yet to
fully recover.
To try and stimulate economic growth, the central bank
of Japan has kept interest rates close to zero making the Japanese Yen
the funding currency for many carry trades, something which we will
learn more about in later lessons. It is also important to understand at
this stage that Japan is a country with few natural energy resources
and an export oriented economy, so it relies heavily on energy imports
and international trade. This makes the economy and currency especially
susceptible to moves in the price of oil, and rising or slowing growth
in the major economies in which it trades with. While the United Kingdom
is a member of the European Union it was one of the three countries
that opted out of joining the European Monetary Union which is made up
of the 12 countries that did adopt the Euro.
The UK's currency is known
as the Pound Sterling and is a well respected currency of the world
because of the Central Bank's reputation for sound monetary policy.
Next
in line is Switzerland's currency the Swiss franc. While Switzerland is
not one of the major economies of the world, the country is known for
its sound banking system and Swiss bank accounts, which are basically
famous for banking confidentiality. This, combined with the country's
history of remaining neutral in times of war, makes the Swiss Franc a
safe haven currency, or one which attracts capital flows during times of
uncertainty. When traded against the US Dollar, the Euro, Yen, Pound,
and Swiss Franc make up known as the "major currency pairs" which we
will learn more about in coming lessons. For the purposes of this course
we will focus on currencies that trade actively 24 hours a day allowing
the trader to move in and out of positions during the trading week at
anytime as he or she pleases. Although not considered part of the major
currencies there are three other currencies in addition to the ones just
listed which trade actively 24 hours a day and which we will be
covering in this course.
Known as the commodity currencies because of
the fact that they are natural resource rich countries, the Australian
Dollar, New Zealand Dollar and the Canadian Dollar are the three final
currency pairs we will be covering.
Also known as "The Aussie" the
Australian Dollar is heavily dependant upon the price of gold as the
Australian economy is the world's 3rd largest producer of gold. As of
this lesson interest rates in Australia are also among the highest in
the Industrialized world creating significant demand for Australian
Dollars from speculators looking to profit from the high yield the
currency and other Australian Dollar denominated assets offer.
Like the
Australian Dollar the New Zealand Dollar which is also known as "The
Kiwi" is heavily dependant on commodity prices, with commodities
representing over 40% of the countries total exports. The economy is
also heavily dependant on Australia who is its largest trading partner.
Like Australia, as of this lesson New Zealand also has one of the
highest interest rates in the industrialized world, creating significant
demand from speculators in this case as well.
Last but not least is the
Canadian Dollar or otherwise affectionately known as "The Loony". Like
its commodity currency brothers, the Canadian Economy, and therefore the
currency, is also heavily linked to what happens with commodity prices.
Canada is the 5th largest producer of gold and while only the 14th
largest producer of oil, unbeknownst to most; it is also the largest
foreign supplier of oil to the United States.
- Free trading apps
- Over 8,000 signals for copying
- Economic news for exploring financial markets
You agree to website policy and terms of use
Please upload forex video you consider as interesting one. No direct advertising and no offtopic please.
The comments without video will be deleted.