Asking for help on how to draw lines for a graphical panel
Have you tried using ObjectCreate() with OBJ_HLINE to draw the TP and SL lines?
OBJ_HLINE - Object Types - Objects Constants - Constants, Enumerations and Structures - MQL5 Reference - Reference on algorithmic/automated trading language for MetaTrader 5
Edit: I took a look at your code, and since you’re using the library, here’s a simple snippet to help you get started with the horizontal line
#include <ChartObjects/ChartObjectsLines.mqh>


void OnStart()
{
    CChartObjectHLine line;

    double linePrice = iHigh(Symbol(), PERIOD_CURRENT, 1);

    line.Create(0, "Line", 0, linePrice);
    line.Width(2);
    line.Color(clrAqua);
    line.Detach();

    ChartRedraw();
}

- www.mql5.com
Edit: I took a look at your code, and since you’re using the library, here’s a simple snippet to help you get started with the horizontal line
Thanks I think I made something that mostly works but is probably memory inefficient. Here's new OnTick function:
void OnTick() {
   double bid = SymbolInfoDouble(_Symbol, SYMBOL_BID);
   double ask = SymbolInfoDouble(_Symbol, SYMBOL_ASK);
   double spread = (ask - bid) / _Point / 10;
   spreadLabel.Text("Spread: " + DoubleToString(spread, 1) + " pips");
   double dbal = AccountInfoDouble(ACCOUNT_BALANCE);
   accBalLabel.Text("Balance: " + DoubleToString(dbal, 2) + "$");
   double dequ = AccountInfoDouble(ACCOUNT_EQUITY);
   accEquityLabel.Text("Equity: " + DoubleToString(dequ, 2) + "$");
   double ticksize = SymbolInfoDouble(_Symbol, SYMBOL_TRADE_TICK_SIZE);
   double tickvalue = SymbolInfoDouble(_Symbol, SYMBOL_TRADE_TICK_VALUE);
   double lotstep = SymbolInfoDouble(_Symbol, SYMBOL_VOLUME_STEP);
   double minLot = SymbolInfoDouble(_Symbol, SYMBOL_VOLUME_MIN);
   double maxLot = SymbolInfoDouble(_Symbol, SYMBOL_VOLUME_MAX);

   double riskPercent = StringToDouble(edit4.Text());
   double slDistance = StringToDouble(edit3.Text());
   double tpDistance = StringToDouble(edit2.Text());
   if (riskPercent <= 0 || slDistance <= 0) {
      Print("No riskPercent entered into edit3 or invalid sl");
      return;
   }
   double riskMoney = dbal * riskPercent / 100;
   string pipstext = edit3.Text();
   double pips = StringToDouble(pipstext);
   double lots = riskMoney/pips/10;
   lots = NormalizeDouble(lots, 2);
   string lotstext = DoubleToString(lots, 2);
   edit1.Text(lotstext);

   double takeProfitPips = StringToDouble(edit2.Text());
   double stopLossPips = StringToDouble(edit3.Text());
   double pointSize = SymbolInfoDouble(_Symbol,SYMBOL_POINT);
   double stopLossPoints = stopLossPips * pointSize * 10;
   double takeProfitPoints = takeProfitPips * pointSize * 10;
   if(showBuyLinesBtn.Text() == "ON"){
      ObjectCreate(_Symbol,"TP Buy line", OBJ_HLINE, 0, 0, ask + takeProfitPoints);
      ObjectCreate(_Symbol,"SL Buy line", OBJ_HLINE, 0, 0, ask - stopLossPoints);
      ObjectSetInteger(0,"TP Buy line",OBJPROP_COLOR,clrAqua);
      ObjectSetInteger(0,"SL Buy line",OBJPROP_COLOR,clrAqua);
   } if(showSellLinesBtn.Text() == "ON"){
      ObjectCreate(_Symbol,"SL Sell line", OBJ_HLINE, 0, 0, bid + stopLossPoints);
      ObjectCreate(_Symbol,"TP Sell line", OBJ_HLINE, 0, 0, bid - takeProfitPoints);
      ObjectSetInteger(0,"SL Sell line",OBJPROP_COLOR,clrAqua);
      ObjectSetInteger(0,"TP Sell line",OBJPROP_COLOR,clrAqua);
   } if (showBuyLinesBtn.Text() == "OFF"){
      ObjectDelete(0,"TP Buy line");
      ObjectDelete(0,"SL Buy line");
   } if (showSellLinesBtn.Text() == "OFF"){
      ObjectDelete(0,"SL Sell line");
      ObjectDelete(0,"TP Sell line");
   }
}
Improperly formatted code edited by moderator. Please use the CODE button (Alt-S) when inserting code.
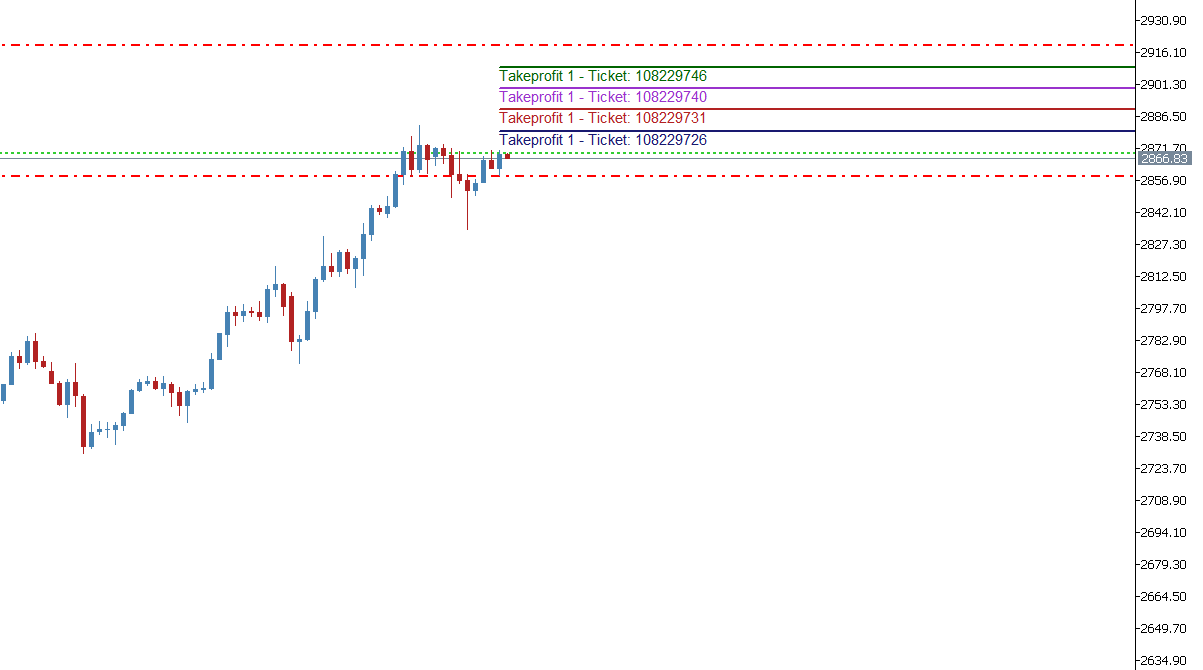
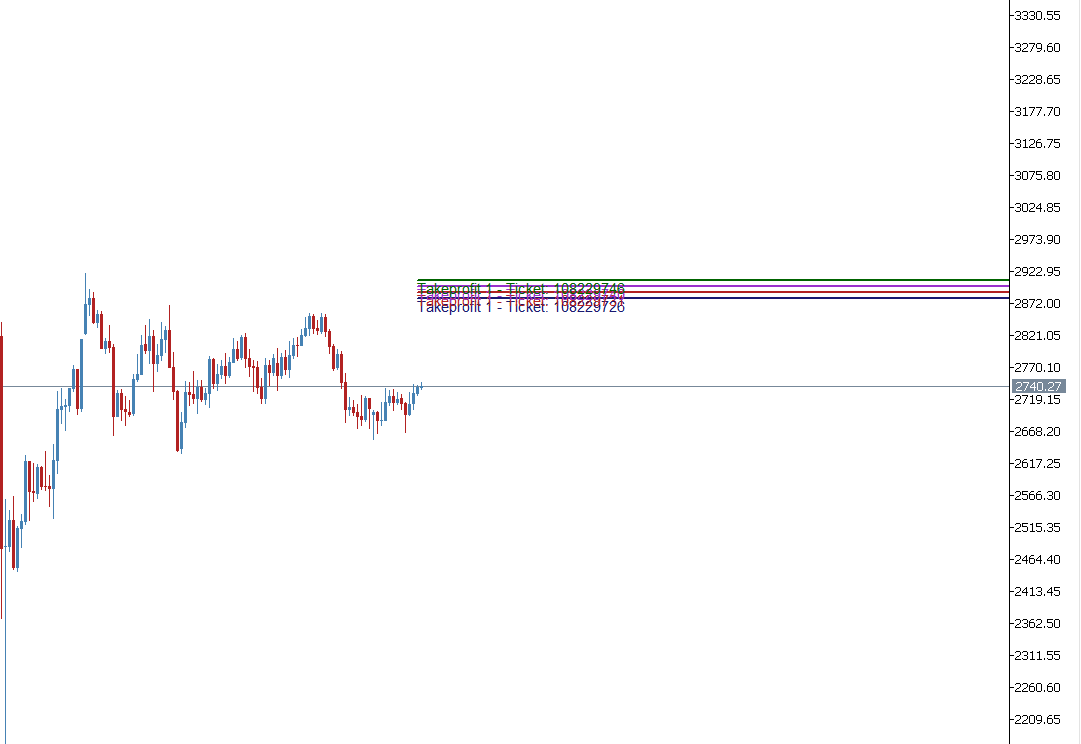
//Global Variable
long chartId = ChartID();

//+------------------------------------------------------------------+
//| DRAW TRENDLINE AND LABEL FUNCTION (TAKEPROFIT 1 LINE)            |
//+------------------------------------------------------------------+
// Draw a trend line and label for each position
void DrawTrendLineAndLabel(ulong ticket, double price, datetime pTime, bool isBuy, color lineColor)
{
    string symbol = Symbol();
    int existingLinesCount = CountExistingLines(symbol, MagicNumber);

    // Check if we can draw more lines
    if (existingLinesCount >= 4) return;

    string trendLineName = "TrendLine_" + symbol + "_" + IntegerToString(ticket);
    string labelName = "Label_" + symbol + "_" + IntegerToString(ticket);

    // Check if the line already exists
    if (ObjectFind(0, trendLineName) >= 0) return;

    // Calculate the end time for the line (e.g., 1 week into the future)
    datetime endTime = pTime + 14400;  // 1 week

    // Create trend line
    if (!ObjectCreate(chartId, trendLineName, OBJ_TREND, 0, pTime, price, endTime, price))
    {
        Print("Failed to create trend line: ", GetLastError());
        return;
    }
    ObjectSetInteger(chartId, trendLineName, OBJPROP_COLOR, lineColor);
    ObjectSetInteger(chartId, trendLineName, OBJPROP_WIDTH, 2);
    ObjectSetInteger(chartId, trendLineName, OBJPROP_RAY_RIGHT, true);
    ObjectSetInteger(chartId, trendLineName, OBJPROP_SELECTABLE, true);

    // Place the label on the left side of the line at the starting point
    if (!ObjectCreate(chartId, labelName, OBJ_TEXT, 0, pTime, price))
    {
        Print("Failed to create label: ", GetLastError());
        return;
    }
    ObjectSetInteger(chartId, labelName, OBJPROP_COLOR, lineColor);
    ObjectSetInteger(chartId, labelName, OBJPROP_FONTSIZE, 9);
    ObjectSetInteger(chartId, labelName, OBJPROP_CORNER, CORNER_LEFT_UPPER);
    ObjectSetInteger(chartId, labelName, OBJPROP_XDISTANCE, 10);  // Adjust if needed
    ObjectSetInteger(chartId, labelName, OBJPROP_YDISTANCE, isBuy ? -10 : 10);
    ObjectSetString(chartId, labelName, OBJPROP_TEXT, "Takeprofit 1 - Ticket: " + IntegerToString(ticket));

    // Add or update in positionTrendLines array
    PositionTrendLine posLine;
    posLine.ticket = ticket;
    posLine.takeProfit1Price = price;
    posLine.positionOpenTime = pTime;
    posLine.trendLineName = trendLineName;
    posLine.labelName = labelName;
    posLine.lineColor = lineColor;
    posLine.symbol = symbol; // Set the symbol
    posLine.magicNumber = MagicNumber;
    posLine.isBuy = isBuy;

    ArrayResize(positionTrendLines, ArraySize(positionTrendLines) + 1);
    positionTrendLines[ArraySize(positionTrendLines) - 1] = posLine;

    // Save the lines after adding/updating
    SaveLines();
}

//+------------------------------------------------------------------+
//| DRAW TRENDLINES                                                  |
//+------------------------------------------------------------------+
void MonitorPositionsAndDrawLines(string pSymbol, int maxPosToShow)
{
    int count = 0; // Counter for processed positions

    // Loop through all positions
    for (int i = 0; i < PositionsTotal(); i++)
    {
        ulong ticket = PositionGetTicket(i);

        if (!PositionSelectByTicket(ticket))
        {
            Print("Failed to select position by ticket: ", ticket, ". Error: ", GetLastError());
            continue;
        }

        string symbol = PositionGetString(POSITION_SYMBOL);
        if (symbol != pSymbol || PositionGetInteger(POSITION_MAGIC) != MagicNumber)
            continue;

        // Check if this position already has a trendline
        int trendLineIndex = -1;
        for (int j = 0; j < ArraySize(positionTrendLines); j++)
        {
            if (positionTrendLines[j].ticket == ticket)
            {
                trendLineIndex = j;
                break;
            }
        }

      // Only create a trendline if none exists for this position
      if (trendLineIndex == -1 && takeProfit1Enabled)
      {
         ENUM_POSITION_TYPE posType = (ENUM_POSITION_TYPE)PositionGetInteger(POSITION_TYPE);
         double entryPrice = PositionGetDouble(POSITION_PRICE_OPEN);
         double takeProfit1 = CalculateTakeProfit1Price(entryPrice, posType == POSITION_TYPE_BUY);

         datetime openTime = (datetime)PositionGetInteger(POSITION_TIME);
         datetime currentTime = TimeCurrent();

         if (currentTime - openTime < 60) // More than 1 minute has passed
         {

            // Get color based on number of existing lines
            int existingLines = CountExistingLines(symbol, MagicNumber);
            color lineColor = GetLineColor(existingLines);

            // Draw trendline and label
            DrawTrendLineAndLabel(ticket, takeProfit1, openTime, posType == POSITION_TYPE_BUY, lineColor);

            // Add trendline details to the tracking array
            PositionTrendLine posLine;
            posLine.ticket = ticket;
            posLine.trendLineName = "TrendLine_" + symbol + "_" + IntegerToString(ticket);
            posLine.labelName = "Label_" + symbol + "_" + IntegerToString(ticket);
            posLine.lineColor = lineColor;

            ArrayResize(positionTrendLines, ArraySize(positionTrendLines) + 1);
            positionTrendLines[ArraySize(positionTrendLines) - 1] = posLine;
         }
      }

        count++;
        if (count >= maxPosToShow)
            break;
    }

    // Cleanup trendlines for closed positions
    for (int j = ArraySize(positionTrendLines) - 1; j >= 0; j--)
    {
        ulong trackedTicket = positionTrendLines[j].ticket;
        bool positionExists = false;

        for (int i = 0; i < PositionsTotal(); i++)
        {
            if (PositionGetTicket(i) == trackedTicket)
            {
                positionExists = true;
                break;
            }
        }

        if (!positionExists)
        {
            ObjectDelete(chartId, positionTrendLines[j].trendLineName);
            ObjectDelete(chartId, positionTrendLines[j].labelName);
            ArrayRemove(positionTrendLines, j);
        }
    }
}

//+------------------------------------------------------------------+
//| Expert Tick Function                                             |
//+------------------------------------------------------------------+
void OnTick()
{
    MonitorPositionsAndDrawLines(Symbol(),4);
}
Help me fix this. What am I possibly dooing wrong
Thanks I think I made something that mostly works but is probably memory inefficient. Here's new OnTick function:
Improperly formatted code edited by moderator. Please use the CODE button (Alt-S) when inserting code.
- Free trading apps
- Over 8,000 signals for copying
- Economic news for exploring financial markets
You agree to website policy and terms of use
Good morning everyone, I have created a graphical panel meant for forex traders who want to follow ImanTrading's style of categorical trading. However I cannot seem to get it to draw lines for the take profit and stoploss. I know there are other graphical panels out there for free however they come with a lot of extra stuff that most people don't need or understand how to use. Nobody wants to read a 1000 page manual on how to make panel work so I made this thing (after watching this tutorial series https://www.youtube.com/watch?v=gCQfPMO5frw) to have absolutely no fat on it. Source code provided below.
I know it probably isn't the best way to make a panel but this is the first time I've ever coded one. I humbly ask for everyone's help in drawing lines because I really am either missing something obvious or just don't get it. I think you would have to use StringToDouble() to read the tp and sl edit windows and then draw the lines based off that.
If anyone has any other suggestions for stuff to add I'd appreciate it.