Discussing the article: "Econometric tools for forecasting volatility: GARCH model"
Very good work!
I read it in a heartbeat.
Thank you!
Good article. It would be interesting to know your opinion about Stepanov's article, in which he puts forward a hypothesis about non-stochastic nature of volatility fluctuations.
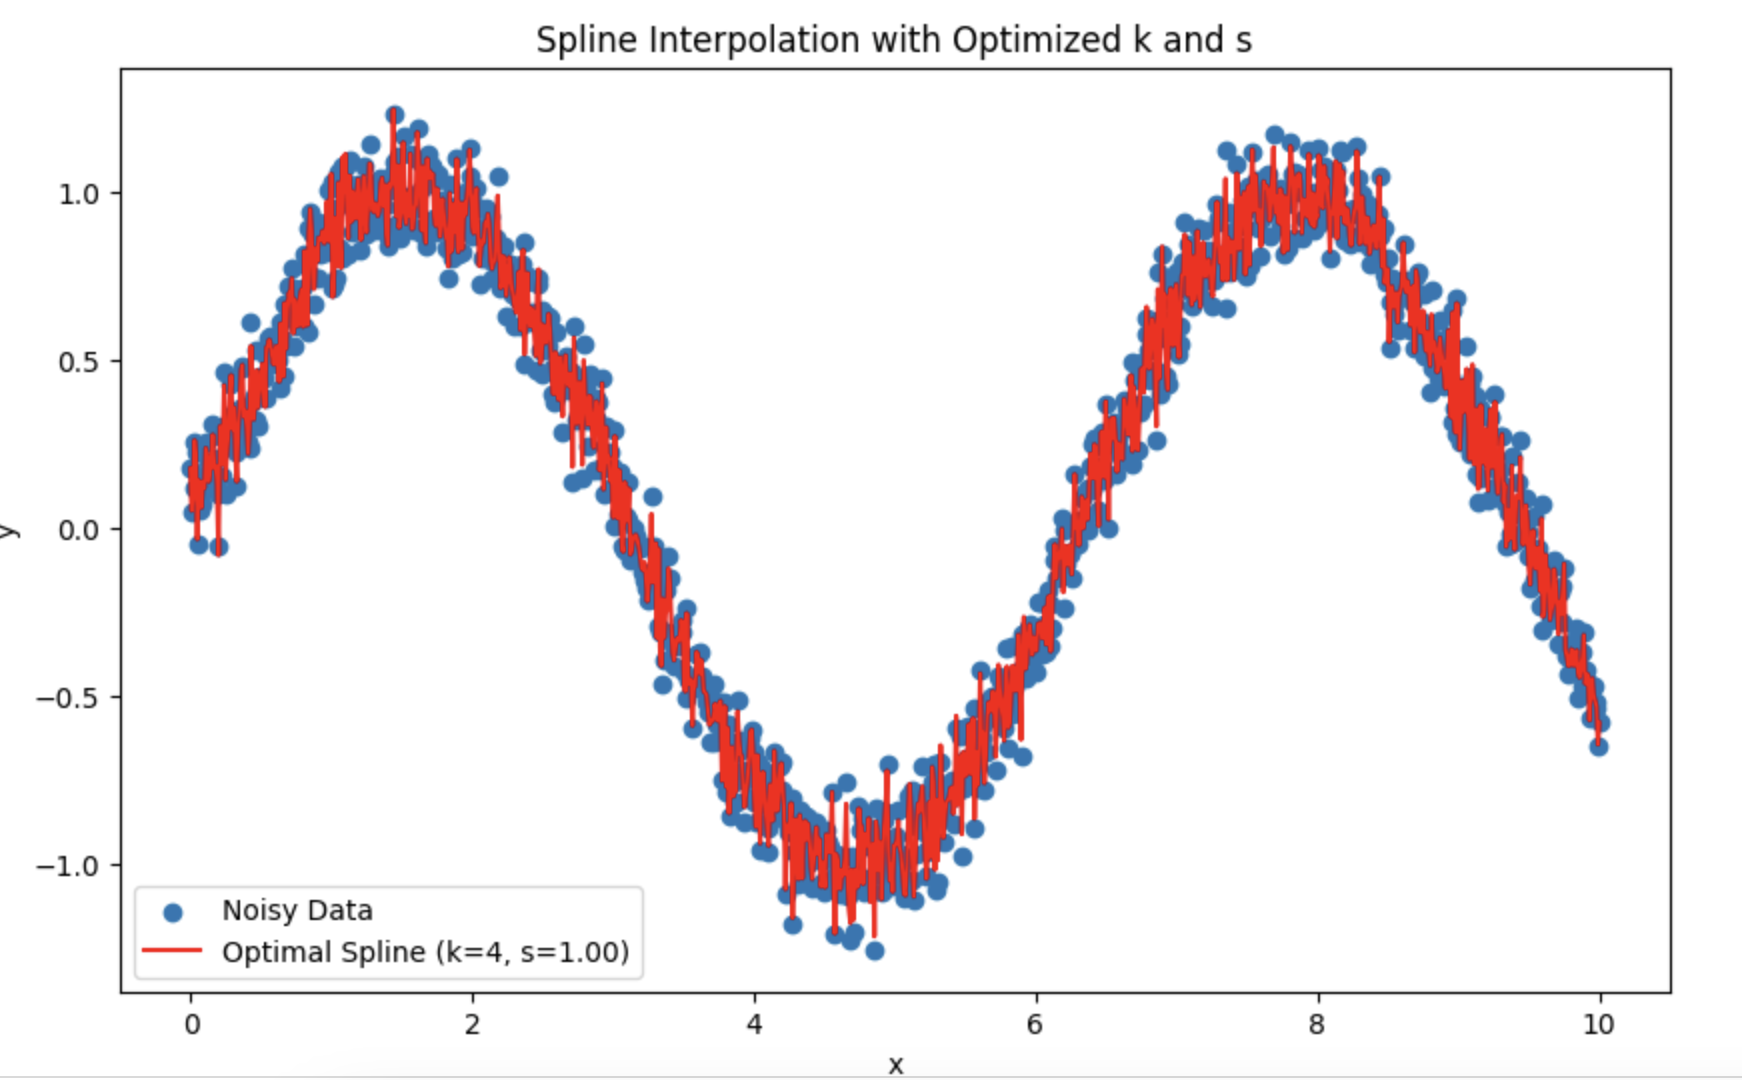
You have struck me right into my TS. I am trying splines instead of HP.
I was wondering what is better to choose the period and degree of smoothing.
It turns out that it is better to rely on the test for normal distribution of residuals?
You've struck me right in my TC. Instead of HP, I'm trying splines.
I was wondering what is better to choose the period and degree of smoothing.
It turns out that it is better to rely on the test for normal distribution of residuals?
Good article. It would be interesting to know your opinion about Stepanov's article, in which he puts forward a hypothesis about non-stochastic nature of volatility fluctuations.
The article is complex and contradictory. On the one hand, the author uses probabilistic terminology, statistical tools, characterises price increment and volatility as random variables, constructs distributions of different volatility measures, etc., on the other hand, he does not like stochastic volatility models.
Imho, yes, if you build models for increments over constant time intervals, you need to reduce everything to Gaussian noise in the end. That's probably the whole point of econometrics - all factors unaccounted for in the model should behave as smooth noise.
Interesting, haven't done this yet. In the article, the author sort of empirically selected the parameters. But it is possible to do optimisation via likelihood function.
Topic for reserch :)
Interesting, haven't done this yet. In the article, the author sort of empirically selected the parameters. But it is possible to do optimisation through the likelihood function.
Topic for reserch :)
I made LLM DeepSeek with God's help. You can substitute your own data.
Explanation:
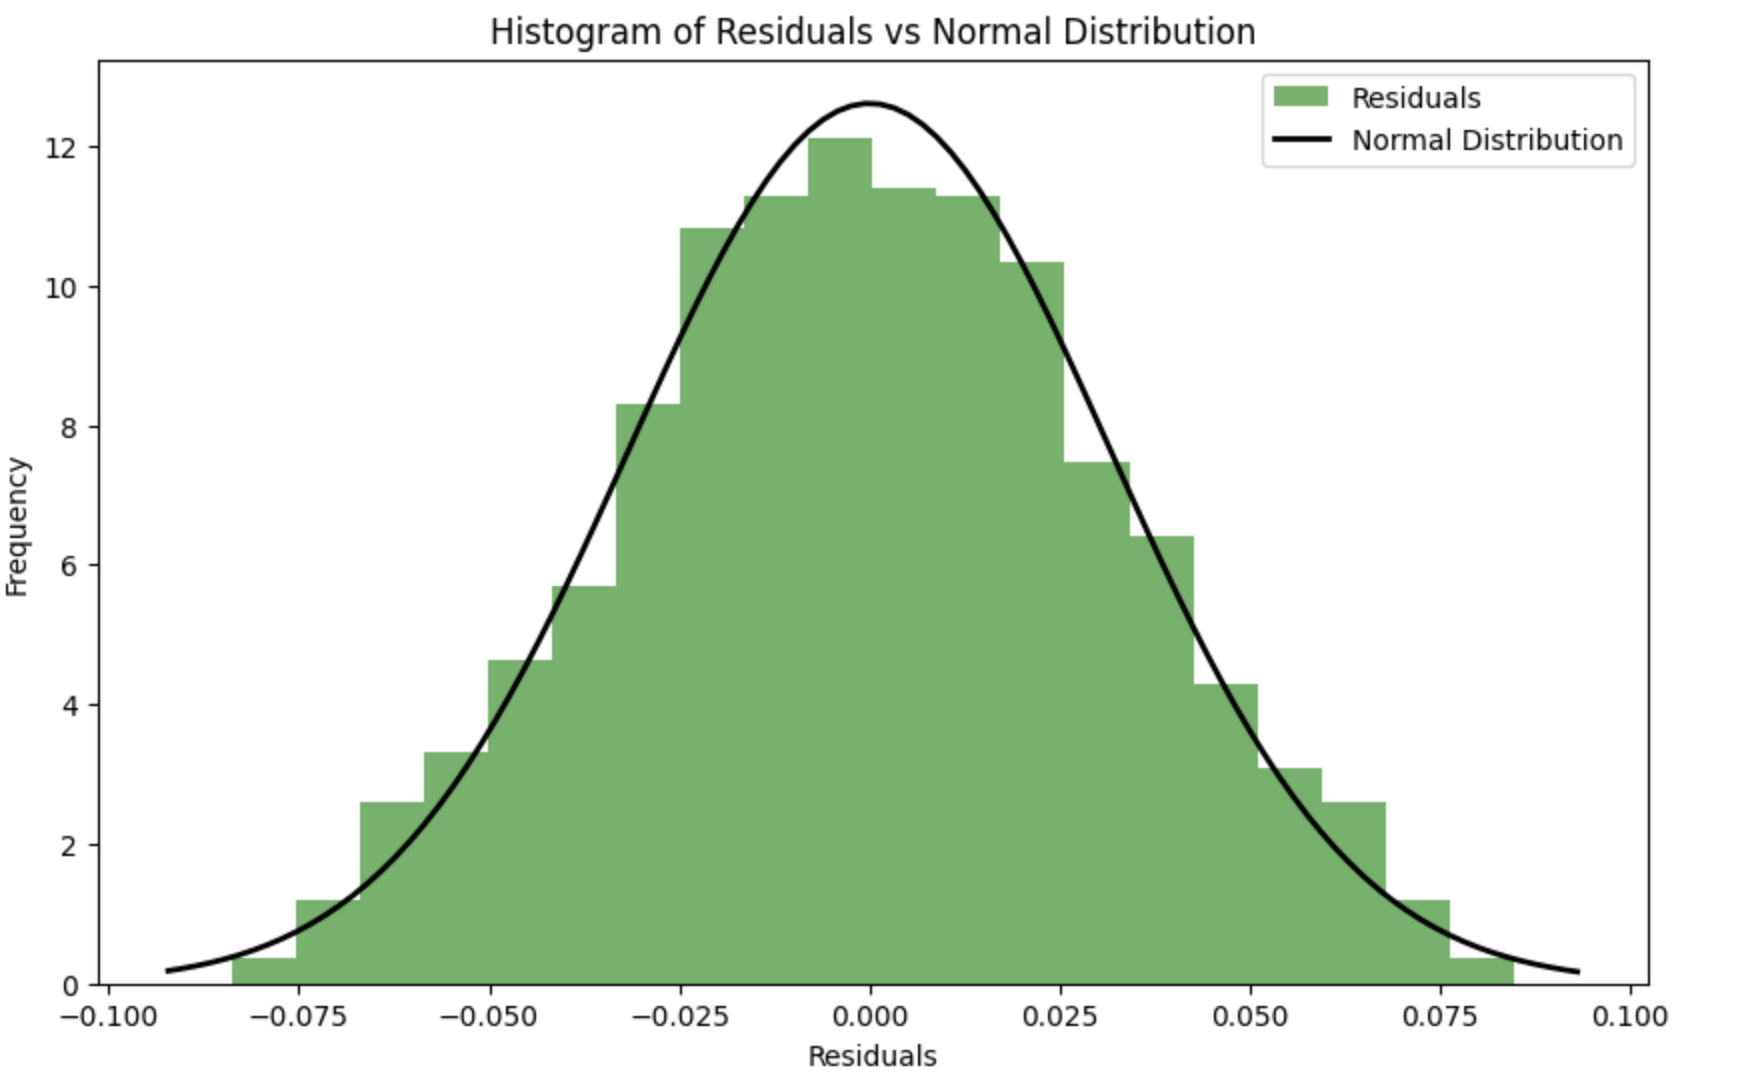
To make the residuals as close to a normal distribution as possible during the optimisation process, a criterion of agreement (e.g. Shapiro-Wilk criterion or Kolmogorov-Smirnov criterion) can be used to assess the normality of the residuals. The parameters k k and s scan then be optimised so that the deviation of the residuals from the normal distribution is minimised.
-
Error function considering normality of residuals: A new function spline_error_with_normality , which calculates residuals and uses the Shapiro-Wilk criterion to assess their normality, is introduced. The negative p-value is minimized to maximise the normality of the residuals.
-
Optimisation: It is used to optimise the parameters k k and s s based on a new error function.
This approach allows the spline parameters to be adjusted so that the residuals maximise the normal distribution, which can improve the quality of the model and the interpretability of the results.
- Free trading apps
- Over 8,000 signals for copying
- Economic news for exploring financial markets
You agree to website policy and terms of use
Check out the new article: Econometric tools for forecasting volatility: GARCH model.
The article describes the properties of the non-linear model of conditional heteroscedasticity (GARCH). The iGARCH indicator has been built on its basis for predicting volatility one step ahead. The ALGLIB numerical analysis library is used to estimate the model parameters.
Volatility is an important indicator for assessing the variability of financial asset prices. When analyzing quotes, it has long been noted that large price changes very often lead to even larger changes, especially during financial crises. In turn, small changes are usually followed by small price changes. Thus, calm periods are followed by periods of relative instability.
The first model that attempted to explain this phenomenon was ARCH , developed by Engle — Autoregressive conditional heteroscedasticity (heterogeneity). In addition to the clustering effect (grouping returns into bundles of large and small values), the model also explained the appearance of heavy tails and positive kurtosis, which is characteristic of all distributions of price increments. The success of the ARCH conditional Gaussian model led to the emergence of a number of its generalizations. Their purpose was to provide explanations for a number of other phenomena observed in the analysis of financial time series. Historically, one of the first generalizations of the ARCH model is GARCH (Generalized ARCH) model.
The main advantage of GARCH compared to ARCH lies in the fact it is more parsimonious and does not require a long-lag structure when fitting sample data. In this article, I want to describe the GARCH model and, most importantly, offer a ready-made tool for forecasting volatility based on it since the forecast is one of the main objectives when analyzing financial data.
Author: Evgeniy Chernish