Pair trading and multicurrency arbitrage. The showdown. - page 124
You are missing trading opportunities:
- Free trading apps
- Over 8,000 signals for copying
- Economic news for exploring financial markets
Registration
Log in
You agree to website policy and terms of use
If you do not have an account, please register
You will not find an imbalance in quotes (within one brokerage centre). If you do, you will need perfect execution. If you can execute perfectly, it is not a fact that they will let you withdraw.
You can try it within different brokerage centres, but again it all depends on the implementation. According to my observations, if you consider that all DCs have approximately the same quotes, earnings - a few spreads. IMHO, it is not worth it.
You will not find an imbalance in quotes (within one brokerage centre). If you do, you will need perfect execution. If you are able to execute perfectly, it is not certain that they will let you withdraw.
You can try it within different brokerage centres, but again it all depends on the implementation. According to my observations, if you consider that all DCs have approximately the same quotes, earnings - a few spreads. IMHO, it is not worth it.
Opps. In plans for forex and crypto.
Does your method have something in common with typical pair trading: buy falling, sell soaring currencies?
And do you use regression in your method? (something from its formula or the formula itself).
No statistical methods are needed to build a triangle, it is purely alignment of currencies into a symmetrical ideal, that's all.

Statistical and any other methods can be used only after the triangle is calculated correctly.
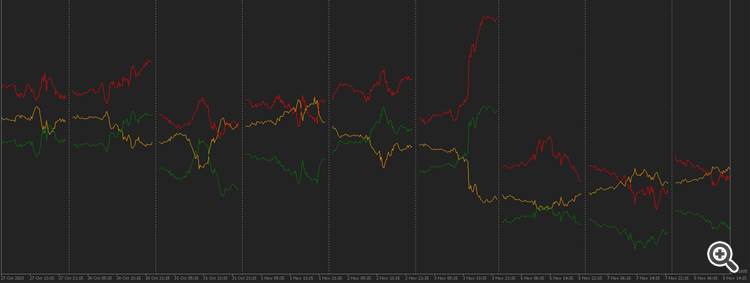
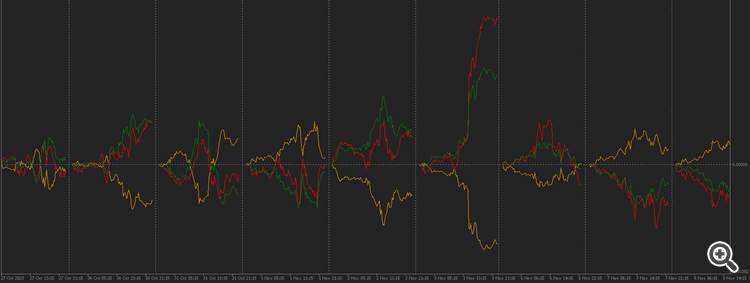
Here is a screen for your understanding. Maybe you'll get it. Here is an illustrative construction for intraday charting. Pairs are brought to the same scale, and two pairs are forcibly shifted by 500 pips at the beginning of each day.
Don't you find how the pairs like each day? )) That is, 500 pips each day. Yep, we realise there are fish here. And this is only one of the variants of many approaches.
We can build complete curvulines without shift, there will be a different picture, longer in time, etc.
But this is just a visual representation of how it works.
.
Further we calculate equity for any period, in this case it is the same from the beginning of the day.

I started to calculate from an hour to exclude unnecessary volatility due to rollover.
And then we apply formulae to bring to perfect symmetry, and build each pair through cross,
, but I have here without formulae, but by another calculation, but it is almost the same, only a little bit not exact symmetry.
We begin to think what to do with it further, or we invent a strategy and trade it
or further develop a strategy using the obtained result as new data for further calculations.
I repeat that this is only one approach that I have built, variants of building can be several, it is like a constructor.
You can not limit yourself to one triangle, but add one or several more.
Here the brain should work out what to do with it further, but the fact is that we got the true behaviour of instruments without distortions and errors expressed through their cross.
And even in a stationary form on non-cointegrated pairs )), does not all statistics and MO suffer from this?
No statistical methods are needed to build a triangle, it is purely alignment of currencies into a symmetrical ideal, and that's all.
Statistical and any other methods can be applied only after the triangle is calculated correctly.
Here is a screen for you to realise. Maybe you'll get it. Here is an illustrative construction for intraday charting. Pairs are brought to the same scale, and two pairs are forcibly shifted by 500 pips at the beginning of each day.
Don't you find how the pairs like each day? )) That is, 500 pips each day. Yep, we realise there are fish here. And this is only one variant of many approaches.
It is possible to build complete curvulines without shifting, there will be a different picture, longer in time, etc.
But this is just a visual representation of how it works.
.
Further we calculate equity for any period, in this case it is the same from the beginning of the day.
I started to calculate from an hour to exclude unnecessary volatility due to rollover.
And then we apply formulae to bring to perfect symmetry, and build each pair through cross,
, but I have here without formulae, but it is almost the same, only a little bit not exact symmetry.
We begin to think what to do with it further, or we invent a strategy and trade it
or further develop a strategy using the obtained result as new data for further calculations.
I repeat that this is only one approach that I have built, there can be several variants of construction, it is like a constructor.
You can not limit yourself to one triangle, but add one or several more.
Here the brain should work out what to do with it further, but the fact is that we got the true behaviour of instruments without distortions and errors expressed through their cross.
And even in a stationary form on non-cointegrated pairs )), does not all statistics and MO suffer from this?
In the screens it looks too much like the effect of fixing the observation point. From the specified time - necessarily all diverge. And the rate of divergence is strictly on time as ~sqrt(sum(tick_volume)). And since it (tick volume) is roughly the same and cyclical, it even dreams of limits and formulae.
Double-check yourself.
You can't stop doing what you do, just like the last time.
Statistics and the MoD will not lead you astray.
on the screens looks too much like the effect of fixing the observation point. From the specified time - necessarily all diverge. And the rate of divergence is strictly by time as ~sqrt(sum(tick_volume)). And since it (tick volume) is approximately the same and cyclic, it even dreams of limits and formulas.
Double-check yourself.
Naturally there will be a fixed starting point. And how will you calculate the equity? Without opening a virtual position.
Look carefully at the first screen, and how pairs are liked every day. From the specified time - one of the pairs is sure to converge ))
Ticks are not relevant here at all, on the screens 15m chart.
We make a trade on a balanced triangle, variant № once (not quite right)
We take 3 assets at random, for the sake of testing - XAU as the maximum, NZD as the minimum and EUR close to the middle.
Let's make a triangle XAU->NZD->EUR->(XAU) and see what happens to it at the end of the week/month.
Weighted indices (although we can take acting prices):
XAU - 0.173218
EUR - 0.095461
NZD - 0.052389
The turnover on the deal XAU->NZD is proportional to the EUR index ( it level-weighted) = 0.95461.
similarly NZD->EUR = 0.173218
and EUR->XAU = 0.052389.
subtracting the useless 0-th triangle (min.index), we have:
XAU->NZD = 0.95461 - 0.052389 = 0.043075
NZD->EUR = 0.120829
total sum of weights = 0.043075+0.120829=0.163904
We invest 2000usd in the operation,
2000*0,043075/0,163904 = 525.61 usd (at 525 .61 we sell gold and at 525.61 we buy NZD ).
NZD->EUR will be leveraged with everything else = 2000-525.61 usd = 1474.39 ( at 1474.39 we sell NZD and buy EUR at the same amount ).
We don't have such marvellous crosses, so in the presentation on majors:
.
XAUUSD - sell, volume equivalent to 525.61 USD at the moment of the deal.
NZDUSD - sell , volume equivalent to 1474.39-525.61 = 948.78
EURUSD - buy , volume 1474.39 usd
It remains to translate the volumes in usd into the base currency of the quote at the current exchange rate, take into account the tick size and lot size....
But fundamentally, the "balanced cyclical triangle" resulted in a buy operation. EUR against the basket XAU+NZD at the same average price.
It will initially depend on USD fluctuations (correlate/cointegrate weaker over time), then it will freeze and be around 0. (diverging +-4% like everyone else). This is just an operation within a balanced basket, and in them you can carefully change buy to sell and back again.
It's just that the operation highlighted in red was done incorrectly - although according to accounting it's kind of ok, this operation is necessary.
but it broke the intended balance; in local algebra the subtraction of the 0th triangle (common constant, zero fucking zero) is at the same time not quite linear correction of other weights (remaining volumes).
Friends, let's stop arguing and insulting each other and move on to concrete actions. Now I need indicators of cointegration and strength of currencies/currency pairs. I will be only glad.
There were tests for stationarity and cointegration.
I don't remember how much everything is correct there, I found it in the archives.
We start to think what to do with it further, either we come up with a strategy and trade it
or further develop a strategy using the obtained result as new data for further calculations.
I repeat that this is only one approach that I have built, there can be several variants of building, it is like a constructor.
You can not limit yourself to one triangle, but add one or several more.
Here the brain should work out what to do with it further, but the fact is that we got the true behaviour of instruments without distortions and errors expressed through their cross.
And even in a stationary form on non-cointegrated pairs )), does not all statistics and MO suffer from this?
Good afternoon.If your triangle is visualised as moving in a circle, like a pendulum, or are currency pairs playing king of the mountain?
Good afternoon.If your triangle is visualised as moving in a circle, like a pendulum, or are currency pairs playing king of the mountain?