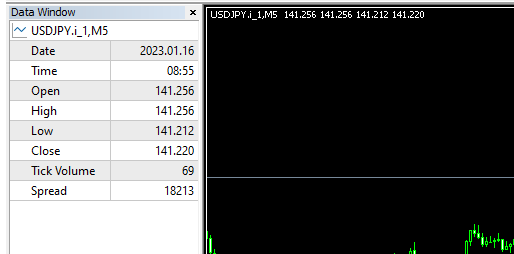
Hi there! This article provides valuable insights, and I've been searching for it for quite some time now. However, I encountered an issue when using the example you shared. The spread seems to be quite large due to the ask price. Could you please let me know if there's anything I'm missing or if there's a mistake?
As far, as i can tell, i cannot find a mistake. In my own testing i also encountered price series variations with large spreads. This can happen. If this unacceptable you can simply do more permutations and test on series with more realistic spreads.
 //---swap tick data randomly
      tempvalue.bid_d=m_differenced[i].bid_d;
      tempvalue.ask_d=m_differenced[i].ask_d;
      tempvalue.vol_d=m_differenced[i].vol_d;
      tempvalue.volreal_d=m_differenced[i].volreal_d;

      m_differenced[i].bid_d=m_differenced[j].bid_d;
      m_differenced[i].ask_d=m_differenced[j].ask_d;
      m_differenced[i].vol_d=m_differenced[j].vol_d;
      m_differenced[i].volreal_d=m_differenced[j].volreal_d;

      m_differenced[j].bid_d=tempvalue.bid_d;
      m_differenced[j].ask_d=tempvalue.ask_d;
      m_differenced[j].vol_d=tempvalue.vol_d;
      m_differenced[j].volreal_d=tempvalue.volreal_d;
Swap(m_differenced[i], m_differenced[j]);
template < typename T>
void Swap( T &Value1, T &Value2 )
{
  const T Value = Value1;

  Value1 = Value2;
  Value2 = Value;
}
The same remark applies to the methods of logarithm and inverse transformation of structural data. Etc.
Tick conversion is a rare topic. Usually this is done with only one price (bid, for example) and on bars.
I am grateful to the author for raising this topic.
Quite recently there was a topic in a Russian-language thread on this topic. There, using the best machine learning methods, they tried to generate a tick history so that it would not lose market patterns. There was a clear criterion.
Unfortunately, all attempts not to lose the patterns ended in failure. There were much more sophisticated methods than just mixing ticks.
Something successful happened only here.
Форум по трейдингу, автоматическим торговым системам и тестированию торговых стратегий
Машинное обучение в трейдинге: теория, модели, практика и алготорговля
fxsaber, 2023.09.07 07:33
I tried several algorithms. For clarity, here are a few of them.
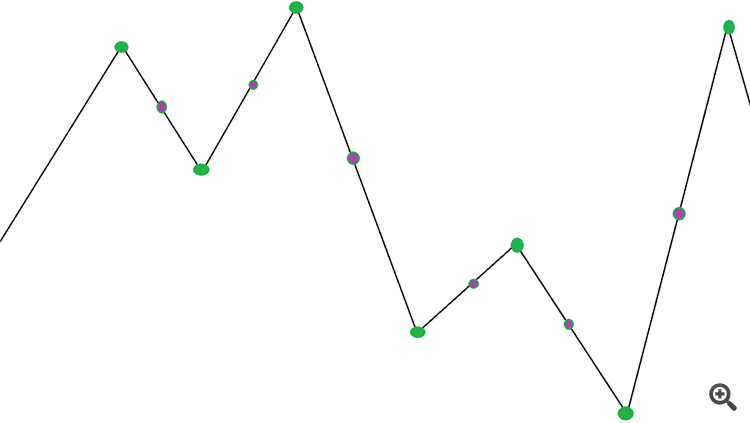
The PO is being built at the Avg price with the condition of being fixed. min. knee
- Green dots are indices of 3Z vertices in the teak array.
- Purple - the average index between the vertices.
The idea is to run through the array of ticks and randomly assign further increments at the locations of the found indexes.
It turns out that timestamps, absolute values of increments (Avg-price) and spreads are completely preserved.
According to the results.
- I run only on green indexes - drain. Obviously, such randomization straightens (reduces the number of ZZ) the final graph.
- I only run along purple ones - the grail is stronger , the higher the min condition. knee ZZ.
- I run on both colors - plum.
- 2023.09.03
- www.mql5.com
- Free trading apps
- Over 8,000 signals for copying
- Economic news for exploring financial markets
You agree to website policy and terms of use

Check out the new article: Monte Carlo Permutation Tests in MetaTrader 5.
In this article we take a look at how we can conduct permutation tests based on shuffled tick data on any expert advisor using only MetaTrader 5.
Obviously after exporting the file, make a note of where it is saved and open it using any spread sheet app. The graphic below shows use of the free OpenOffice Calc, where a new row at the bottom of the table was added. Before going any further, it would be wise to remove rows for symbols that should not be part of the calculations. Under each relevant corresponding column the p-value is calculated using a custom macro. The formula of the macro references the permuted symbol's performance metrics (located in row 18 in the document shown) as well as that of the permuted symbols for each column. The full formula for the macro is shown in the graphic.
Besides using a spreadsheet application, we could use python, which has an abundance of modules for parsing xml files. If a user is proficient in mql5, it's possible to parse the files with a simple script as well. Just remember to pick an accessible directory when exporting the optimization results from the tester.
Author: Francis Dube