Is it common to Buy Above and Sell Bellow with Bollinger bands ?
You can use indicators in the way you prefer.
funny, I was talking about this with an italian fellow this evening... anyway, I guess breaking a bollinger band is like breaking any meaningful level, it's either strong or doesn't happen.
[EDIT] actually total BS , it's more like: if it traversed or touched a bollinger band, it's a sign of the price going in this direction
It feels like I already heard this song... the price just goes up and down... this is the only rule to know, isn't it ?
Thanks, in my case I use a factor of 2, so I don't know if it can be considered as a reversal level, if so, then it does not explain the graph I showed (e.g. the first trade is a short, and has a target price in the same direction of the entry's direction).
[EDIT]
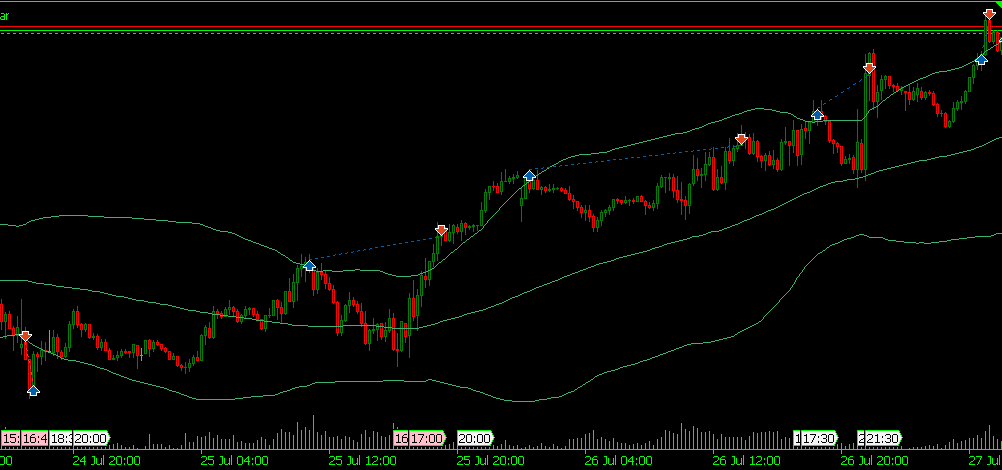
Here are the next trades, still good so far (actually I have tested this EA on historical data on 6 months and it showed very good results). My interpretation is that touching the bands is an indication that the price wants to push in the similar direction, so you buy on the upper band, and you sell on the lower one...
Thanks, in my case I use a factor of 2, so I don't if it can be considered as a reversal level, if so, then it does not explain the graph I showed (e.g. the first trade is a short, and has a target price in the same direction of the entry's direction).
Exits of thinking that rule X will generate Y consequences. No rules on market is always true or always false.
Ok, so it seems to comply with what I am doing, a higher std factor (from 2 and above) would be more fitted for a follower approach
What I have done so far is using the Strategy Tester, in my mind it can be considered as a statistical tool (since it uses actual data), but if you have any other way to do a statistical study I am open to it :)
Thanks, in my case I use a factor of 2, so I don't know if it can be considered as a reversal level, if so, then it does not explain the graph I showed (e.g. the first trade is a short, and has a target price in the same direction of the entry's direction).
[EDIT]
Here are the next trades, still good so far (actually I have tested this EA on historical data on 6 months and it showed very good results). My interpretation is that touching the bands is an indication that the price wants to push in the similar direction, so you buy on the upper band, and you sell on the lower one...
- Free trading apps
- Over 8,000 signals for copying
- Economic news for exploring financial markets
You agree to website policy and terms of use
Hello,
On some EA that I use, there is the option of Buying Above and Selling Bellow w.t.r Bollinger bands, which is, from what I understand, the opposite of the normal use of the Bollinger bands.
Here it is in action on GBPUSD M15
The first trade is a short and the two last are longs. It seems to work strangly...
But, I could not find any explanation on why.
Any idea ?