Very nice article, thank you for the demonstration.
Have you tried building a Murray 'grid' level with Silver Sen?
You can 'insert' the price and timing variables in such tool...very dynamic if you choose the right numbers ))
Plus, you can go 'deeper' really easily ... i use Fib of course for such grid, but also working on TESLA matrix,
it gives wonderful results, as new parameters revealed themsleves to decipher Chaos.
cheers
a.
Very nice article, thank you for the demonstration.
Have you tried building a Murray 'grid' level with Silver Sen?
... i use Fib of course for such grid, but also working on TESLA matrix,
it gives wonderful results, as new parameters revealed themsleves to decipher Chaos.
This tool (TESLA matrix) I don't know too... I prefer to draw simple lines on a clear chart, and no use so many indicators...
No, I did not even know what is it :-). Is this a tool for analysis or a Japan coin?
This tool (TESLA matrix) I don't know too... I prefer to draw simple lines on a clear chart, and no use so many indicators...
))
all those are simple tools, i use only those silver-sen and one cycle indi. that has the same number in it.
they are like horizontal lines but dynamic...and you can build a murrey grid
As for tesla, you already use it without knowing it =)
it s only about the number you use.
but all in all, i agree with you : the simpler the better.
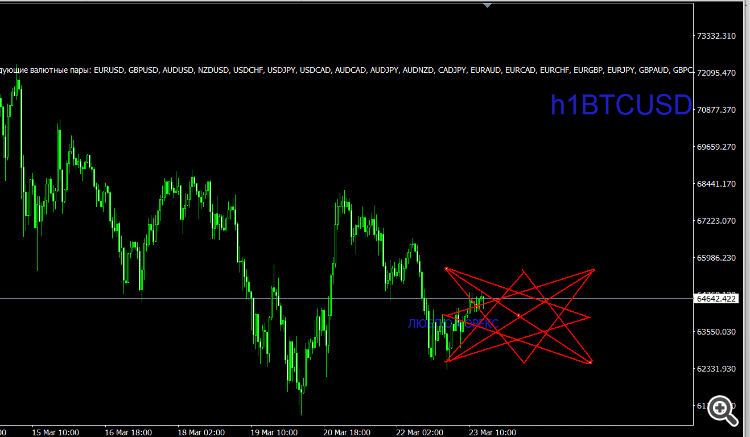
It is a beautiful drawing on the graph, it would be effective, I love all kinds of scribblers, thank you, informative.
It is a beautiful drawing on the graph, it would be effective, I love all kinds of scribblers, thank you, informative.
- Free trading apps
- Over 8,000 signals for copying
- Economic news for exploring financial markets
You agree to website policy and terms of use

New article Revisiting Murray system has been published:
Graphical price analysis systems are deservedly popular among traders. In this article, I am going to describe the complete Murray system, including its famous levels, as well as some other useful techniques for assessing the current price position and making a trading decision.
For example, when the price closes below the level on the first candle, above the level - on the second and third, we can assume that the level has been broken.
Or when the price closed above the level, then returned and closed below it, and then, no more than eight candles later, closed again above that level. Usually in this case, the extremum formed after the first breakout and directed against the trend does not reach the previous level.
Here, the finger icon denotes a "signal" candle of a horizontal level breakthrough, while the red square stands for a "breakthrough" candle, upon closing of which (respectively, upon opening of the next one), we can open a position.
Author: Oleh Fedorov