no such, use daily limits, for the euro for example it is 60p now and almost always has been
do not sell near such levels etc., ideally do not trade before and during the us session at all.
a lot of people don't realise that before the american session, mostly yesterday's data works and you have to trade yesterday's america from the japanese market.
Or, the EURUSD support level calculated using the AUDNZD symbol : 08.05.1997 00:00.
And what is the physical meaning of this construction?
How can a cross with a trading volume one or two orders of magnitude lower affect the major?
not to mention the fact that even if such levels existed they would not be fixed
no such, use daily limits, for the euro for example it is 60p now and almost always has been
do not sell near such levels etc., ideally do not trade before and during the us session at all.
a lot of people don't understand that before the american session it's mostly yesterday's data that's working and should be traded from the japanese market.
Russian is not my native language, so it is difficult to say exactly, but I will try to explain the point.
At some point the calculated level corresponds to another symbol. The idea is that this price level is so important that other symbols, having reached this price, see it as support or resistance.
Russian is not my first language, so it is difficult to say exactly, but I will try to explain the point.
At some point the calculated level corresponds to another symbol. The idea is that this price level is so important that other symbols, having reached this price, see it as support or resistance.
These were the indicators, can anyone remember the names
Maybe, but I wrote my own indicator. The result surprised me, so I started a discussion to hear a different point of view.
everyone here is an expert, if you are decent, show screenshots on the main symbols, it would be a good start, on everything.
With an explanation of why it didn't go somewhere, it happens quite well.
in forex there are even regular (albeit weak) support/resistance levels
and this is not apotheosis (I'm an artist, I see it that way) - it's statistics. Some levels are crossed by price more often than others. Not so much as to have an unlimited grail on it (5-12%), but enough to take it into account.
- Free trading apps
- Over 8,000 signals for copying
- Economic news for exploring financial markets
You agree to website policy and terms of use

Question: "Are there universal support and resistance levels in the forex market?"
By universal support and resistance I mean a level that was created at a different time, by a different financial instrument, but is related to the current moment and the selected symbol.
For example, the support and resistance level for EURUSD, calculated using the USDCHF symbol: 28.12.2007 16:00.
Or, EURUSD support and resistance level calculated using the AUDNZD symbol : 08.05.1997 00:00.
Or, EURUSD support and resistance level calculated by using the AUDNZD symbol : 12.06.2007 00:00.
Or, EURUSD support and resistance level calculated by using the USDCAD symbol : 30.10.2006 00:00.
Or, EURUSD support and resistance level calculated using the EURUSD symbol : 13.03.1997 00:00:00.
Or, EURUSD support and resistance level calculated using the USDCHF symbol: 16.12.2004 08:00.
Or, the EURUSD support and resistance level calculated using the USDCAD symbol: 12.03.2007 08:00.
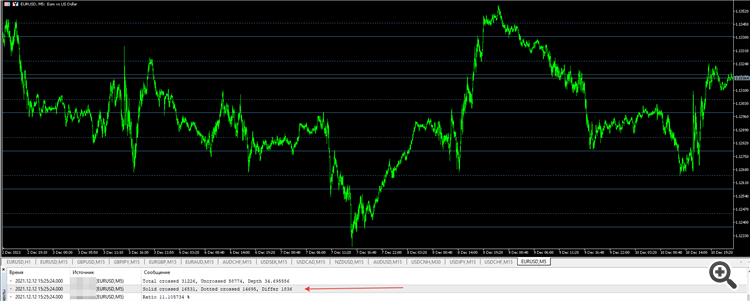
This is what the EURUSD chart looks like, where support and resistance levels are calculated for different symbols using the history available for each symbol.