You are missing trading opportunities:
- Free trading apps
- Over 8,000 signals for copying
- Economic news for exploring financial markets
Registration
Log in
You agree to website policy and terms of use
If you do not have an account, please register
in forex there are even regular (albeit weak) support/resistance levels
and this is not apotheosis (I'm an artist, I see it that way) - it's statistics. Some levels are crossed by price more often than others. Not so much to make an unlimited grail on it (5-12%), but enough to take it into account.
And how do you consider this statistic?
Russian is not my first language, so it is difficult to say exactly, but I will try to explain the point.
At some point the calculated level corresponds to another symbol. The idea is that this price level is so important that other symbols, once they reach this price, see it as support or resistance.
There are always implied support or resistance lines in the markets, but they will never be 100% guaranteed and certain. Only the probability of a bounce.
The tops or lows of currency pair waves in most forex cases will coincide in time.
You can probably calculate prices as well, but you have to time coordinate. It's not that easy to do. But I like the idea)
all spitzalists here, if you are decent, show screenshots on the main symbols, it would be a good start, on all of them.
It is not possible to prepare images for all symbols because the indicator calculates levels for those symbols whose price range is in the historical range, from minimum to maximum EURUSD price.
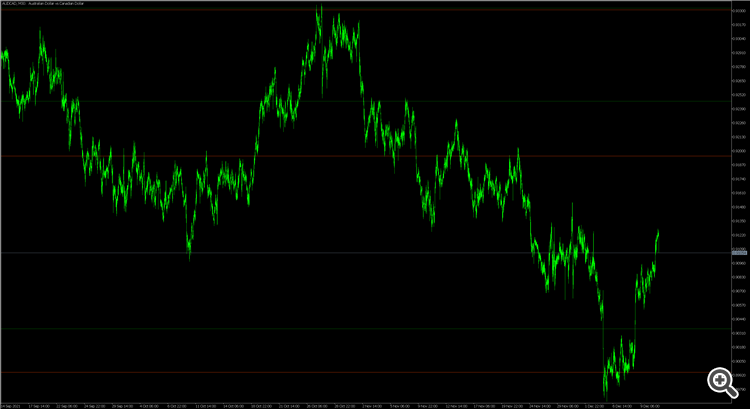
AUDCAD
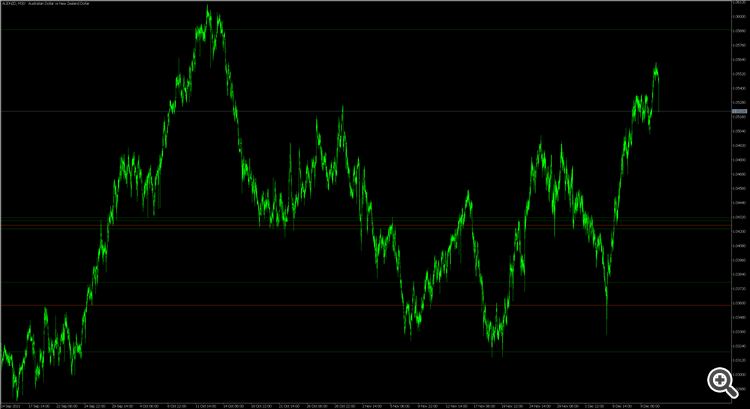
AUDNZD
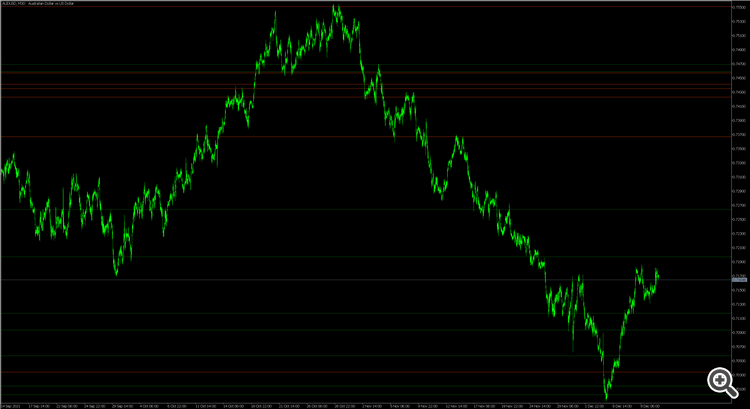
AUDUSD
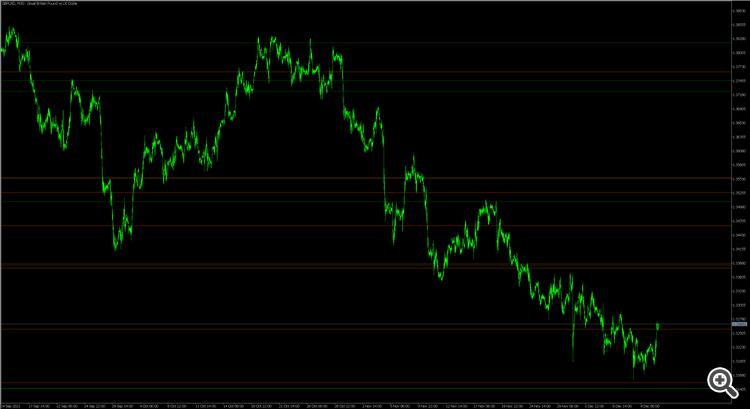
GBPUSD
USDCAD
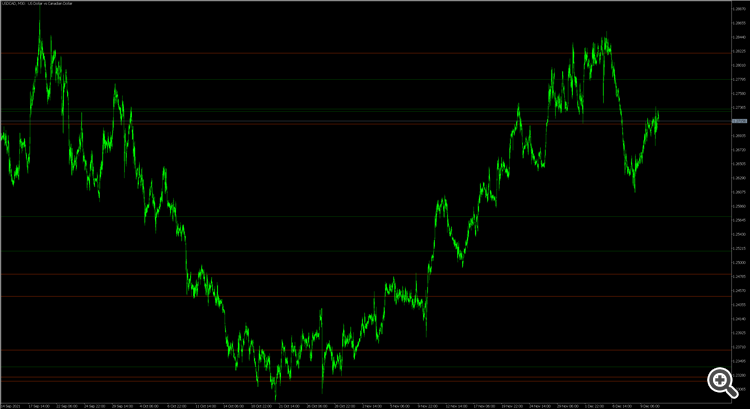
It is not possible to prepare images for all symbols because the indicator calculates levels for those symbols whose price range is in the historical range, from minimum to maximum EURUSD price.
I see that the indicator is not yours.
I see that the indicator is not yours.
)))
GBPJPY
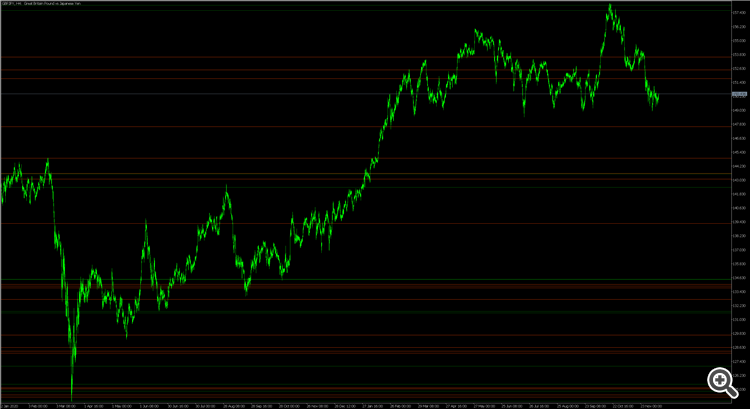
)))
GBPJPY
Ban to member.
There are always implied support or resistance lines in the markets, but they will never be 100% guaranteed and certain. Only the likelihood of a rebound.
The tops or lows of currency pair waves in most forex markets will be timed to coincide.
You can probably calculate prices as well, but you have to time coordinate. It's not that easy to do. But I like the idea)
Yesterday I watched a documentary about the collective intelligence of animals. It claimed that a group of animals is smarter than an individual subject. This, in turn, allows them to find better food and avoid predators.
The collective intelligence of animals allows to find the shortest or easiest way to the destination. So I tried to write an indicator, which is looking for support and resistance levels for all symbols in a certain price range, in order to find the prices that are important or impede all market symbols.
)))
GBPJPY
And how do you calculate these statistics?
By a script :-)
In short: candlestick projections are plotted, and the regular structure is revealed by these projections.
When you understand what to look for and why, it's not difficult in principle
Rationale:
A regular, constant cyclical cause - volatility (on the X-axis)
produce equally beautiful structures in the consequences (Y axis - support/resistance levels are peaks/drops of the same)
and regular diagonal angles of Ghana 1:1 1:2 2:1 2:3 3:2 between them
Yesterday I watched a documentary about the collective intelligence of animals. It claimed that a group of animals is smarter than an individual subject. This, in turn, allows them to find better food and avoid predators.
The collective intelligence of animals allows to find the shortest or easiest way to the destination. Therefore I tried to write an indicator, which searches for support and resistance levels for all symbols in a certain price range, in order to find the prices that are important or impede all market symbols.
there's a weak minded view,
and if even our Dasha is comparing it, and kicking