Reasoning: How do you become a millionaire? Or .... - page 14
You are missing trading opportunities:
- Free trading apps
- Over 8,000 signals for copying
- Economic news for exploring financial markets
Registration
Log in
You agree to website policy and terms of use
If you do not have an account, please register
I looked at the dots: all subsequent reds are higher than the previous ones, and the blues can sometimes be lower than the previous ones, breaking the previous pullback. I haven't looked at the middle lines. So far on this piece the trend is up.
I missed a couple of points below, but the point remains :)
About the mush I agree.
OK, he turns around like this.
But if it turns sharply.
you can't tell if it's a U-turn or if it's just a little bit more than usual.
To understand that a reversal has occurred, the chart should have already gone slightly in the opposite direction.
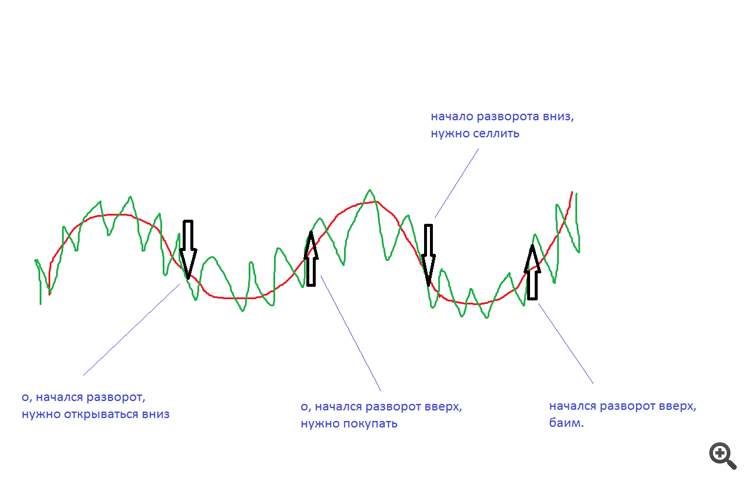
Trading reversals on a flat chart usually takes place like this:
as you can see, the results of all these trades are negative.
Is that right?!
Uladzimir Izerski:
https://www.mql5.com/ru/forum/329173/page9#comment_14562113
The point is that the trend is such an amorphous thing).
It can be seen on monthly charts, on minute charts and even on ticks.
Here is an example with H1 and next to H4
On the current hourly chart the classic trend is down, and on the H4 TF it is up. And the hourly trend is just a wave on TF H4.
This phenomenon is observed everywhere. On any TF.
It needs an art to identify the trend correctly).
Vladimir, can you be more specific about the entry conditions in your trend channels? On H1 downwards and H4 upwards, where and at what time to open deals? Why in those places and what is the probability of a correct entry? I do not understand anything. I am very interested, thank you.
For a trend system, you need to look for trend instruments.
Currency pairs are more flat than trending.
The main function of central banks is to keep the exchange rate stable.
You can even range currency pairs from the most flat to the least flat.
Crosses are more flat, while majors are less flat.
If you put a flat system on a major, you'll win 50% of the time and lose 50%.
If you put a flat system on a flat chart, you'll win more often than you lose.
In general, the structure of the forex chart is trends alternating with a flat.
In general, the forex chart structure is trends alternating between trends and flots for some time.
Vladimir, can you specify the entry conditions in your trend channels? On H1 it is down, and on H4 it is up. Where and at what time should the order be opened? Why in these places and what is the probability of a correct entry? I do not understand anything. It is very interesting, thank you.
Thank you for your interesting question.
It's hard to explain it concretely in two words. I will try to explain it briefly.
We started talking about trends here, but the components of trends are waves.
Waves are pretty damn interesting "things". They are interrelated, have characteristic behaviour features, and repeatability both in trends and in fluxes.
A trend shows the market condition in a certain TF. We can define three states: increasing, decreasing, and flatting.
Waves we have respectively: impulse and correction waves.
Let us refer to the picture post#90 on H1. WaveV1-N1 is up there and the trend is up on H4.
The probability of going up is high. Probability is my friend).
We'll talk about waves and entries later. There's the sweetest part.))
Thank you for your interesting question.
It's hard to explain it concretely in two words. I will try to explain it briefly.
We started talking about trends here, but the components of trends are waves.
Waves are pretty damn interesting "things". They are interrelated, have characteristic behaviour features, and repeatability both in trends and in fluxes.
A trend shows the market condition in a certain TF. We can define three states: increasing, decreasing, and flatting.
Waves we have respectively: impulse and correction waves.
Let us refer to the picture post#90 on H1. Wave V1-N1 is up there and the trend is up on H4.
The probability of going up is high. Probability is my friend).
We'll talk about waves and entries later. There's the sweetest part.))
Then in terms of "waves" and "flat" you can say that it is just a price "ripple"...
For some people there is a "saw", for others a "ripple", but for me the waves are like the "keys" on the piano. The main thing is to know in time which key to press.
Very simple: you open cent accounts with dubious brokers who have cent accounts on the same servers as dollar accounts. Eight of them (the more the better). In each month, you spend once a month on all accounts: 4 of them in buy, the other 4 - in sell, up to 100 and above up to 299%. Then you open small trades the whole month to give an impression of trading. The more chaotic the balance line is, the less doubts the subscribers will have. And so on, in the next month 2 on buy, 2 on sell, then 1 on buy, 1 on sell, for the fourth month one signal remains.
what kind of animals are these? i don't know them.