How many days do you calculate to get a forecast ? (purely practical interest).
In general for a normal forecast 1000 data on H1 is enough, for m5 5000-10000 is enough
Ok. Just, I have this parameter set in days, and equal to the period of ATR itself, not to overload the system with parameters. In principle, it is enough (because on what TF it is not so important to calculate).
Actually, it's a thing of the past; they even gave a Nobel Prize for it. But, of course, it doesn't bring in any profits.)
In general for a normal prediction enough 1000 data on H1, for m5 5000-10000
multicurrency as for these pictures - yes, a lot of history is needed, but it's already statistics.http://forex.kbpauk.ru/showflat.php/Cat/0/Number/25846/page/0/fpart/1/vc/1
But you don't have to use such a history all the time
Telo:
...
So now I know, that on H1 the price will pass 372 points, and on m5 it will pass 1152, so 1152-372=780 pips inside H1 only. And again, we do not know how the price will pass them, we only know the fact.
Here I have a feeling (i.e. I know that I can build a profitable trade on this), that these data may be used to work, that these points, their number is known, I just need to collect them.
I want to analyze my trading strategy, but I'm still puzzled how to apply all this knowledge and combine it into one single trading system. I want to discuss and ask what you think about it all? I think everyone has experience in analysis, subtlety, or just a different view of the problem.
There is a surprisingly beautiful method, which allows to "collect" points passed by the price literally "by the trajectory" (with some "smoothing", of course). But it has nothing to do with volume values. You rightly FEEL that points can be collected,... but in the direction you sounded - hardly... I don't see it yet...
Can you describe this beautiful method, it is interesting, I want to look at the problem from another side, to learn something new.
- Free trading apps
- Over 8,000 signals for copying
- Economic news for exploring financial markets
You agree to website policy and terms of use
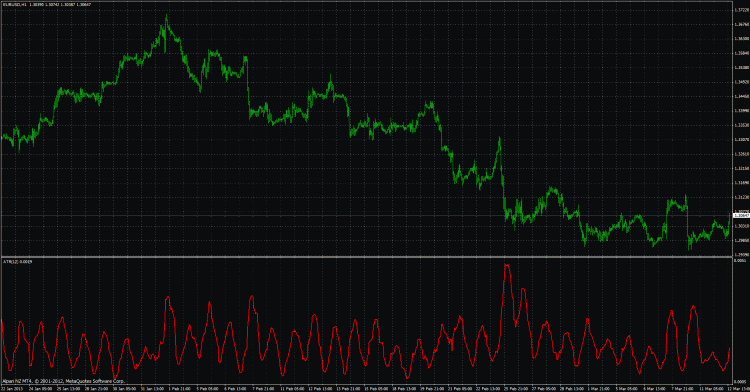
I opened this thread to talk about indicators. It is not a secret that most of the widely available indicators do not give statistical advantage to open a correct position, that is, with all the great variety of indicators, they still give in the long term probability of a correct entry = 50%, unless of course they change their period dynamically, depending on the market situation. But one indicator has interested me for a long time, it has an obvious pattern, and this pattern is cyclic and can easily be predicted with a small error. This indicator is well known and it is called APR. It shows the market volatility and is cyclical. If you apply it to the chart h1, and set the period of 12, it will be immediately visible. And it works on most currencies, but I will use GBPUSD.
I have written a predictive indicator which predicts the future value of APR quite accurately, 12 hours ahead, or 24 hours ahead, but with less accuracy. Here's a picture:
Here is the usual ATR on top, the predictive indicator on the bottom, in blue is the sample on which it makes the prediction, in red is the prediction itself directly. In this picture, the real ATR = 33, predicted 12 hours ahead - 31, i.e. the error is not high. And this is what occurred to me. Now that I know the future average volatility, I can estimate the number of points the price will pass in these 12 hours, i.e. simply multiplying 31*12=372, I get the approximate sum of all candle "sizes" in the next 12 hours. In this case we obtain the error of 24 points. Now, I know that the price will pass through 372 points in 12 hours, but I do not know whether it will pass through horizontally, upwards or downwards.
That is why I went further, took the M5 chart and overlaid it with 144 APR, it is 12*12, and it has exactly the same cyclic pattern, so here is the picture:
It turns out on the M5 predicted volatility of 8 points, multiply it by 144 candles 8*144=1152 approximately, the point the price will pass on the five-minute chart for the same 12 hours. The error in this point is 144 points, which is not much for the number of candlesticks.
So, now I know that the price at H1 will pass 372 points, and at m5 will pass 1152, so 1152-372=780 points, the price will pass only inside H1. And again, I do not know how the price will pass them, I only know the fact.
Here I have a feeling (i.e. I know that I can build a profitable trade on this), that these data may be used to work, that these points, their number is known, I just need to collect them.
I want to analyze my trading strategy, but I'm still puzzled how to apply all this knowledge and combine it into one single trading system. I want to discuss and ask what you think about it all? After all, everyone has some experience in analysis, or just a different view of the problem.