A formal definition of a master-slave - is there one? - page 9
You are missing trading opportunities:
- Free trading apps
- Over 8,000 signals for copying
- Economic news for exploring financial markets
Registration
Log in
You agree to website policy and terms of use
If you do not have an account, please register
Yeah, like pair trading. You can analyse the basket, as MetaDriver wrote, and trade the most extreme instruments.
But, it often happens that there is no return, but there is even more distance... And a loss. :)
Has anyone managed to figure out when returns are most likely?
the longer there have been deviations in time and more in magnitude))
I am digging the subject.
Pip shift from 2010, M15, EURUSD-GBPUSD.
In essence, you can gather cross volatility statistics and stop and cut off exhausts.
I don't understand, what are your theorems here?
Here's the specifics.
We see it moving together.
And here is the difference of this movement:
Stupid. At the extremes, we go in, one goes long, the other goes short. At zero we go out. This series is stationary - i.e., it is bound to return to zero. It is possible to wait for the bad weather and the loss will not be large, because one is long and the other is short.
We see it moving together.
And here is the difference of this movement:
Stupid. At the extremes we go in, one goes long, the other goes short. At zero we go out. This series is stationary - i.e., it is bound to return to zero. It is possible to wait for the bad weather and the loss will not be large, because one is long and the other is short.
How is the difference between the rates calculated? What is taken as the reporting point? How is the difference in scale taken into account?
And how is the difference between the exchange rates counted? What is taken as a reference point? How is the difference in scale taken into account?
This is the idea of cointegration.
Two pairs (any two rows) are taken. Look for a cointegration vector such that the difference between the two rows is stationary.
For the pictures above it looks like this
EURUSD = C(1)*GBPUSD + C(2) + C(3)*@TREND
Vector: 1, - c(1), - c(2), - c(3)
There is a way to calculate these values
EURUSD = 0.828446321089*GBPUSD - 1.37009549204 + 0.000206761078317 *@TREND
Once again I invite you to this thread
If c1, c2, c3 ratios are recalculated with every bar (and it cannot be otherwise, as the cross is not stationary), the zero point may fly away from the opening points. As a result, (-) if without additions and averaging.
Isn't that the same as playing the EURGBP cross back to your own swing?
I don't know. I'm not interested in ideas that don't have theory underneath - it's impossible to evaluate them.
Your theory goes into a puddle here:
You can weather the weather, and the loss will not be large, because one is long and the other is short.
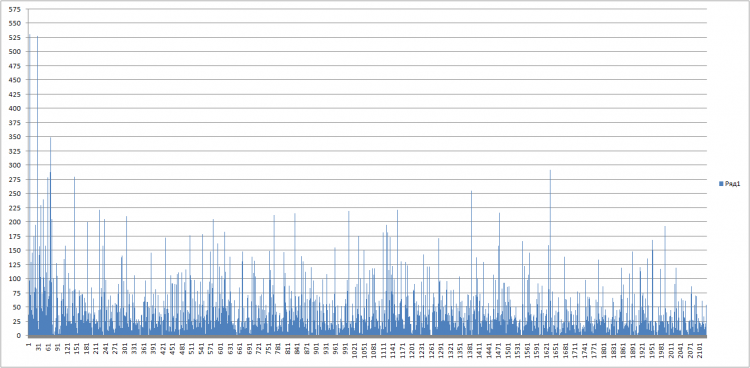
If you had experience in real trading on this principle you wouldn't make such nonsense. This is an erroneous statement. Here's a screen with losses in pips, pay attention to entry date:
Feel that without practice theory=0? :)
This is the idea of cointegration.
Two pairs (any two rows) are taken. Look for a cointegration vector such that the difference between the two rows is stationary.
For the pictures above it looks like this
EURUSD = C(1)*GBPUSD + C(2) + C(3)*@TREND
Vector: 1, - c(1), - c(2), - c(3)
There is a way to calculate these values
EURUSD = 0.828446321089*GBPUSD - 1.37009549204 + 0.000206761078317 *@TREND
Once again I invite you to this thread