I tried to experiment with your indicator MA-Slope-Index-Bin.mq5. I noticed that even in areas where there is a clear downtrend it produces much more positive values than negative. At first I thought the problem was that I was using large MA values, due to which MA turns out to be very sheepish and adding Point()/100 to the numerator and denominator of a small value, which you used, starts to introduce considerable distortions. Tried to decrease it in this way:
    slopeIndex=(extMAData[i-1]-extMAData[i-1-SlopeShift]+Point()/100*MABars)
               /(extMAData[i-2]-extMAData[i-2-SlopeShift]+Point()/100*MABars);
It didn't help - the indicator continued giving much more positive values than negative. And then I realized the obvious: dividing minus by minus gives plus. I need to change something in the algorithm to make the indicator correct. I don't know how to do it yet.
It didn't help - the indicator continued giving much more positive values than negative. And then I realized the obvious: dividing minus by minus gives plus. I need to change something in the algorithm to make the indicator correct. So far I don't understand how.
In this case, the obvious (for me) application would be as follows: positive value - just a sharp increase of slope (in the same direction), negative value - sharp change of direction.
If you make it, this indicator, useful for trading on its own, you can, for example, check the previous slope and the current slope before displaying the arrow, and if they coincide, not display the arrow, if they are different - display the arrow of the corresponding colour.
Since I like levels, I just watch how price behaves after a sharp incline jump, say, at Murray or Gann levels (remember, the difference is that Murray suggested dividing significant intervals by 8, while Gann suggested halving or dividing by 3 depending on other incoming ones). That's me for example, pivots and fibs are great too... The main thing - if I see a sudden change in slope at the level - I can assume a reversal.

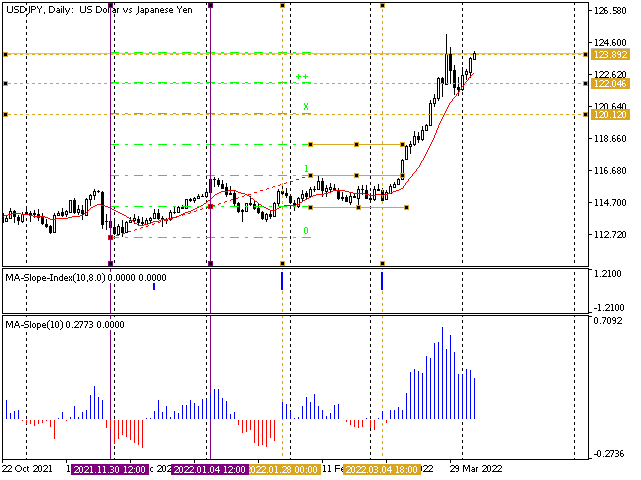
I'll add a picture to clarify the previous thought :-)
The lilac lines are the times of extremums, by which the salad levels were built (I simply divided the interval in half and put two intervals up and two down (+-100% and +-200%).
Further, on 28.01.2022 there was a signal of a sharp change in the slope. We can see that the main direction of the slope is upwards (either by the main slope indicator [bottom chart] or by the MA-box itself)... That said, price has come up to the level diagonal for the day and has, in fact, bounced off of it. Price is above the MA curve. The main trend is up, but a bounce off the diagonal suggests a correction. Possible trading options:
- either on the opening of the next candle - down with a stop at the maximum of the current candle and a takeout near the curve (MA) or level (1/2);
- or wait for the curve (and the level) to be touched - and then - up with a stop below 24.01.2022 (113.469 according to my data).
- Free trading apps
- Over 8,000 signals for copying
- Economic news for exploring financial markets
You agree to website policy and terms of use
New article What you can do with Moving Averages has been published:
The article considers several methods of applying the Moving Average indicator. Each method involving a curve analysis is accompanied by indicators visualizing the idea. In most cases, the ideas shown here belong to their respected authors. My sole task was to bring them together to let you see the main approaches and, hopefully, make more reasonable trading decisions. MQL5 proficiency level — basic.
Till now, we considered using a single MA line for receiving buy and sell market signals. However, many traders believe that the entry accuracy can be greatly improved by adding another indicator or several indicators.
So let's create the chart with two curves having the periods of 5 and 8 bars. The periods are taken from the Fibo series. One of the periods describes the "fast" line, while another one describes the "slow" one.
In addition to the already considered features, we now have the ability to see the relative position of curves and their "co-directionality" (or divergence). The distance between МАs appears as well.
Each of the parameters may strengthen or weaken some movement attributes displayed by each of the curves, as well as provide independent entry signals.
Author: Oleh Fedorov