Spread trading in Meta Trader - page 235
You are missing trading opportunities:
- Free trading apps
- Over 8,000 signals for copying
- Economic news for exploring financial markets
Registration
Log in
You agree to website policy and terms of use
If you do not have an account, please register
Yes, Gold^Silver M30 can participate too. parameters Ind 2 Line: 43, 6, 3, 6 Vol.AtrPeriod: 130.
Thank you for the parameters. I'll put it on the chart...
Where and how :-) is such a beauty drawn?
Thanks for the parameters. I will put it on the chart...
Where and how :-) is such beauty drawn?
Yes we are the drawers ourselves )).
P.S. Parameters Ind 2 Line: 43, 6, 3, 6 Vol.AtrPeriod: 130. First entry at the pullback after the signal 20$. The trade was simulated with fixed lot on silver (0.1), and dynamic one on gold (about 0.18-0.21). 2 shares were used with lot ratio 1.6.
Yes, Gold^Silver M30 can participate too. parameters Ind 2 Line: 43, 6, 3, 6 Vol.AtrPeriod: 130.
So tell me, what is this interesting instrument you're using!
yes we are the drawers themselves )).
P.S. Ind 2 Line parameters: 43, 6, 3, 6 Vol.AtrPeriod: 130. First entry at the pullback after the signal 20$. The trade was simulated with fixed lot on silver (0.1), and dynamic lot on gold (about 0.18-0.21). 2 shares were used with lot ratio 1.6.
Thank you. And why such volumes? because silver/gold ratio is 1 to 2. I have such a picture on trade, indicator parameters Ind 2 Line - by default, initial entry in the sell spread and averaging with the same volumes:
Thank you. Why such volumes? Because the ratio of silver to gold is 1 to 2. I have the following trading picture, Ind 2 Line indicator parameters are the default, starting entry to sell with a spread and averaging with the same volumes:
I didn't find any contradictions. I also have 1 to 2.
Didn't find any contradiction. i have 1 to 2 as well.
Why is that? "The trade was modelled with a fixed lot on silver (0.1), and a dynamic lot on gold (about 0.18-0.21)."
------------------------------------------------------------------------------------------
Ahhhhhh!!! That's right!
I'm a little bit lost here... :-) because 0.1x2 = 0.2. :-)
I had a quick glance at the volumes and realised that they were 1 to 1! :-)
Volumes in Ind 2 Line. are calculated based on the ATR parameter - Vol.AtrPeriod.
Output value of this indicator is not constant (depends on volatility). The less volatility on one pair relative to the other, the more volume we use in trading on this pair. We cannot have constant volumes during the whole history. With three or more instruments, this task is much more difficult.
Attention = Information for those actively trading the short-term gold-silver spread(XAU-XAG=2^1). Since the first days of December, the spread has been reversing its seasonal trend. Here is a graph of the average multi-year (3-5-8 year) seasonal spread trends with the above balanced ratio: ... ... ...
Good luck to everyone!
Off-topic, but the info will be useful to all! Below are excerpts from a seasonal review (on precious metals for December) I wrote for Pantheon-Finance:
----------------------------------
... For the seasonal analysis of precious metals I am displaying charts of multi-year seasonal trends of goldGCG3, which is the most liquid February futures contract right now.
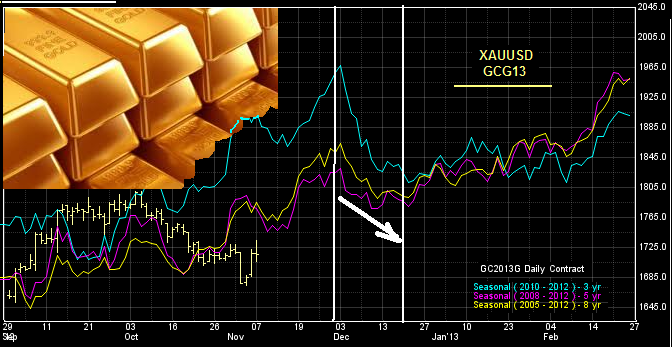
Here (3-5-8 year averaged charts) it is clearly seen that since the beginning of the current month there is a UP-trend break and downward movement begins! Fundamentally, this can be explained by some decline in jewellery demand for precious metals! We have already noted in our long-standing review back in September that the jewellery industry has been gradually, in advance, accumulating stocks since September-months, maintaining a steady demand for gold - as you can clearly see in the seasonal chart! Wholesale demand is now falling as the jewellery "structures" have cut back on their wholesale purchases and are starting a massive pre-Christmas retail sale of finished goods!
Lower prices are expected by the early 20s of December, after which some stabilization and even a slight increase will follow - until mid-January! But that's the topic of our next review!
Recommended tactics: medium- and short-term gold sales on the pullbacks. We use the tools of the standard technical analysis on small (M30-H1, - by our seasonal standards) timeframes. To determine the optimal entry/exit points.
Volumes in Ind 2 Line. are calculated based on the ATR parameter - Vol.AtrPeriod.
//// .... . With three or more instruments this task is much more difficult...
Well, why so pessimistic?
Let's take the spread 2*silver - (gold+copper)!
We set the size of silver as a benchmark, i.e. constantly equal to one.
Then the sizes of copper and gold will be calculated in the price lines in a corresponding way in relation to the benchmark - silver!
The spread in the price index is now set as "2*silver vs (copper+gold)", i.e.
SIF3 - GCG3 - HGF3 = 2*1 - 2 - 3 (dimensions rounded to whole values). On Saturday evening, by the way, there was such an entry - shown with arrows. Which we would have profitably closed yesterday afternoon on the upper edge of the spread line channel!
At the size indicated - the total profit on closing the positions would have been about +$1300 to +$1400, taking into account the losses on commissions.
=================
Looking at the indices: there was a triple entry on Friday on the price divergence, and on Thursday .... We can look deeper, but we need to charge the Z-trades of silver and copper, because the F3-January ones were illiquid in November.
Setting the size of silver as a benchmark...
And if I don't set any parameters, how should I calculate?
For now I'm stuck on this article https://www.mql5.com/ru/code/10096 , so that ideally, in the EA, - to set only pairs, and what currency and how it is correlated, with what coefficients - let it think for itself.