You are missing trading opportunities:
- Free trading apps
- Over 8,000 signals for copying
- Economic news for exploring financial markets
Registration
Log in
You agree to website policy and terms of use
If you do not have an account, please register
image
It would be interesting to see how this indicator works on specific instruments,
i.e. look at the line showing the difference "cluster_value_of_the_basic_currency" - "cluster_value_of_the_quoted_currency" on a specific instrument...
That's when, immediately, one could assess the suitability of this indicator for real trading...
How do you think such a line should look like?
You and I have already talked about this subject. I can repeat the drawing of this line:
Clearly, such a line is good for real trading.....
The above line is the difference I mentioned between "cluster_value_of_the_basic_currency"-"cluster_value_of_the_quoted_currency"...
The only remaining problem is to get the tool's price line not with a dumb and monotonous
>> The only remaining problem is to get the tool price line not with a dumb and monotonous МАshka (like now I use МАshka with an averaging period of 14 to get the tool price line),
But using "non-linear" method that takes into account instrument's price behaviour at different time intervals of history.
................
....
I was also interested in Semyon Semenych's method at the time, but there were many nuances in its application. I was not satisfied with the method. I had to think about it and experimented for a long time. I applied my own method of analysing the interaction of a group of currencies and obtained a currency demand indicator. The result is impressive. It works with less resources on any timeframe. The group analysis rules, especially for small timeframes. Here is an example: Green - dollar, blue - pound, red - franc, white - yen, lilac - eur.
Nice pattern.
It's a beautiful drawing.
And this one is even prettier, especially if you compare it to my previous drawing...
When, in the end, by the method of "iterations" that bring limited, system-cutting losses, one gets into such resonance,
then those losses appear to be negligible....
.......
It would be interesting to see how this indicator works on specific instruments,
i.e., look at the line showing the difference "cluster_value_of_the_basic_currency" - "cluster_value_of_the_quoted_currency" on a specific instrument...
That's when, right away, you could assess the suitability of this indicator for real trading...
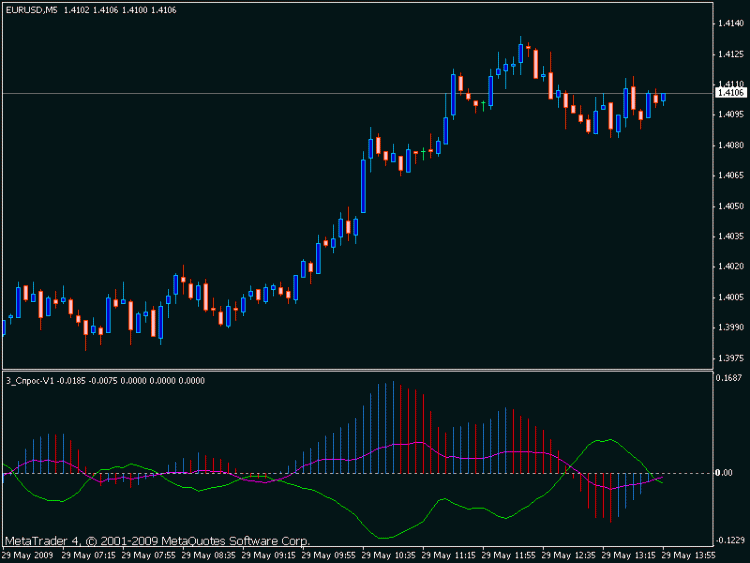
I assume that there is some balance in the currency group. I have this value 0 (zero) Any deviation of any currency (not a pair but one currency) from zero is taken into account by the indicator. In the picture of 5 min lines of EUR and USD, the histogram shows the ratio of a particular pair of USD,
I assume that there is some balance in a group of currencies. I have a value of 0 (zero) Any deviation of any currency (not a pair but one currency) from zero is taken into account by the indicator. In the picture of 5 min lines of EUR and USD, the histogram shows the ratio of a specific pair of USD,
Did I get it right - the histogram shows the difference "euro cluster value - dollar cluster value"?
If so, you can trade, even on M5, there will only be a lot of "chatter".
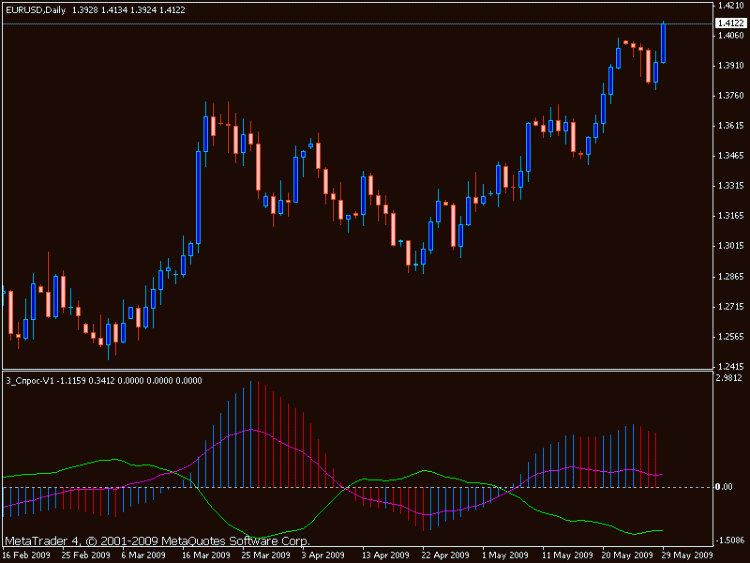
If you do not mind, give some pictures on D1 for such instruments:
"EURUSD,"GBPUSD",
"AUDUSD",
"NZDUSD",
"USDCAD",
"USDCHF",
"USDJPY"
..................................................
Actually, for a specific instrument, the lines of cluster values of currencies included in the instrument are not needed, one histogram is enough.
-------------------------------------------------------------------------------------------------------------
If it is not a big secret - how do you estimate the change of instrument's value?
For example, the change of the instrument price is calculated in a simple way - I subtract the MA value on the bar 1 from the MA value on the bar 0,
I normalize the obtained difference (to remove the constant component) and divide it by the instrument point value (see attached indicator).
The averaging period of the MASK is 14.
Did I get it right - the histogram shows the difference "euro cluster value - dollar cluster value" ?
If so, you can trade, even on M5, there will only be a lot of "chatter".
If you do not mind, give some pictures on D1 for such instruments:
"EURUSD,"GBPUSD",
"AUDUSD",
"NZDUSD",
"USDCAD",
"USDCHF",
"USDJPY"
..................................................
Actually, for a specific instrument, the lines of cluster values of currencies included in the instrument are not needed, one histogram is enough.
-------------------------------------------------------------------------------------------------------------
If it is not a big secret - how do you estimate the change of instrument's value?
For example, the change of symbol price is calculated in a simple way - I subtract the value of MA on bar 1 from the value of MA on bar 0,
I normalize the obtained difference (to remove the constant component) and divide it by the instrument point value.
The averaging period of the MA is 14.
1. Correctly understood - the histogram shows the difference
2. this is my little secret. I will only say that it is different but takes into account all the cluster relationships.
3. I do not consider AUDUSD, NZDUSD, USDCAD in my index package, but if necessary, I can create any set of currencies and it will work correctly.
And the lines of cluster values of currencies included in the symbol are very useful. They contain more information than a bar chart.
On the daily chart I estimate the situation on the weeks, on the daily chart on the quadruple.
2.