Random Flow Theory and FOREX - page 38
You are missing trading opportunities:
- Free trading apps
- Over 8,000 signals for copying
- Economic news for exploring financial markets
Registration
Log in
You agree to website policy and terms of use
If you do not have an account, please register
I am attaching the source code of the header file lapack.mqh. It describes the main functions to calculate the inverse matrix.
All comments are in English (taken from LAPACK library sources), I think you will understand it.
I checked the functions' performance more than once. I compared their results with those obtained in Matlab. So far, I had no criticism.
Here is the code of the script where I show an example of how to use the lapack.mqh functions.
to Mathemat
You won't be able to write an article (on the application of Kalman). If you want to write something, you have to do it well, and it takes time.
I found a link there, with a simple example showing how it all works.
http://www.navgeocom.ru/gps/kalman/
The example is the simplest one - it's an estimate of a constant value. But the theory itself allows you to operate with matrices. And as I said (and gave an example above in the branch), you can put the following data on quotes into the matrix - price, speed, acceleration, autocorrelation time, etc. You can do this not with just one pair, but all currencies at once, add mutual correlation there and get a current estimate with all the correlations and most importantly predict ... (like in navigation hardware, a lot of sensors, satellites (read currencies), a lot of measurements (quotes), there is mutual correlation and errors (noises) and it all moves with its own speed and acceleration), and we need to know exactly where we are now (let it be USD) and where it is moving there XYZ coordinates( + related, unrelated, spherical, polar ...) we have instead EUR/USD, GBP/USD etc.д.
I seem to have got something working, but spent over 3 months on it and still can't catch all the inaccuracies of the work, and that's just the analysis of one currency. The matrix is 2*2. And if we take 12 currency pairs, for each 3 equations, we will have to rotate matrix 36*36, which is already .....
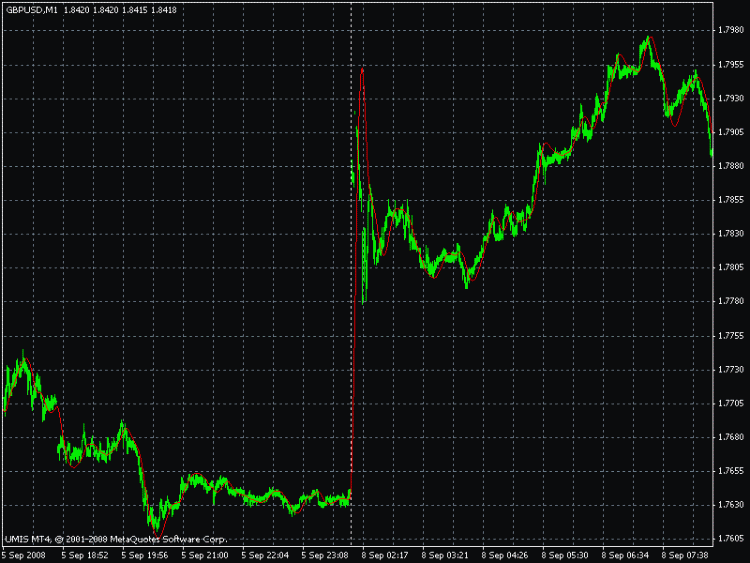
Here is an example of how the gap worked on Monday.
But I can't catch initialization errors. Manually I see that sometimes it starts incorrectly, I can fix it manually and kick it to work properly, but I can't do it automatically and I want to take part in championship with it ((
Yes, he's done well in the gap. And about "I'd like to compete in the championship with it ((" - that's a strong statement. Do you think the Expert Advisor will pass the 5-minute barrier during testing from the beginning of 2008 up to August?
P.S. Here tried looking in the Rules about that 5 minutes. There is nothing. Although it could be clearly spelled out: "no more than 5 minutes on an MQ computer with such-and-such configuration". But I remember that it was mentioned in separate threads of the forum.
Yes, he's done well in the gap. And about "I'd like to compete with it in the championship ((" - that's a strong statement. Do you think the Expert Advisor will pass the 5-minute barrier during testing from the beginning of 2008 up to August?
P.S. Here tried looking in the Rules about that 5 minutes. There is nothing. Although it could be clearly spelled out: "no more than 5 minutes on an MQ computer with such-and-such configuration". But I remember it being mentioned in separate forum threads.
The indicator works fast. Just as fast as a normal MQ.
to Mathemat
Here's a theorem, a test of adequacy.
"Theorem: A process is then and only then adequate to the model,
"when the unrelatedness is white noise.
Note: This can only happen when
The quality problem is determined by the extrapolation problem."
to Mathemat
Статью (по применению Калмана) видно не получиться написать. Если что то писать, то нужно делать это хорошо, а на это нужно время.
Нашел ссылку там, на простом примере показано как все работает.
http://www.navgeocom.ru/gps/kalman/
Пример самый простой, оценка постоянной величины. Но сама теория позволяет оперировать с матрицами. А в матрицу как я говорил (и приводил пример выше по ветке) можно вложить следующие данные по котировкам – цена, скорость, ускорение, время автокорреляции и т.д. Можно это делать не с одной парой, а сразу все валюты, добавить туда взаимную корреляцию и получать текущую оценку с учетом всех взаимосвязей и что самое важное прогнозировать … (по аналогии с навигационной аппаратурой, куча датчиков, спутников (читать валют), куча измерений (котировок), есть взаимная корреляция и ошибки (шумы) и все это движется со своей скоростью и ускорением), и нам нужно точно знать где мы сейчас находимся (пусть будет USD) и куда он движется там координаты XYZ( + связанные, несвязанные, сферические, полярные …) у нас вместо этого EUR/USD, GBP/USD и т.д.
У меня кое-что вроде получилось, но потратил на это более 3-х месяцев, и до сих пор не могу отловить все неточности работы, и это только анализ одной валюты. Матрица 2*2. А если взять, 12 валютных пар, на каждую 3 уравнения, то надо будет вращать матрицы 36*36, а это уже ….
Вот пример работы, как отработался гэп в понедельник.
Но никак не могу отловить ошибки инициализации. Вручную вижу, что он иногда неправильно запускается, руками могу все поправить, отпинать его что бы правильно заработал, но вот в автомате никак, а так хочется поучаствовать с ним в чемпионате ((
T3_mod. I'm missing quotes before the gap, Kalman is better in some places, but they are very similar. I think it's possible to create a machine with a stat advantage in inflection points, just need a different way to present the quotes data....just need a different way of presenting the quote data.
Has anyone tried to build a scale with tick time intervals? It would be interesting to look at it.
There is nothing easier if you use MS XL.