Tics: amplitude and delay distributions - page 8
You are missing trading opportunities:
- Free trading apps
- Over 8,000 signals for copying
- Economic news for exploring financial markets
Registration
Log in
You agree to website policy and terms of use
If you do not have an account, please register
When discussing ticks I have long been interested in the answer to the following question: why do we choose extreme values (open, close) or maximum and minimum for calculations from a period size sample (M1, M5, etc.)? In statistics other values are used: mean (everyone believes it tends to mo), median, well sometimes modulus. I took some ticks from DukasCopier:
and did the following calculations:
Of course there are differences. So far I cannot judge about their fatality. But how much can we trust the values of the mean and median in the sense of their representativeness to the relevant part of the sample? Only a normal law can be fully trusted. Look at what we have in terms of descriptive statistics for the whole interval shown in the table for M15:
As it should be, for a large number of ticks there is a normal law on view, but the Jarque Berg statistic strictly rejects the hypothesis of the normality of the law.
For the first 15 minutes (interval 1):
For the second interval: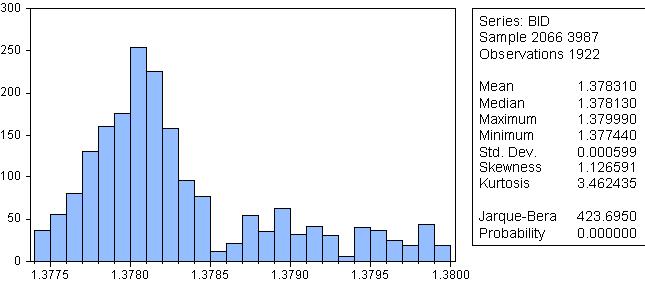
For the fifth interval (largest differences):
Total diversity. Could this diversity be the reason to apply OCHL?