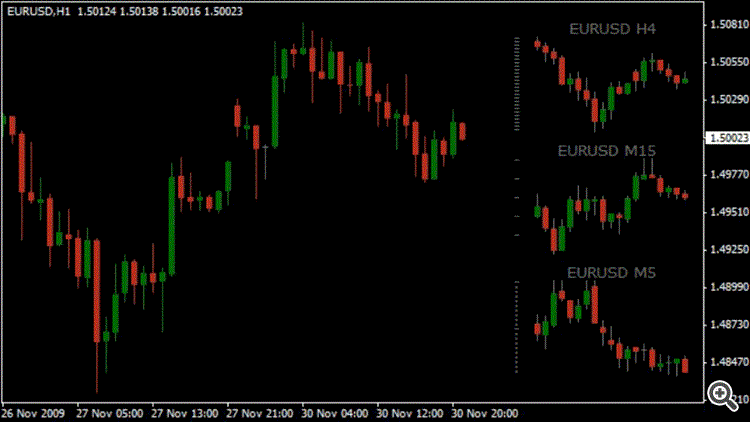
- Please edit
your (original) post and use the CODE button
(Alt-S)! (For large amounts of code, attach it.)
General rules and best pratices of the Forum. - General - MQL5 programming forum
Messages Editor - It's not a simple conversion, since MT4 can't do that. Look in the Codebase as there are indicator that can show mini-charts of other TFs.
- I have stratman_minichart_v11.pdf (attached) but no code.

Files:
stratman_miniChart.zip
463 kb
You are missing trading opportunities:
- Free trading apps
- Over 8,000 signals for copying
- Economic news for exploring financial markets
Registration
Log in
You agree to website policy and terms of use
If you do not have an account, please register
Hello,
Anybody help me to do that? "Convert from Amibroker to MQL4 (display multi time frame chart in one window chart)"
Example like that, can you help me to convert? => Thank you!
"
_SECTION_BEGIN("Chart mmulti timeframe");
SetChartOptions(0,chartShowArrows|chartShowDates);
_N(Title = StrFormat("{{NAME}} - {{INTERVAL}} {{DATE}} Open %g, Hi %g, Lo %g, Close %g (%.1f%%) {{VALUES}}", O, H, L, C, SelectedValue( ROC( C, 1 ) ) ));
Plot( C, "Close", ParamColor("Color", colorDefault ), styleNoTitle | ParamStyle("Style") | GetPriceStyle() );
_SECTION_END();
wc = TimeFrameCompress( Close, inWeekly );
/* now the time frame is still unchanged (say daily) and our MA will operate on daily data */
dailyma = MA( C, 1 );
/* but if we call MA on compressed array, it will give MA from other time frame */
weeklyma = MA( wc, 1 ); // note that argument is time-compressed array
Plot( dailyma, "DailyMA", colorRed );
weeklyma = TimeFrameExpand( weeklyma, inWeekly ); // expand for display
Plot( weeklyma, "WeeklyMA", colorBlue );
mc = TimeFrameCompress( Close, inMonthly );
monthlyma = MA(mc,1);
monthlyma = TimeFrameExpand( monthlyma, inMonthly );
Plot( monthlyma, "monthlyma", colorYellow );
"