Sinewave indicator
Sine Wave - indicator for MetaTrader 5
Sine Wave indicator was developed in 1996 by the American analyst John Ehlers, who called it a "trend oscillator". It is based on the idea of the economical processes periodicity: the indicator detects this periodicity violations.
The indicator acts in a completely opposite way comparing to the adaptive moving averages during a trend market: in case of a definite trend, both indicator lines (Lead Sine and Sine Wave) move parallel to each other and show the trend direction by their location relative to each other; in case of a flat, the Sine Wave indicator quickly reacts on the market swing movements. That is one of a few indicators that can be used both during a trend market and a flat and it shows accurate results in either case.
The simplest way to automatize trading using the Sine Wave indicator is to create the automated trading system that can generate buy and sell signals in case of two lines crossing. Therefore, positions will be closed when these lines cross with different periods in the opposite direction.
Two versions of this indicator are available. Original code version - Sinewave.mq5. Sinewave2.mq5 indicator provides a small filtration of chaotic oscillations of the Lead Sine line.
and the article - Advanced Adaptive Indicators Theory and Implementation in MQL5 -
Phasor or Phase Vector is a vector that shows amplitude and phase of a cycle. According to Euler's formula a sinewave can be represented as a sum of two complex number components. Please observe rotating phasor depicting a sinewave cycle below.


- en.wikipedia.org
If more so you can make a search by yourself for the Market for example, or go to Freelance to find the coder who can help.
----------------
Forum on trading, automated trading systems and testing trading strategies
How to Start with Metatrader 5
Sergey Golubev, 2017.08.27 08:00
Freelance
The forum
- What MQL5 developers think about the Freelance service
- MQL5.com Freelance: Developers' Source of Income (Infographic)
- Freelance, decompilation, the rules, examples of the decompiled code - the thread with examples
- Some new Freelance services (translation, consultation, converting) - the post.
- Freelance service new webdesign - the post
The articles
- How to implement traders' orders and make a profit in the MQL5 Freelance service
- Freelance Jobs on MQL5.com - Developer's Favorite Place
- MQL5.com Freelance: Developers' Source of Income (Infographic)
- Do Traders Need Services From Developers?
- A Few Tips for First-Time Customers
If more so you can make a search by yourself for the Market for example, or go to Freelance to find the coder who can help.
----------------

- 2006.09.03
- www.mql5.com
You need a more complicated wave equation to describe (and actually predict) the market than just a sine wave. I'm trying to figure out alglib polynomial interpolation, it should provide some results in this direction.
I wrote something that multiplicates sine waves with fading amplitude and it did draw something like an Elliot wave, but it's (very) far from ready.
Kypa, well spot on the point that sine wave is way too simple to describe the market. If market was that simple than our trading would have been too easy.
Indeed, it might be necessary to model something like more complex system of cycles made up from multiple of periods and amplitudes.
However, instead of trying model those complex system from the cycle point of view, it might be more straight forward to view the market from the fractal wave point of view.
It is because Fractal Wave is a sort of system representing the infinite number of cycles presents in the financial market data. It is the core assumption of the Fractal wave.
This price pattern table will presents the complexity of price evoluation from left to right.
It get more complicated in the order of Trend, Seasonality, Cycle and Fractal Waves from column 1 to column 5.
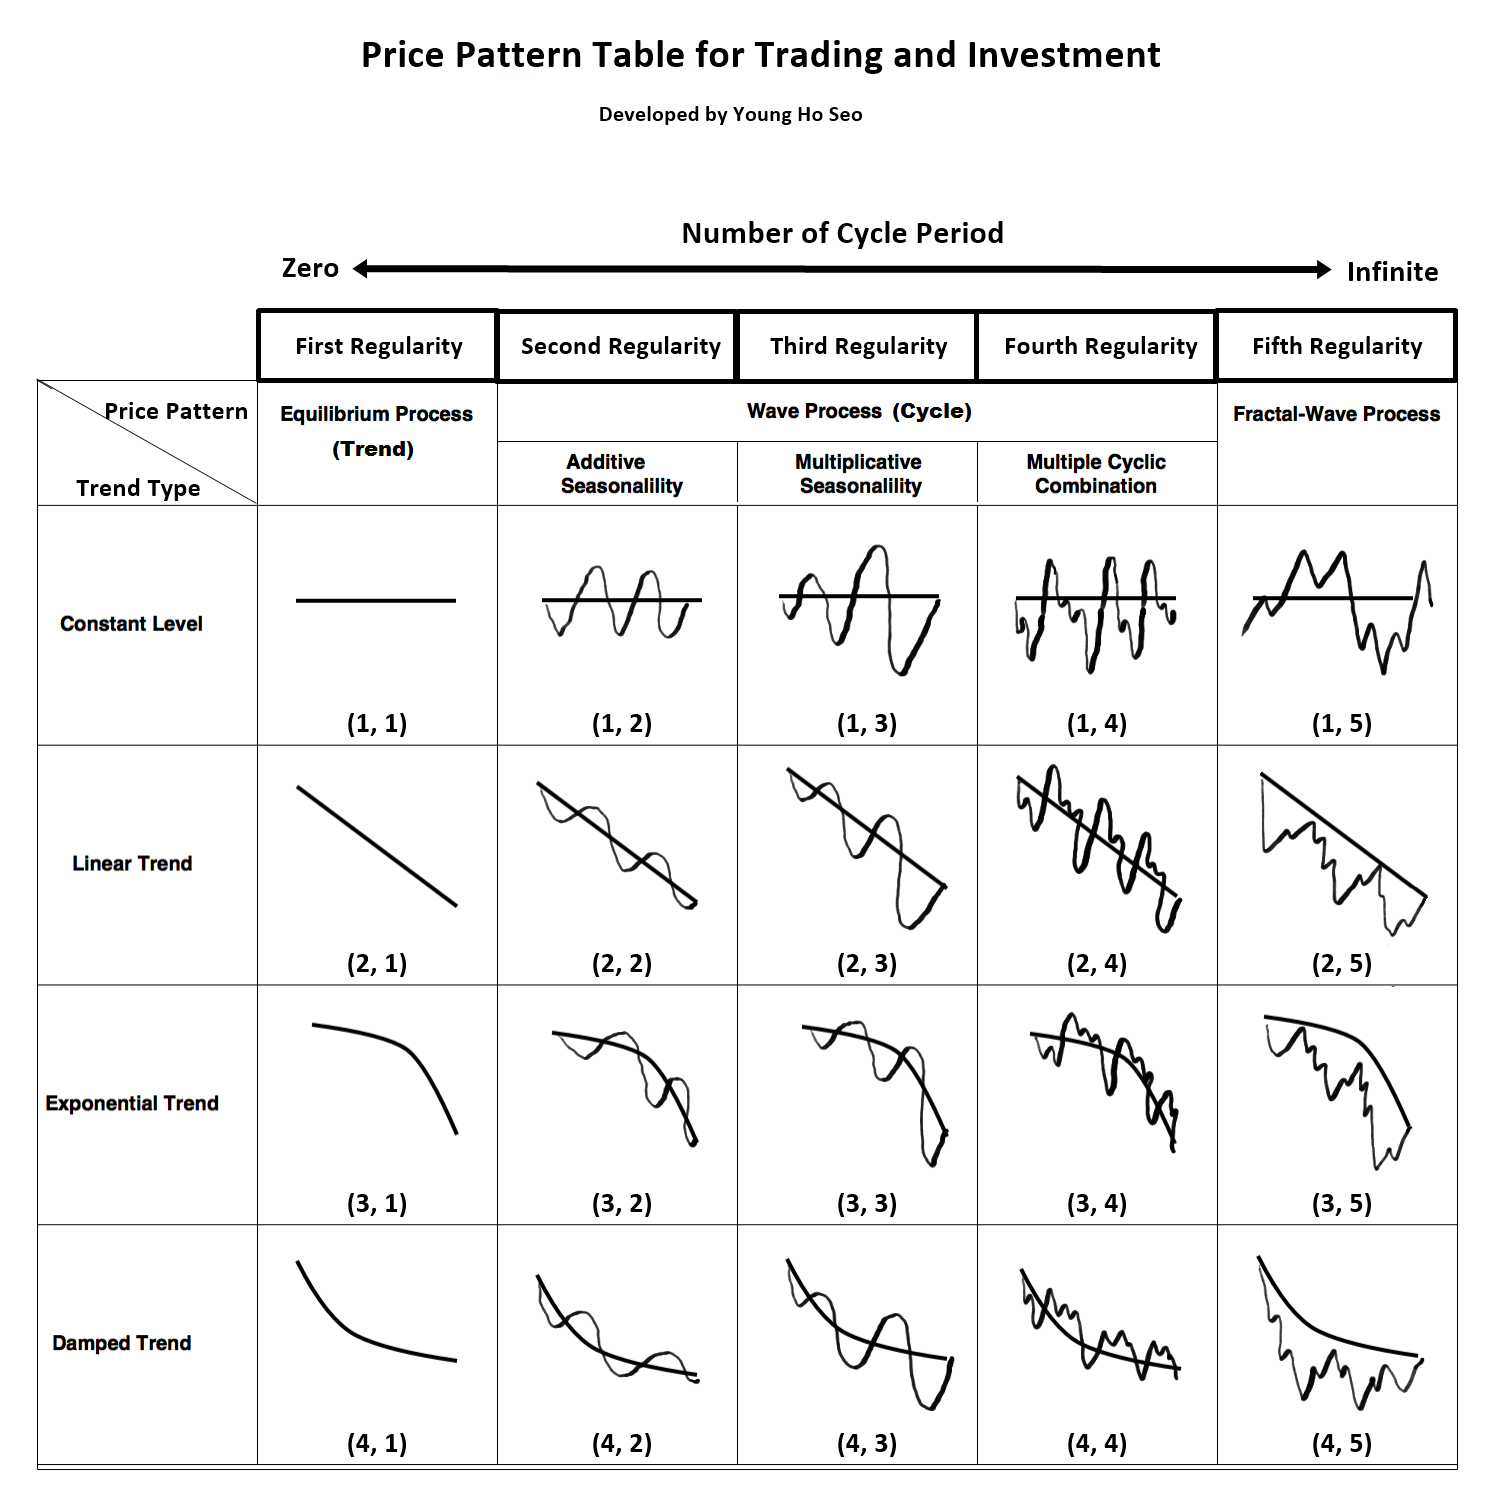
Then, the meaning of complexity of price evolution is closely related to the the number of cycle periods appears in each price pattern table in above five columns.
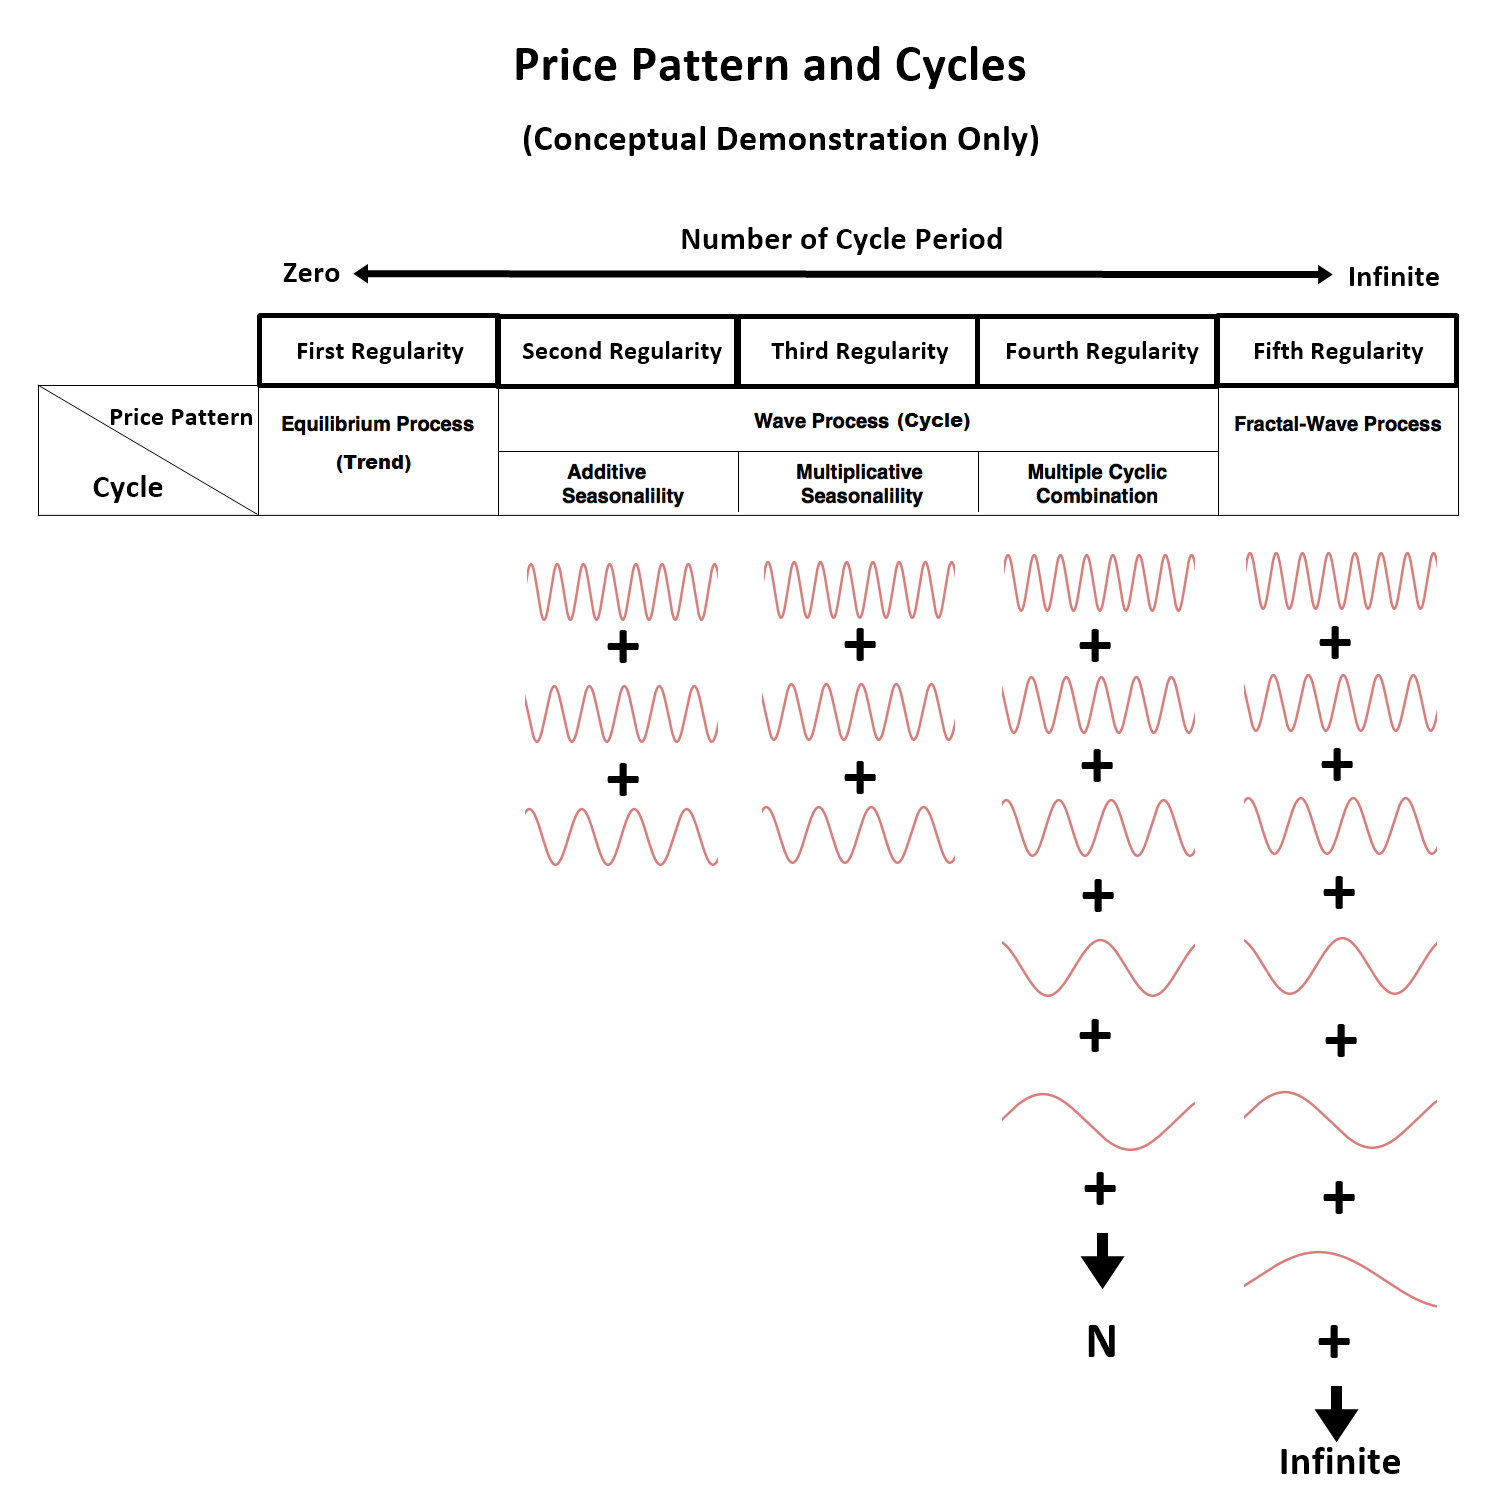
There is no cycle in the trend (column 1). There are few cycles in seasonailty (Column 2 and Column 3). The system can have more complex pattern of having multiple of cycles (Column 4) but still with finite number of cycles.
Finanlly, Fractal Wave (Column 5) gets it to the infinite becasue it assume that the similar geometry is keep repeating in different scales infinitley.
So what is the methods of trading these complex system like Fractal Wave ?
It is about using the price pattern (or chart pattern) derived from Fractal Wave itself for your trading.
Just to clarify, here are some examples of price patterns that are direclty or indirectly derived from Fractal Waves. Some price patterns have more definite structure whereas some price patterns have loose pattern structure only.
- Geometric Support and Resistance
- Supply Demand Zone
- Fibonacci Retracement and Fibonacci Expansion
- Harmonic Pattern
- Elliott Wave Pattern
- X3 Price Pattern
- Peak Trough Analysis
- Falling Wedge and Rising Wedge Pattern
- Double Top and Double Bottom
- Triple Top and Triple Bottom
- Renko Charting
- ZigZag indicator
- Point and Figure Chart
- and so on
In summary, it would be more straight forward trying to model this complex system of cycles using Fractal Wave point of view.
If you are still trying to approch this from cyclest point of view, then you have to assume that the number of cycles are finite by identifying the multiple of periods and amplitudes deterministically for each cycle.
This is damn hard, mathematically for the finanicial market data (It is fine for other simple data type though).
This is really a friendly advice.
I only do this because I wish all the price action and pattern trader help each other to enlighten more people for their success.
For Michalangelo , you have made a really imporant question to the trading community. I hope this post will save your time for you to achieve whatever you want to achieve.
Kind regards
- Free trading apps
- Over 8,000 signals for copying
- Economic news for exploring financial markets
You agree to website policy and terms of use
Hello,
I am looking for sine wave generator indicator where I can control period, amplitude and offset and it can display 3 sine waves.
I post a image so you can see what I mean. I cant find it anywhere.