High Profit Candlestick Patterns : Stephen Bigalow
Don’t play the market, Beat the Market! Stephen W. Bigalow’s first book "Profitable Candlestick Trading" taught the novice investor how to quickly identify the best trading opportunities. Now his new book, "High Profit Candlestick Patterns" takes his teaching to the next level. Combining the proven results ofJapanese Candlestick chartingwith effective Westerntechnical analysis, produces even higher profit wealth-building stock selection techniques. Learn the key toprofitable stockselection with this safer approach to investing and avoid expensive trading mistakes. Quickly learn the simplest, yet most intelligent, approach to stock selection.Candlesticksignals visually produce compelling results.Japanese candlestick charting techniques, integrated with statistically proven Western technical analysis, produces an even more powerful investment platform. The ability to recognize trading patterns in their very early stages empowers an investor with high profit trading strategies.
For thetechnical investor, the combined analysis provides potent trading programs. Thefundamental investorgains tremendous insights into the timing of positions. The introduction of cutting-edge computer generated technical analysis, with the world's most proven trading technique, becomes a powerful tool for understanding the movements of the markets. Discover simple techniques that put the probabilities highly in your favor.
Japanese candlestick signalsprovide an immense amount of information. They graphically depict what is occurring in investor sentiment. This alone provides a huge advantage for the investor. Having the ability to identify reversals in price trends, utilizing statistically proven and utilized signals, allows an investor to develop high profit trading strategies. The psychological elements not only reveal trend reversals, but they provide the insights for understanding why that reversal is occurring. This becomes a very powerful investment tool.
The graphic illustrations in this book are simple common sense revelations. Utilizing candlestick signals in conjunction with Western technical patterns produces two strong investment elements. First, it allows for the recognition of the optimal times for entering a trade. Second, the candlestick signals revealed immediately when the trend pattern is not performing correctly, allowing for quick exits.
You will receive a whole new perspective for profitably investing in the markets. You do not have to learn formulas nor develop investing talents. The combination of candlestick signals with easy-to-identify trading patterns will vastly expand your investment confidence. The self-mastery of profitable investing is greatly simplified with quick visual evaluations.
----------------
Candlestick charting Explained : Gregory L. Morris
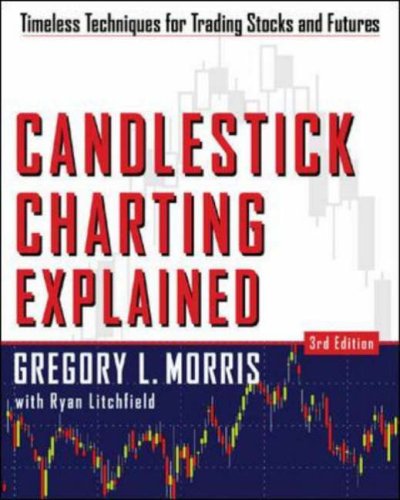
Empower your trading with Japanese candlestick charting
Japanese candlestick charts dramatically improve your understanding of short-term (less than a week) market sentiment, making you a much more informed and focused trader of stocks, futures, and indices. The bestselling Candlestick Charting Explained focuses on the patterns themselves and highlights the key facts you need to know to apply each pattern to your trading. For each of 89 distinctive candle patterns, its standardized format provides you with:
- Commentary--Description of pattern and significance of its name, insights into unique features, and other concise explanation
- Rules of Recognition--Simple rules for quick, accurate identification along with precise, day-by-day descriptions of pattern development
- Scenarios and Psychology Behind the Pattern--Trading scenarios that could have led to the pattern's development, with general discussion of the psychology of each
- day's action
- Pattern Flexibility--Situations that change the pattern's effectiveness with explanations of allowable deviations from the classic pattern
- Pattern Breakdown--Instructions for reducing the pattern to a single candle line and whether or not outside confirmation is suggested or unnecessary
- Related Patterns--Patterns that have similar formations, could be considered variations, or are a part of this pattern
- Example--A graphic example of the pattern to both aid in recognition and eliminate costly confusion in pattern identification
Additional information and insights present different interpretations of candlesticks based on intraday instead of end-of-day events and action, improving signal reliability. The author's unique candle pattern filtering concept, instrumental in answering the "how" question, is updated to utilize today's larger universe of stock data. An all-new chapter provides practical application and perspective traders need to view candles in the context of today's computer-driven marketplace.
For millions of traders, candlesticks have become a key tool in creating and verifying trading signals. Candlestick Charting Explained is the only book you need to start integrating their proven versatility and effectiveness into your technical trading program.
In 2011 the work of J. M. Hurst, considered by many as the father of modern cyclic analysis, enjoyed sudden and renewed interest by the trading community. This translated into several works approaching Hurst's methods from three different angles.
Just as stated by the author, it will help readers get a better grasp and understanding of Hurst's work, at a fraction of the the cost of his original private course. It will even provide buyers with the relevant code for Tradestation and Updata. This way, if you're tech savvy and already own one of these charting packages, or don't mind the additional investment needed to use them, you will be able to experiment further with the concepts covered in the book. Since it contains the code for all the different cycles, channels and other indicators, the author spares the reader the math details of Hurst's work, which may be for the best, since this has always been one of the stumbling blocks in applying Hurst's methods.
The self-proclaimed goal of the author is to lead the reader to a stage where he can perform his own cyclic analysis. The bottom line is that how well you master Hurst's methods after reading this book, as with so many other things in life and trading, will depend solely on how much work you're willing to put into experimenting with the concepts.
The book ends with a concise summary of the different theories explaining the causes of cycles, which should stimulate even further research into this fascinating subject.
Mr Grafton mentions the Sentient Trader software, by David Hickson, which covers similar ground. The author of that software has, understandably, undertaken a different approach: there is no code sharing, but instead a sleek black box, which generates trading signals based on Hurst's original work.
There is also the OddsTrader app, by CIT Dates, which is currently the only mobile app that allows users to chart Hurst channels and to use them as the basis for several different trading strategies. It even includes a built-in risk management and position sizing tool.
In summary, if you're interested in cycles and cyclic analysis, there has hardly been a better time for delving into and exploring the subject.
The Gartley Trading Method: New Techniques To Profit from the Market's Most Powerful Formation
Gartley patterns are based on the work of H.M. Gartley, a prominent
technical analyst best known for a particular retracement pattern that
bears his name. In recent years, Gartley patterns--which reflect the
underlying psychology of fear and greed in the markets--have received
renewed interest.
Written by Ross Beck--the recognized authority on
the subject of the Gartley pattern--this definitive guide skillfully
explains how to utilize the proven methods of H.M. Gartley to capture
consistent profits in the financial markets. Page by page, you'll become
familiar with Gartley's original work and its evolution, how his
patterns can be adapted to today's fast-moving markets, and what it
takes to make them work for you. The Gartley Trading Method examines how
to Identify and profit from the most powerful formation in the
financial markets. Learn about the similarities, differences, and the
superiority of the Gartley pattern compared to classical chart patterns,
including Elliott Wave! Gartley's pattern is based on a unique market
position where most traders refuse to participate due to fear. Designed
for traders of all levels, this book reveals how you can overcome this
fear, and profit from the most consistent and reliable pattern in the
financial markets.
Currency Strategy: The Practitioner's Guide to Currency Investing, Hedging and Forecasting
Description
Given there such huge focus on China at the moment, the timing of this new edition is particularly important. The new edition will feature a thorough update on the key developments in the past 3 years, new chapters on emerging markets, an in-depth review of the markets of China and India and their currencies and much more.
Table of Contents
Acknowledgements.
About the Author.
Introduction.
PART ONE: THEORY AND PRACTICE.
1 Fundamental Analysis: The Strengths and Weaknesses of Traditional Exchange Rate Models.
1.1 Purchasing Power Parity.
1.2 The Monetary Approach.
1.3 The Interest Rate Approach.
1.4 The Balance of Payments Approach.
1.5 The Portfolio Balance Approach.
1.6 Summary.
2 Currency Economics: A More Focused Framework.
2.1 Currencies are Different.
2.2 Currency Economics.
2.3 Summary.
3 Flow: Tracking the Animal Spirits.
3.1 Some Examples of Flow Models.
3.2 Speculative and Non-Speculative Flows.
3.3 Summary.
4 Technical Analysis: The Art of Charting.
4.1 Origins and Basic Concepts.
4.2 The Challenge of Technical Analysis.
4.3 The Art of Charting.
4.4 Schools of (Technical) Thought.
4.5 Technical Analysis and Currency Market Practitioners.
PART TWO: REGIMES AND CRISES.
5 Exchange Rate Regimes: Fixed or Floating?
5.1 An Emerging World.
5.2 A Brief History of Emerging Market Exchange Rates.
5.3 Fixed and Pegged Exchange Rate Regimes.
5.4 Exchange Rate Regime Sustainability – A Bi-Polar World?
5.5 The Realworld Relevance of the Exchange Rate Regime.
5.6 Summary.
6 Model Analysis: Can Currency Crises be Predicted?
6.1 A Model for Pegged Exchange Rates.
6.2 A Model for Freely Floating Exchange Rates.
6.3 Summary.
PART THREE: THE REAL WORLD OF THE CURRENCY MARKET PRACTITIONER.
7 Managing Currency Risk I – The Corporation: Advanced Approaches to Corporate Treasury FX Strategy.
7.1 Currency Risk.
7.2 Types of Currency Risk.
7.3 Managing Currency Risk.
7.4 Measuring Currency Risk – VaR and Beyond.
7.5 Core Principles for Managing Currency Risk.
7.6 Hedging – Management Reluctance and Internal Methods.
7.7 Key Operational Controls for Treasury.
7.8 Tools for Managing Currency Risk.
7.9 Hedging Strategies.
7.10 Optimization.
7.11 Hedging Emerging Market Currency Risk.
7.12 Benchmarks for Currency Risk Management.
7.13 Budget Rates.
7.14 The Corporation and Predicting Exchange Rates.
7.15 Summary.
8 Managing Currency Risk II – The Investor: Currency Exposure within the Investment Decision.
8.1 Investors and Currency Risk.
8.2 Currency Markets are Different.
8.3 To Hedge or not to Hedge – That is the Question!
8.4 Absolute Returns – Risk Reduction.
8.5 Selecting the Currency Hedging Benchmark.
8.6 Relative Returns – Adding Alpha.
8.7 Examples of Active Currency Management Strategies.
8.8 Emerging Markets and Currency Hedging.
8.9 Summary.
9 Managing Currency Risk III – The Speculator: Myths, Realities and How to be a Better Currency Speculator.
9.1 The Speculator – From Benign to Malign.
9.2 Size Matters.
9.3 Myths and Realities.
9.4 The Speculators – Who they are.
9.5 The Speculators – Why They Do It.
9.6 The Speculators – What They Do.
9.7 Currency Speculation – A Guide.
9.8 Summary.
10 Applying the Framework.
10.1 Currency Economics.
10.2 Flow Analysis.
10.3 Technical Analysis.
10.4 Long-Term Valuation.
10.5 The Signal Grid.
10.6 Risk Appetite Indicators.
10.7 Exchange Rate Regimes.
10.8 Currency Crises and Models.
10.9 Managing Currency Risk I – The Corporation.
10.10 Managing Currency Risk II – The Investor.
10.11 Managing Currency Risk III – The Speculator.
10.12 Currency Strategy for Currency Market Practitioners.
10.13 Summary.
11 EmergingWorld: New Growth Markets for Global FX.
11.1 The Growth of Emerging Markets as an Asset Class.
11.2 Increasing Importance of EM Currencies.
11.3 Explosive Growth in Asian Currencies.
11.4 Asian NDF Markets: Growth and Liberalization.
11.5 Emerging European Currencies.
11.6 Latin American Currencies.
11.7 Summary.
Conclusion.
Index.
Forecasting, Structural Time Series Models and the Kalman Filter
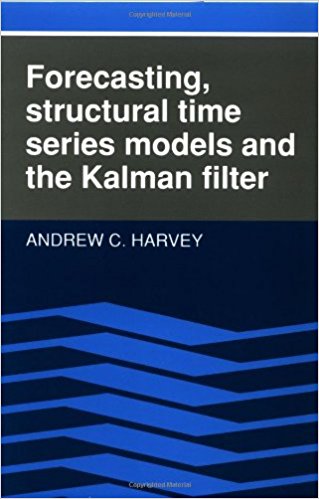
This book provides a synthesis of concepts and materials that ordinarily appear separately in time series and econometrics literature, presenting a comprehensive review of both theoretical and applied concepts. Perhaps the most novel feature of the book is its use of Kalman filtering together with econometric and time series methodology. From a technical point of view, state space models and the Kalman filter play a key role in the statistical treatment of structural time series models. This technique was originally developed in control engineering but is becoming increasingly important in economics and operations research. The book is primarily concerned with modeling economic and social time series and with addressing the special problems that the treatment of such series pose.
Forum on trading, automated trading systems and testing trading strategies
Something Interesting to Read March 2014
Sergey Golubev, 2014.03.26 16:42

Written by leading market risk academic, Professor Carol Alexander,
Pricing, Hedging and Trading Financial Instruments forms part three of
the Market Risk Analysis four volume set. This book is an in-depth,
practical and accessible guide to the models that are used for pricing
and the strategies that are used for hedging financial instruments, and
to the markets in which they trade. It provides a comprehensive,
rigorous and accessible introduction to bonds, swaps, futures and
forwards and options, including variance swaps, volatility indices and
their futures and options, to stochastic volatility models and to
modelling the implied and local volatility surfaces.
All together, the Market Risk Analysis four volume set illustrates
virtually every concept or formula with a practical, numerical example
or a longer, empirical case study. Across all four volumes there are
approximately 300 numerical and empirical examples, 400 graphs and
figures and 30 case studies many of which are contained in interactive
Excel spreadsheets available from the the accompanying CD-ROM .
Empirical examples and case studies specific to this volume include:
- Duration-Convexity approximation to bond portfolios, and portfolio immunization;
- Pricing floaters and vanilla, basis and variance swaps;
- Coupon stripping and yield curve fitting;
- Proxy hedging, and hedging international securities and energy futures portfolios;
- Pricing models for European exotics, including barriers, Asians, look-backs, choosers, capped, contingent, power, quanto, compo, exchange, ‘best-of’ and spread options;
- Libor model calibration;
- Dynamic models for implied volatility based on principal component analysis;
- Calibration of stochastic volatility models (Matlab code);
- Simulations from stochastic volatility and jump models;
- Duration, PV01 and volatility invariant cash flow mappings;
- Delta-gamma-theta-vega mappings for options portfolios;
- Volatility beta mapping to volatility indices.
Adaptive Markets: Financial Evolution at the Speed of Thought

A new, evolutionary explanation of markets and investor behavior
Half of all Americans have money in the stock market, yet economists can't agree on whether investors and markets are rational and efficient, as modern financial theory assumes, or irrational and inefficient, as behavioral economists believe--and as financial bubbles, crashes, and crises suggest. This is one of the biggest debates in economics and the value or futility of investment management and financial regulation hang on the outcome. In this groundbreaking book, Andrew Lo cuts through this debate with a new framework, the Adaptive Markets Hypothesis, in which rationality and irrationality coexist.
Drawing on psychology, evolutionary biology, neuroscience, artificial intelligence, and other fields, Adaptive Markets shows that the theory of market efficiency isn't wrong but merely incomplete. When markets are unstable, investors react instinctively, creating inefficiencies for others to exploit. Lo's new paradigm explains how financial evolution shapes behavior and markets at the speed of thought--a fact revealed by swings between stability and crisis, profit and loss, and innovation and regulation.
A fascinating intellectual journey filled with compelling stories, Adaptive Markets starts with the origins of market efficiency and its failures, turns to the foundations of investor behavior, and concludes with practical implications--including how hedge funds have become the Galápagos Islands of finance, what really happened in the 2008 meltdown, and how we might avoid future crises.
An ambitious new answer to fundamental questions in economics, Adaptive Markets is essential reading for anyone who wants to know how markets really work.
Forum on trading, automated trading systems and testing trading strategies
Something Interesting to Read March 2017
Sergey Golubev, 2017.02.27 10:50
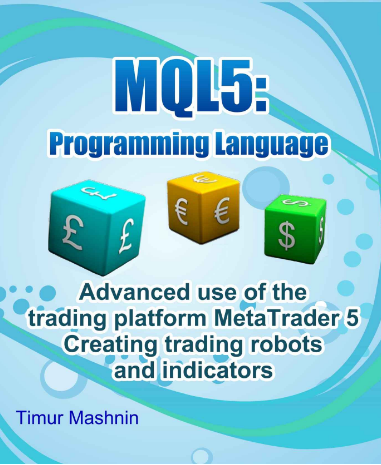
MQL5 programming language: Advanced use of the trading platform MetaTrader 5: Creating trading robots and indicators
by Timur Mashnin
Development of indicators and advisors using the MQL5 programming language for the MetaTrader 5.
- Free trading apps
- Over 8,000 signals for copying
- Economic news for exploring financial markets
You agree to website policy and terms of use
This is the thread about books related for stocks, forex, financial market and economics. Please make a post about books with possible cover image, short description and official link to buy (amazon for example).
Posts without books' presentation, without official link to buy and with refferal links will be deleted.Posts with links to unofficial resellers will be deleted