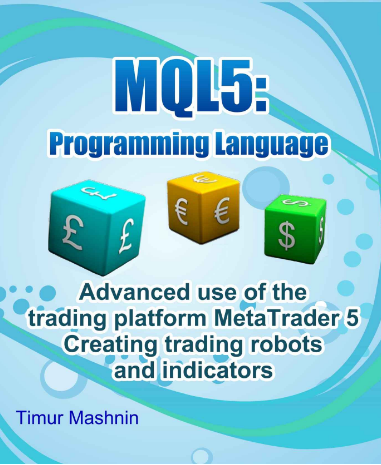
MQL5 programming language: Advanced use of the trading platform MetaTrader 5: Creating trading robots and indicators
by Timur Mashnin
Development of indicators and advisors using the MQL5 programming language for the MetaTrader 5.


Momentum, Direction, Divergence : William Blau

In this latest volume, technical expert Bill Blau shows you how momentum, direction, and divergence form the basis of most technical indicators and how they can work for you to provide a considerable competitive advantage. Clearly, concisely, and with a minimum of complex mathematics, Blau shows you how to understand and apply them. Integrating the latest financial insights with more than 75 easy-to-follow graphics, Blau describes the uses and limitations of many of today's most notable technical indicators. He then demonstrates a variety of ways in which the principles of momentum, direction, and divergence can be used to create a versatile new set of technical indicators or to improve the effectiveness of the most widely used traditional indicators.
Focusing on the groundbreaking double smoothing concept, which he introduces for the first time in this book, William Blau:
- Develops reliable new momentum indicators based on double smoothing techniques
- Shows how these indicators improve the effectiveness of most popular oscillators, including the RSI, MACD, and stochastic indicators, by solving a host of timing problems
- Combines the standard Welles Wilder techniques with his original True Strength Index to improve the effectiveness of most directional movement indicators
- Introduces new ways of identifying divergence that make implementation simpler than ever
- And much more
==========
William Blau's Indicators and Trading Systems in MQL5. Part 1: IndicatorsThe first part of the article "Indicators and Trade Systems in MQL5 by William Blau. Part 1: Indicators " is a description of indicators and oscillators, described by William Blau in the book"Momentum, Direction, and Divergence".
The article describes the following groups of indicators:
- Indicators, based on the Momentum:
- Momentum(Blau_Mtm.mq5)
- The True Strength Index(Blau_TSI.mq5)
- Ergodic Oscillator(Blau_Ergodic.mq5)
- Indicators, based on Stochastic:
- Stochastic(Blau_TStoch.mq5)
- Stochastics Index(Blau_TStochI.mq5)
- Stochastic Oscillator(Blau_TS_Stochastic.mq5)
- Indicators, based on the Stochastic Momentum:
- Stochastic Momentum(Blau_SM.mq5)
- Stochastic Momentum Indicator(Blau_SMI.mq5)
- Stochastic Momentum Oscillator(Blau_SM_Stochastic.mq5)
- Indicators, based on a Mean Deviation from the market trends:
- Mean Deviation Index Indicator(Blau_MDI.mq5)
- Ergodic MDI-oscillator(Blau_Ergodic_MDI.mq5)
- Indicators based on the Moving Average Convergence/Divergence:
- MACD indicator(Blau_MACD.mq5)
- Ergodic MACD-oscillator(Blau_Ergodic_MACD.mq5)
- Indicators, based on the Candlestick Momentum:
- Candlestick Momentum(Blau_CMtm.mq5)
- The Candlestick Momentum Index(Blau_CMI.mq5)
- Candlestick Index Indicator(Blau_CSI.mq5)
- Ergodic CMI-Oscillator(Blau_Ergodic_CMI.mq5)
- Ergodic CSI-Oscillator(Blau_Ergodic_CSI.mq5)
- Indicators, based on a Composite High-Low Momentum:
- Indicator of the Virtual Close(Blau_HLM.mq5)
- Directional Trend Index Indicator(Blau_DTI.mq5)
- Ergodic DTI Oscillator(Blau_Ergodic_DTI.mq5)
Forum on trading, automated trading systems and testing trading strategies
Something Interesting to Read February 2014
Sergey Golubev, 2014.02.25 16:46
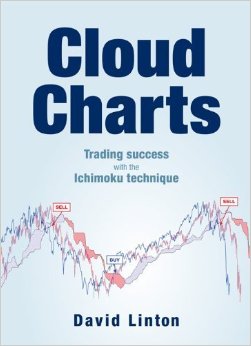
Cloud Charts : Trading Successful with the Ichimoku Technique by David Linton

David Linton, the author of Cloud Charts, had his interest in Ichimoku
charts `sparked' during a presentation by Rick Bensignor at the 2004
IFTA conference in Madrid. David had heard of the method prior to the
conference but credits Rick with presenting it in an `understable' way.
David set out on a quest for Ichimoku knowledge. He researched the
internet, questioned Japanese delegates at subsequent IFTA conferences,
sought out Rick Bensignor at conferences and meetings and even flew to
Tokyo. The fruit of that quest is the book, Cloud Charts.
The Ichimoku method is now fast becoming popular in Western trading
rooms and is available on almost all technical analysis software. David
must take some credit for turning what seemed to be an exotic and
complicated method into an easily understandable and robust trading and
analysis tool for non-Japanese speaking technical analysts.
So, what is Ichimoku? The full name of the method is Ichimoku Kinko Hyo
which means 'at one glance balance bar chart'. Ichimoku charts were
devised by Goichi Hosoda , a Tokyo journalist, who believed that once
the method was fully understood, one could comprehend the exact state of
a market at a glance. Most of the Ichimoku indicators represent
equilibrium in one time frame or another and price action is generally
analysed with regard to whether the market is in equilibrium, moving
away from it or reverting back to it. By their nature, the various
indicators also offer dynamic areas of support or resistance.
Cloud Charts is divided into three parts. The first is for the novice
technical analyst and is designed to give them an understanding of many
basic technical analysis concepts involved with not only Ichimoku
analysis but also traditional techniques. More experienced technical
analysts may wish to skip this part.
Part two introduces the reader to the basic indicators used in Ichimoku
charts (David calls them cloud charts). This section deals with the
derivation and interpretation of:
1. The Turning Line (also called the Conversion Line)
2. The Standard Line ( also called the Base Line)
3. The Cloud Span A ( also called the Cloud Span 1)
4. The Cloud Span B (also called the Cloud Span 2)
5. The Lagging Line ( also called the Lagging Span)
Part two offers a guide to applying Ichimoku charts in a multiple time
frame sense, as well as the often overlooked Wave Principle, Price
Targets and Time Span Principle. However, the application of Ichimoku
charts to price and time projection is very subjective and for that
reason alone the projections are quite often not utilised by even
experienced analysts.
Looking at an Ichimoku chart, it's no surprise that analysts are
sometimes turned off by the busyness of the chart. It can look like
chaos to the uninitiated but the key to getting past that is
understanding the formula to each indicator, how they combine with each
other, how they represent a consensus of price action in different time
frames and colour-coding. In part two David explains construction and
interpretation of the charts in a manner that is easy for any newcomer
to technical analysis let alone a professional on a trading desk.
Part three, is where we are encouraged to think outside of the box.
Here, the use of Ichimoku charts are combined with other technical
analysis techniques, alternative time inputs into the indicators are
suggested and the application to market breadth analysis is considered.
There is also a chapter on back testing for the quantitative traders to
consume.
Overall, this book, in an easily read manner, brings together the body
of knowledge of a Japanese technical analysis method which was once
thought of as exotic and over-complicated. It has potential to become
the definitive English language text on the Ichimoku Kinko Hyo technical
analysis method.
- Free trading apps
- Over 8,000 signals for copying
- Economic news for exploring financial markets
You agree to website policy and terms of use
This is the thread about books related for stocks, forex, financial market and economics. Please make a post about books with possible cover image, short description and official link to buy (amazon for example).
Posts without books' presentation, without official link to buy and with refferal links will be deleted.Posts with links to unofficial resellers will be deleted