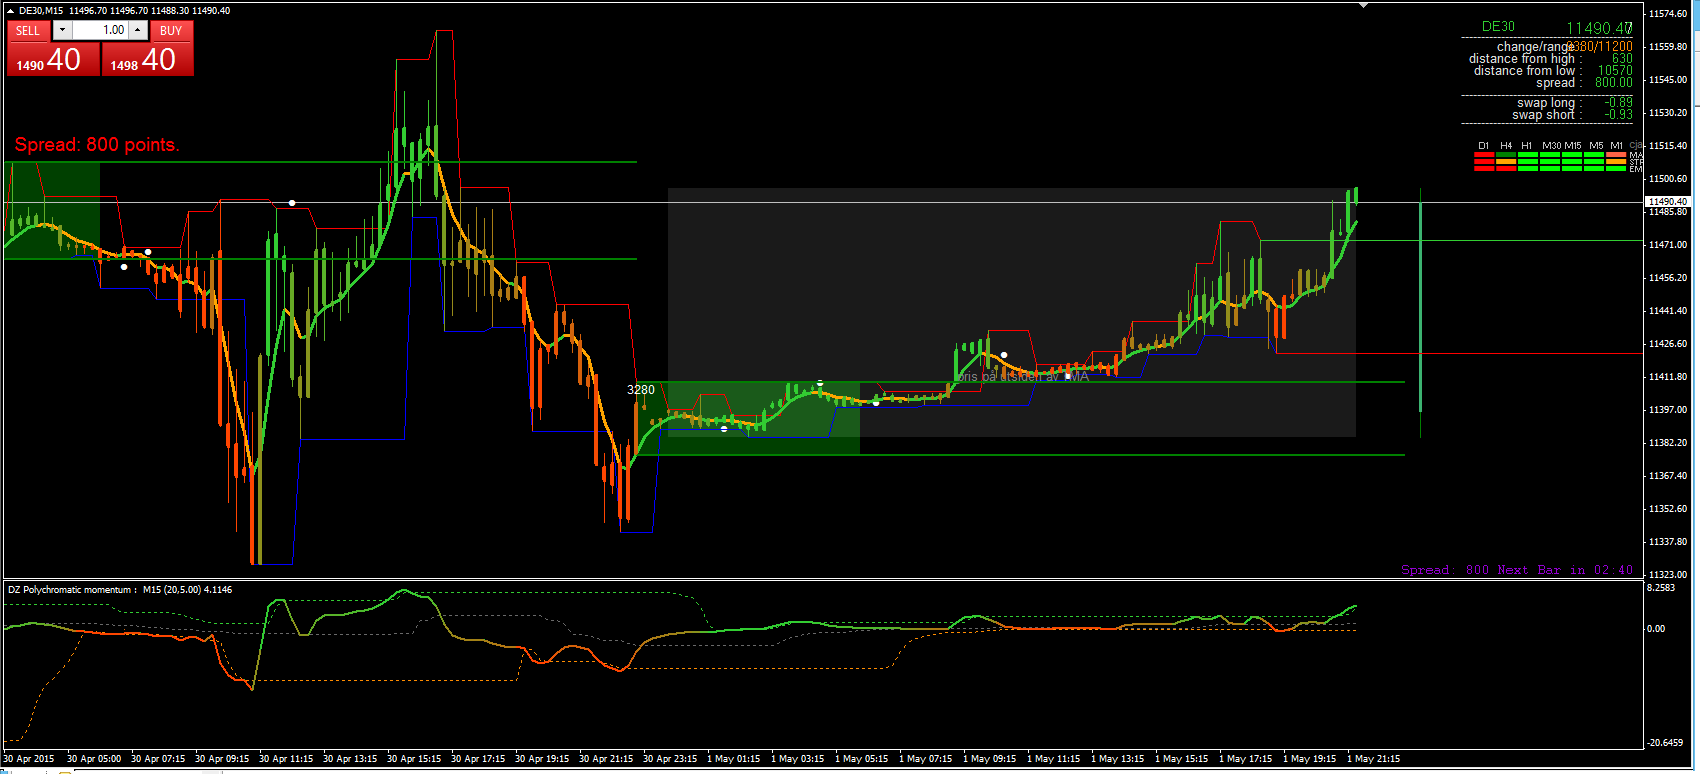
Dynamic indicators, how to read them? (DZ Polychromatic momentum)
Hi.
I recently downloaded this indicator from the elite section and find it really interesting. So now I want to get a bit better understanding of this indicator.
It is pretty self explaining but it would be useful to know whats going on when the upper or lower dynamic zone are trending.
I.E the lower dynamic zone resistance are trending up, but the oscillator itself are trending down what is actually going on then?
Sometimes the zero line are very close to either of the upper or lower zone what does that mean.
How was this indicator intended to be used? Surely it came very handy in my trading even with so little knowledge of whats going on.
Any information on this particular indicator and dynamic zones in general would be highly appreciated
Thanks
 .
.NWFstudent
The general idea of dynamic zones is very, very simple in its idea : instead of adapting the indicator value, why not adapting the levels that are considered as significant for the indicator? That way, all of a sudden, without changing anything in the indicator at all, with same values as before it becomes adaptive. That is the reason why I told multiple times that "it seems that David Stendahl can not help him self" (the guy had some really, really good ideas, and I must admit that I like his ideas)
Also, it gives us one thing that is not obvious at the first glance. Imagine MACD. Nobody trades MACD using some levels (since MACD is an unbound indicator levels are meaningless). But with dynamic zones, all of a sudden it becomes irrelevant and MACD can be traded using levels too (which is impossible using any other method). Ie: dynamic zones can make almost any indicator using levels, which was impossible without the dynamic zones (with the same adaptive like result)
_________________
So imagine the zones as adaptive levels instead of zones, and start to use any dynamic zones indicator as any other adaptive indicator and it will become much simpler to see what those zones actually do
_________________
PS: the pdf from the first post here https://www.mql5.com/en/forum/general is free for download for anybody. If you did not download iit, do it. There is some good stuff in the document
NWFstudent
The general idea of dynamic zones is very, very simple in its idea : instead of adapting the indicator value, why not adapting the levels that are considered as significant for the indicator? That way, all of a sudden, without changing anything in the indicator at all, with same values as before it becomes adaptive. That is the reason why I told multiple times that "it seems that David Stendahl can not help him self" (the guy had some really, really good ideas, and I must admit that I like his ideas)
Also, it gives us one thing that is not obvious at the first glance. Imagine MACD. Nobody trades MACD using some levels (since MACD is an unbound indicator levels are meaningless). But with dynamic zones, all of a sudden it becomes irrelevant and MACD can be traded using levels too (which is impossible using any other method). Ie: dynamic zones can make almost any indicator using levels, which was impossible without the dynamic zones (with the same adaptive like result)
_________________
So imagine the zones as adaptive levels instead of zones, and start to use any dynamic zones indicator as any other adaptive indicator and it will become much simpler to see what those zones actually do
_________________
PS: the pdf from the first post here https://www.mql5.com/en/forum/general is free for download for anybody. If you did not download iit, do it. There is some good stuff in the document
Excellent explanation.
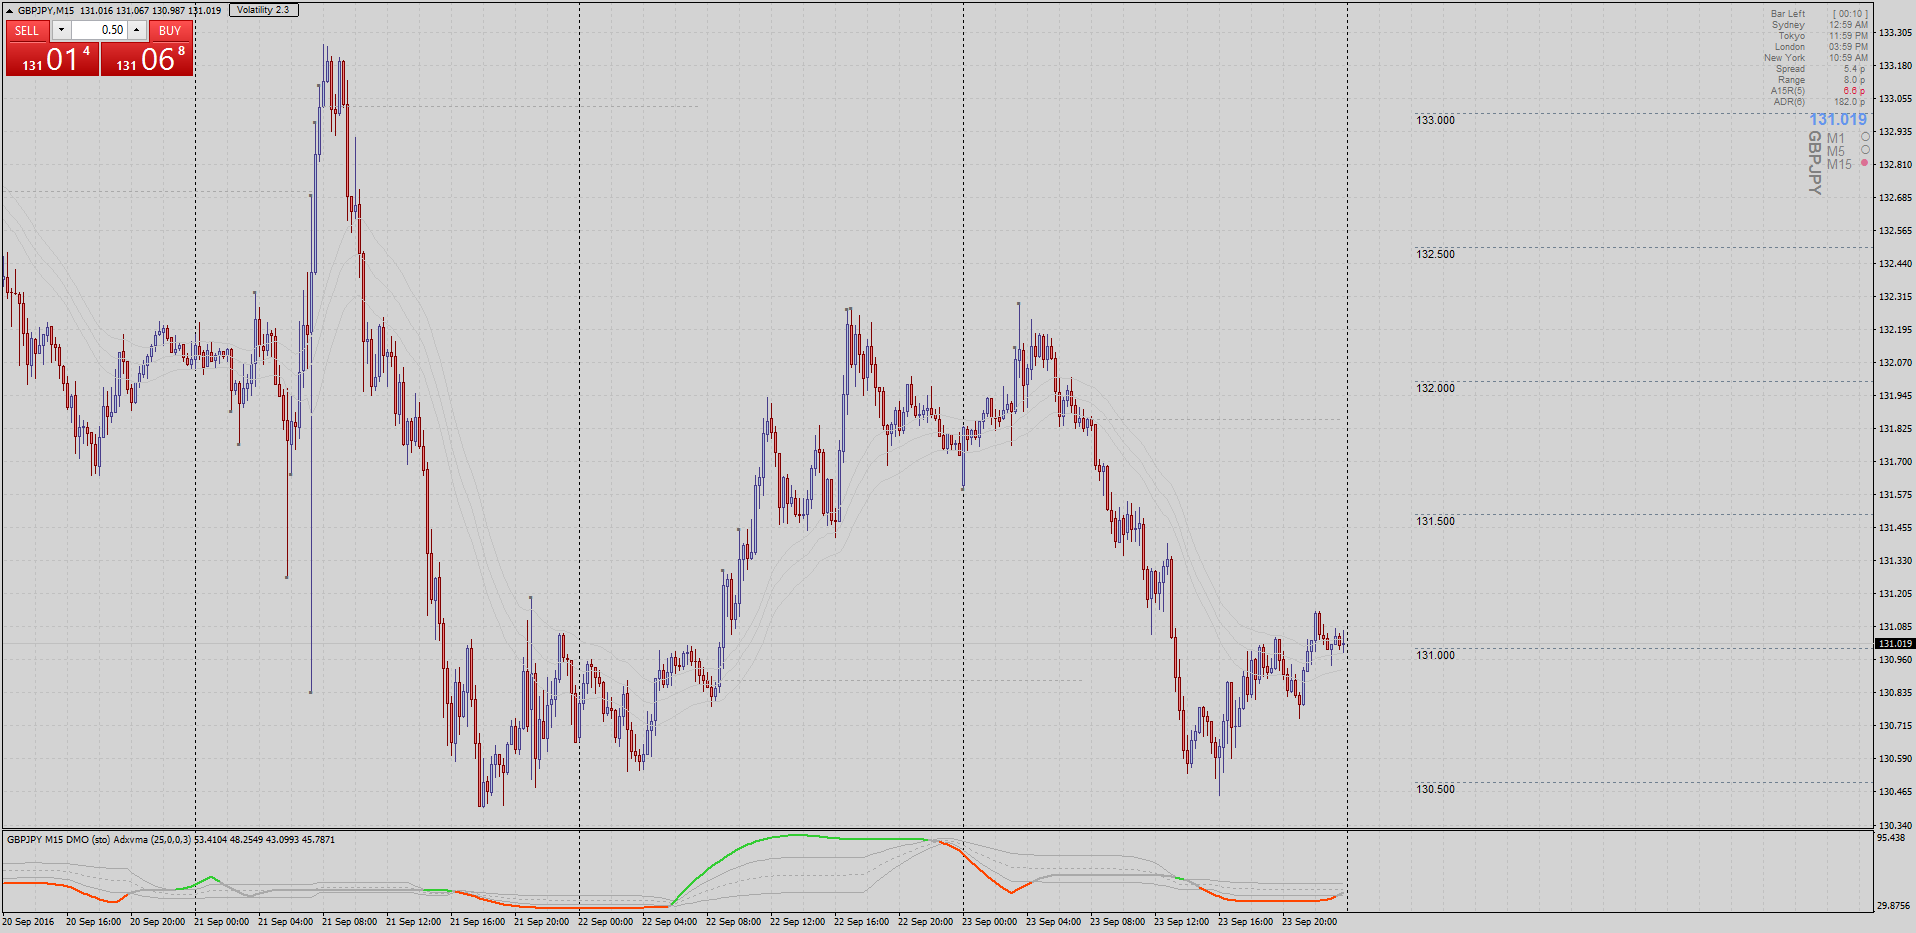
I'm trying to get my head around the Dynamic Momentum Oscillator Stochastics but I need some help please.
From what I see, when the coloured line is outside the "bands", this is where trend is heading, right? And the bands expand to represent volatility just like bollinger bands, is this correct?
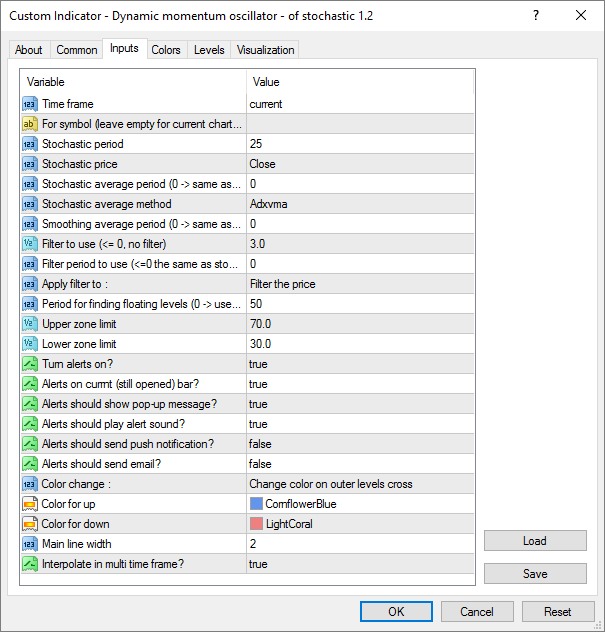
PS: My settings are set to this at the moment, is this the same settings you use Mladen (Filter to use is "3.0" and Stochastic Average Method is set to "Adxvma")?
Excellent explanation.
I'm trying to get my head around the Dynamic Momentum Oscillator Stochastics but I need some help please.
From what I see, when the coloured line is outside the "bands", this is where trend is heading, right? And the bands expand to represent volatility just like bollinger bands, is this correct?
PS: My settings are set to this at the moment, is this the same settings you use Mladen (Filter to use is "3.0" and Stochastic Average Method is set to "Adxvma")?
More or less, with that type of settings, yes, except that those levels are not like bollinger bands but should more be thinking about them as of levels (like levels 80 and 20 for stochastic, and so on)
Thank you mate.
Forum on trading, automated trading systems and testing trading strategies
Sergey Golubev, 2012.11.30 08:07
Dynamic zone indicators
Do not be confused with the name: The "dynamic zone" indicators floating on the net have almost nothing common at all with these indicators posted/coded by Mladen here based on Stocks & Commodities July 1996 issue.
The forum
- The key thread - this is big thread with many indicators uploaded such as the following:
- Dynamic zone RSI and Dynamic zone synthetic smoothed RSI indicators (with probability for buy zone and probability for sell zone parameter)
- Dynamic zone - pa IFT of RSI_smoothed_alerts_lines_arrows indicator
- Dynamic double zone smooth RSI slope divergence indicator (this is dynamic zone smoothed rsi ma slope divergence, there's 4 different rsi's to choose from, the linear regression channel has width and length and channel line types and colors as external parameters and the rsi ma is smoothed with jurik)
- Dynamic zone ADX, Dynamic zone Wilder's ADX and Dynamic zone all Wilder's DMI indicators
- Dynamic zone MACD (with probability for buy zone and probability for sell zone parameters)
- Dynamic zone ma rsi adaptive MACD indicator
- Dynamic zone cfb adaptive wprsmooth mtf alerts indicator
- Dynamic zone CCI - alerts & arrows2 indicator
- Dynamic zone DSS Bressert indicator (with the following parameters: probability for buy zone 1, probability for buy zone 2, probability for sell zone 1, probability for sell zone 2, period of smoothing EMA used and so on)
- Dynamic zone DSS Bressert - Odysseus indicator
- Bressert - mtf & ZigZag indicator and Dynamic zone DSS Bressert - mtf & alerts & ZigZag indicator
- Dynamic zone rsiv and Dynamic zone rsiv - smoothed indicators
- Dynamic zone pa adaptive Rsx nrp_alerts_lines_divergence
- dynamic double zone insync index smooth & arrows indicator
- and much more indicators (check key thread)
The articles
- Forecasting market movements using the Bayesian classification and indicators based on Singular Spectrum Analysis
- MQL5 Cookbook: Using Indicators to Set Trading Conditions in Expert Advisors
- Theoretical Basis of Building Cluster Indicators for FOREX
- Practical Application of Cluster Indicators in FOREX
CodeBase
- Aroon oscillator - dynamic zones (levels) - indicator for MetaTrader 5
- Dynamic Auto Resistance Support - indicator for MetaTrader 5
- Dynamic Zone RSI - indicator for MetaTrader 4
============
- Free trading apps
- Over 8,000 signals for copying
- Economic news for exploring financial markets
You agree to website policy and terms of use
Hi.
I recently downloaded this indicator from the elite section and find it really interesting. So now I want to get a bit better understanding of this indicator.
It is pretty self explaining but it would be useful to know whats going on when the upper or lower dynamic zone are trending.
I.E the lower dynamic zone resistance are trending up, but the oscillator itself are trending down what is actually going on then?
Sometimes the zero line are very close to either of the upper or lower zone what does that mean.
How was this indicator intended to be used? Surely it came very handy in my trading even with so little knowledge of whats going on.
Any information on this particular indicator and dynamic zones in general would be highly appreciated
Thanks