Join our fan page
- Views:
- 35352
- Rating:
- Published:
- 2014.05.23 11:27
- Updated:
- 2016.11.22 07:32
-
Need a robot or indicator based on this code? Order it on Freelance Go to Freelance
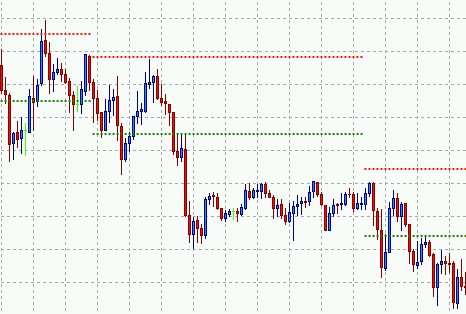
This technical indicator detects constant price zones and draws resistance and support lines.
It checks the market movement for any market and any time frame. If a bar is not abnormally large, the indicator checks back and searches for other bars within the same price zone.
If enough candles are found, it draws lines on this level. The lines will continue till the next zone is identified.
Input parameters:
- InpBacklook (5-xxxx) - Amount of candles to scan and detect other candles in the same range;
- InpAccurency (10.0 - 100.0) - Required candles in back look range to match requirements in percent.

 Advanced ADX
Advanced ADX indicator.
 Horizontal line for max/min prices of the last 2 years
Example code on how to draw an horizontal line for maximum and minimum prices of the last 2 years.
 Straddle Orders Around Current Price Level
A script to place straddle orders around current price level to catch price spikes around announcements.
 Fast FrAMA
Fast FrAMA, in contrast to the version from MQL5 suite, has more wide applied price constant choose and, what's the main difference, calculation speed is increased by a factor of 30 to 100.