You are missing trading opportunities:
- Free trading apps
- Over 8,000 signals for copying
- Economic news for exploring financial markets
Registration
Log in
You agree to website policy and terms of use
If you do not have an account, please register
i worked
i worked so hard this week, i was exhausted! as most of you know by now a am a swing trader.
in order to be swing trader, you must know when and where the larger swings are?
this is were and what i am waiting for to enter the market. i take my money and place my bets
where i believe the largest amount of potential is : there will be some refinement once the new week starts
but in general this is what i expect. i did not teach traders this yet because no one wanted to learn about price action.
so got cut off. i call this the x trend line move!!!!! it is very common!! and it is easily recognized. i will send some more shots
once i find some examples.
in the market at these places : most of which are dependent on a trend line crossing!
all that x out is:
all that x out is: it is channel shift with a test of the old channel! that's all it really is.
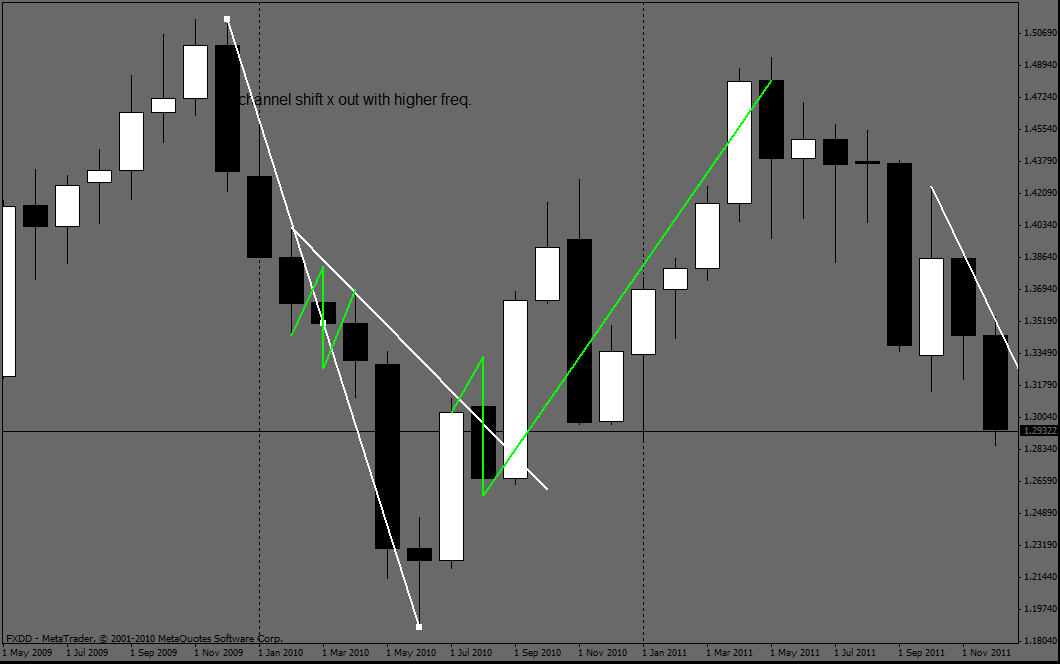
so the x out of a trend line is a channel shift! in development.
channel shift x out
channel shift x out higher freq. monthly.
any crossings of a trendline on current time frame is a developing channel in lower time frame.
right boe? or otherwise?
red bull i think you got it!
i think you got it but let me put this in simpler terms.
first of all let me talk about indicator systems. indicator systems can work.. if traders knew
what freq. to be on and the potential that swing will produce.
the problem with indicator systems is: on one pare you could have a down trend on one freq.
and a up trend on another. that means at times a small freq. can dictate swings against a trend.
and at a point where the larger freq. says that enough " small freq. you are going to join me.
either join me temperately for small potential. or you can join me for my potential on a weekly swing.
think of it as gears, you have small gears and large gears.
in trading you have two transmissions. the swing transmission( physical price), and the (time frame transmission).
in order for you to teach this new driver to drive the truck, you have to tell him what gear to be in.
so every time a upper time frame closes and a new one opens, you have to shift gears! to larger
gear! now the faster you are going down hill may mean you have to use the break, unless somewhere
inside the time frame we just completed you changed gears near the end of that time frame.
then there is no breaks required and the next time frame will be a smooth run.
now when you are teaching him, you say: in a down trend, we will come across small hills and large hills.
you can tell these hills are cumming in advance, with advertised closes on the larger time frames.
a advertised close on small time frames inside a containment of a larger time frame changing gears, are
small gears unless the swing transmission on physical price needs to be shifted.
check that.
lonley fx
i am not sure you know something i have not told you yet or your confused?
you see inner slope channels the channel is compressed compared to outer slope channels.
so if you want to see a new inner slope as a channel in definitive form you have to lower
your freq.
so you are correct if you see the market shift a channel and rejoin the trend with a new channel
that means you have to start from zero to ketch the ride.
i think that is what you were asking, i hope that answers your question.
if you know or suspect
if you know the market will turn around or suspect it will turn around at a price level.
to confirm that turn around you treat that swing as its own trend by lowering your
freq. lets take a look at that closely. for a few shots.
lower the freq. to get a channel shift and possessive test against the back side. refine your entry.
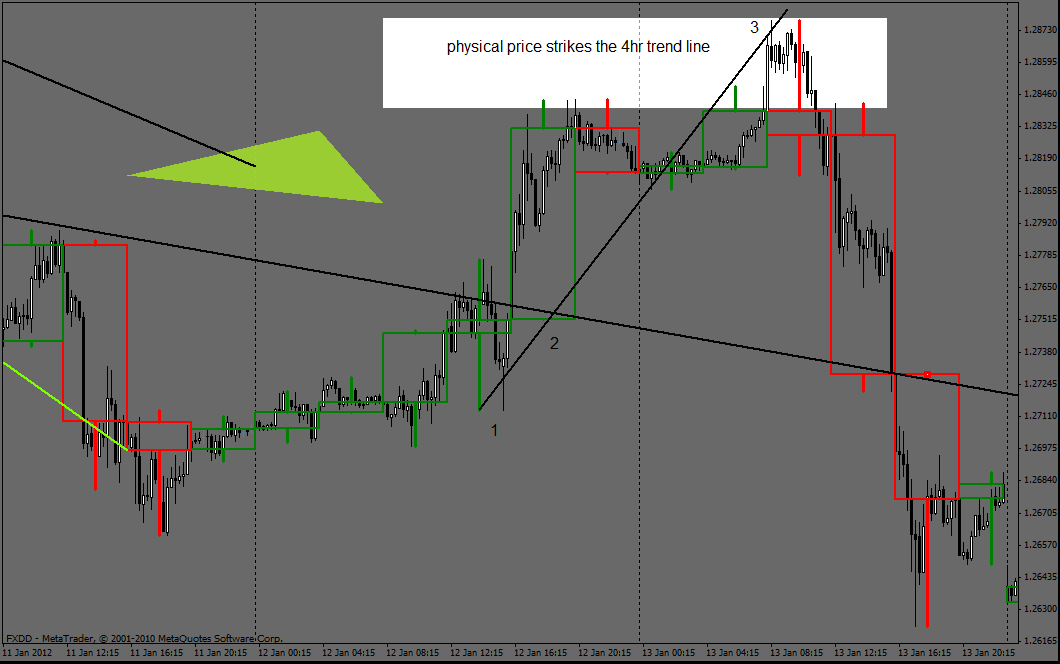
this is the 15 minute with the 4 hr over lays.
with out the over lays
with out the over lays, you will be lost or emotionally to late!
shot with out the over lays.
i am going to
i am going to make this all clear and easy onto a strategy, a strategy based on places
to take a risk.
this gear stuff is gold and i show you how it works. this relation ship between physical price and upper
time frame trending slope.
we know this. at the third point in a trend we can get 3 different things!
the inner slope can increase never reaching the third point, of a trend line.
the third point is slightly crossed... then the move continues.
the market ranges at the third point, with a channel shift. before the market continues.
we all know this can happen at the fourth point also.
when i get time i will work with trend changer to present to you: what we are going to call
(early evidence) on what to expect at the third and fourth points.
this works on all time frames with a 80% probability.
for now i have to go to my mother in laws house and watch foot ball. go Ravines.lol
do not be discouraged nothing has been sent yet. i have been over whelmed with other stuff.
be patient with me. i actually am spending time taking a hard look at what have done in the past
back testing and looking for more clues also. this takes lots of time.
why am i doing this now? because i know most everything is unlocked, but also know there is
something hidden that is going to change the probability to 100% i am sure of it!
and i want to find it!
my upload pics is very full
folder is so full
youtube code --- v=dMmNq-gnKZ8
note the date and it talks about history , not really predicting the future with statistics probability