You are missing trading opportunities:
- Free trading apps
- Over 8,000 signals for copying
- Economic news for exploring financial markets
Registration
Log in
You agree to website policy and terms of use
If you do not have an account, please register
Wow
my platform is frozen and my broker says someone is changed my records in my account, now
they are blocking all transactions until i jump through some hoops. new platform prof. of I.D.
etc. this is crazy. so i will be down for some time.
look for the high two trap over the daily pin bar close for a short trade opportunity.
on this one the up momentum is strong so the traps are strong at the tops usually.
so play this one like this: if we get a high one, and the market comes back to where it is now.
and that high one is reasonably small range look for the high two.
treat that second up move as its own trend then look for the reversal of that second high trend
then enter short.
good luck.
my platform is frozen and my broker says someone is changed my records in my account, now
they are blocking all transactions until i jump through some hoops. new platform prof. of I.D.
etc. this is crazy. so i will be down for some time.
look for the high two trap over the daily pin bar close for a short trade opportunity.
on this one the up momentum is strong so the traps are strong at the tops usually.
so play this one like this: if we get a high one, and the market comes back to where it is now.
and that high one is reasonably small range look for the high two.
treat that second up move as its own trend then look for the reversal of that second high trend
then enter short.
good luck.Boe,
Hope you solve your pc and platform problems.
Today I have 2 areas-that may agree with your idea of high 1 and high2- for potential end of move.
AREA 1:1.3144/46...Center line of Mogalef H1+MP projection...Actual price as I write this is 1.31275 so we are very near.
AREA 2: 1.3228 Mogalef upper level at 4 consecutive timeframes M1 to M30
In case of strong move down,I have support at 1.3022/28 which encompasses both the lower band for all Mogalefs M1 to H1 and a long term Market Profile key point.
Let´s see if we can use the trendlines to finetune/confirm or reject this view
Regards
S
Boe,
Hope you solve your pc and platform problems.
Today I have 2 areas-that may agree with your idea of high 1 and high2- for potential end of move.
AREA 1:1.3144/46...Center line of Mogalef H1+MP projection...Actual price as I write this is 1.31275 so we are very near.
AREA 2: 1.3228 Mogalef upper level at 4 consecutive timeframes M1 to M30
In case of strong move down,I have support at 1.3022/28 which encompasses both the lower band for all Mogalefs M1 to H1 and a long term Market Profile key point.
Let´s see if we can use the trendlines to finetune/confirm or reject this view
Regards
SI have a target of 1.3204
Hi All,
Please take a look at the chart
.
The lower TL+the Support line is exactly the same setup as yesterday,in H1 and inverse direction,looks like the triangles with the modified centers may be of better use than the traditional ones...I didn´t catch the setup real time,I missed it absolutely,so,I entered at the retest of the higher TL(white dot in the chart),once the high of the retest bar was taken,this is probably not the best of entries but has an edge ,so,i took it,Entry=1.31674 TP=1.32275 and SL=1.31335, RR is 60 pips vs 34 ...If prices move above 1.3174/76(Today´s area for Highs) I will move SL to breakeven.
Regards
S
Lucky=wrong
I was lucky,my stop was not hit by 0.2 pips +bid ask spread,I am still in the trade,when one is lucky in a trade,one was wrong in the entry and trade management,as I was....Price has rebounded at the 1.31337/350 area 5 times...So,these are my 2 cents:
1-I will probably be stopped out,np with that,this won´t be neither the first nor the last time this happens.
2-If we see prices breaking down trough the 1.31300 area and then rebounding up again,check for a bears trap...We may see a strong upmove to 1.3228+-
3-If prices actually go up,on a M1 chart use the H1 candles,draw the TL from the highs of those 3 candles once the current candle is closed(in 15 minutes),this may give a good perspective of what is happening,with good RR,a breakout may give a good long entry.
I will try to post a chart once the hourly candle closes.
Regards
S
The Charts
Please take a look at the attachment,I added at 1.31500 after the TL BO...Now it is only a question of either SL(1.31335) or TP(1.32275)...The croupier is mixing the cards
S
The Weekend
Please take a look at the attachment,I added at 1.31500 after the TL BO...Now it is only a question of either SL(1.31335) or TP(1.32275)...The croupier is mixing the cards
Because I find this a really interesting discussion I will add my two cents.
Thanks to everyone participating in this thread.
I am currently slowly getting out of buys and getting into sell side - above 3150 actually.
My SL is in the 3250-3320 range.
Reason can be seen on the daily chart:
I am of the conviction that the 3200 is a fairly strong resistance line and that, in "normal" market conditions this will not be taken out at this time.
Fundamentally I am hoping that finally the ECB will reach agreement - if so we may talk again round about 2750-2600 levels. Also, if they do it will be on the weekend/ late Friday night (when the markets are closed - they like doing that.)
On the other side - if there is a country within the EU with the political will they can break the 3200 resistance for a relatively "small" investment at present. If that is the case we will continue the upwards walk for at least another week or so (see 3550-3600 maybe??).
As Simba's chart is pointing out - we are setting up to begin the downwards move... (maybe.)
simba let me help here
i have an old platform to look at until i get my new one. this is an out dated platform
so it has a hard time updating. let me show you what i was looking at before i left for work
this morning.
remember what we talked about when we talked about with trend pin bars. how they can
be traps, for large counter trend swing. or the can be a signal that the market is going
to range , that range being the approximate size of that pin bar. or that pin bar could be
temperately correct. or it could be completely correct. this pin bar came in on the top
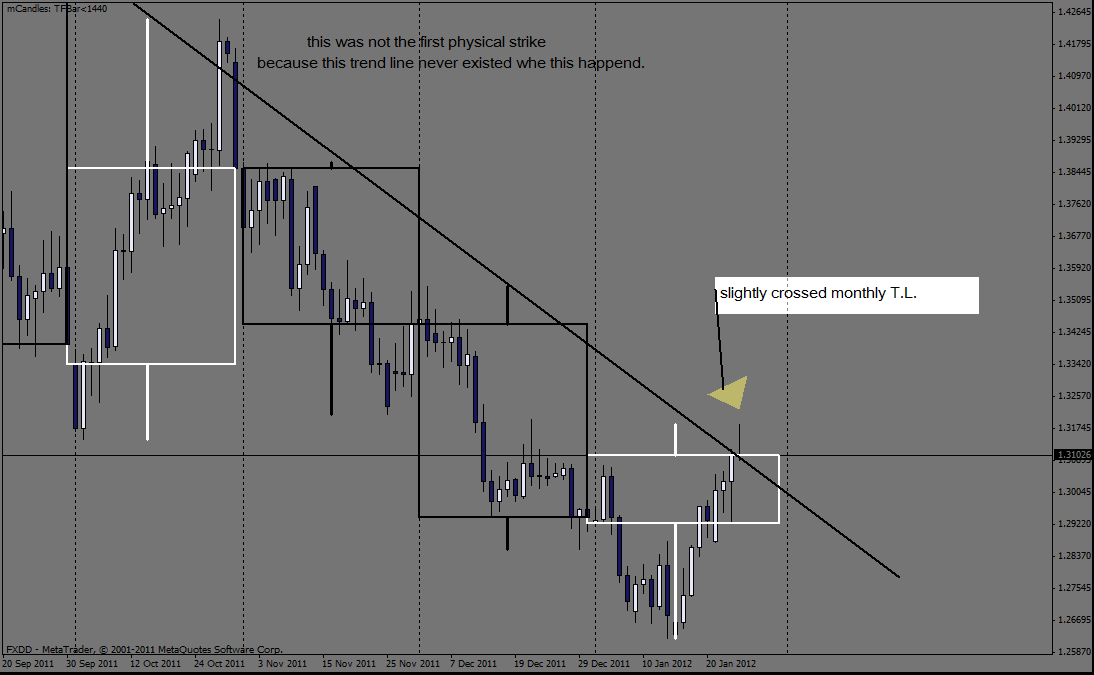
of a steep run up. that run up just barley touched the outer monthly trend line, with physical
price for the first time.
now first you have a first physical strike!
next you have a steep up slope... and as traders you know that this steep slope will not be maintained.
the larger up trend can be maintained just not at such a steep slope for the complete trend.
now you also have the extended up move with a (with trend pin bar). that bar could signal a range!
or it could signal a large counter trend swing.
since this is the first physical strike of the monthly trend line. that means this is a containment
of resistance. until physical price can carry a new monthly candle on the other side of it.
until then this is resistance containment.
so now knowing this is the first physical strike your pin bar automatically become a signal that says
"A PIN BAR TRAP THAT WILL MOST LIKELY RESULT IN A LARGE COUNTER TREND SWING."
NOW ONCE YOU FIGURED THAT OUT AT WHAT PRICE DO YOU WANT TO GET IN AT SHORT?
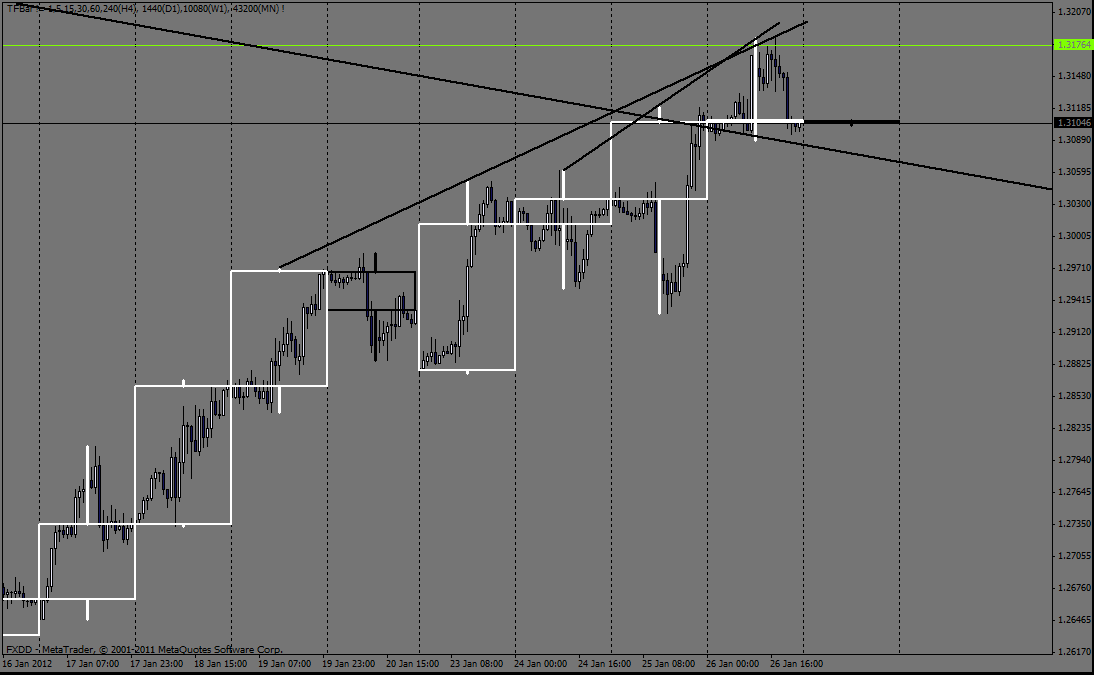
well lets draw some trend line on the target side of the daily time frame. here was my green
entry line. but i said it could be a high two. i was at work when this happened.
if i was not at work, and i had a working trade-able platform besides. where i put the trend lines
in on the target side would have been a good choice.
LETS TAKE A LOOK AT WHAT I HAD ON THE SCREEN LAST KNIGHT.
now after my break i will talk about the psychology of the right side.
i hope this helps. you see the larger picture is like a guide. i always consult my guide before
lowering my frequency.
so i hope that clears things up.
i HAVE TO TAKE A BREAK AND SEND MY FAX. TO MY BROKER. BUT I WANTED TO TALK RIGHT SIDE PSYCHOLOGY, AND STOPS IN THE MARKET.
plotting traders emotions.
now one thing i have not talked about is: plotting traders stops.
not just any traders i want to plot the 5 lot or ten lot traders entries and stops.
why do i do this? i do this because it tells me what the market will do at certain price levels.
how you do this is you apply what all traders are thought, to the charts. think about if it
was you that had 10 lots your ready to trade. what would you do?
you would want to plot a point were it was smart and safe as possible into the market.
so that means you find a smart place, and you find some confirmation with that smart
place on lower freq. that's what new york attorneys who think they can trade put there
trades, they read a few books and then think they can trade.
fund managers and doctors. so called investment professionals. they all pick every book
on the shelf and want to go from being rich to getting wealthy.
next post i show you what they learn and how to use that to be accurate on a great
momentum trade.
now some one mentioned
now some one mentioned economic data!
ok lets say the economic. data for eur. is good. this even more powerful.
what they want to see is a third point on the daily trend line in combination
with a approx. 50% pullback on the daily pin bar! then as confirmation they
want to see a lower frequency trending candle close strong off that point
where they wanted to enter.
that's what they want to see for an entry decision. they want it safe as possible
so they do things like: wait for the lower freq. confirmation signal to close.
then wait for an inside pull back of that candle then they place there trades
above the high of the signal. but not just the high, there smart so they place
the trade above the new high.
the high two trap!!!!!!!!!!!!!!!!!!!!!!!!!!!!!!!!!!!!!!!!!!! there you go.
now lets look at the chart and i will show you what to expect and where to enter
the down explosion next.