You are missing trading opportunities:
- Free trading apps
- Over 8,000 signals for copying
- Economic news for exploring financial markets
Registration
Log in
You agree to website policy and terms of use
If you do not have an account, please register
look its late
it's late and i got interrupted for awhile tomorrow those who were a sleep in trading
will be awakens. i promise you that.
preview post
preview post of the chart.
I commend you boe, you seemed to have found a new way to see candle sticks.. In a way not even Steve Nison or the actual founder Munehisa Homna saw them.
I thought i had been a bit unfair on Boe so decided to read the whole thread from back to front, some parts i was so amazed at just the utter non sense going on here. i have attached a picture from the 2nd page quoting" Adverstised closing: is when the market closes so close to the trend line that the ONLY place it can open is on the other side on the TL".. " so the next candle has no choice but to open on the other side"
This is just utter complete garbage...Boe, the market often gaps, alot more than people will notice as its often just a few ticks, as i am not talking about big gaps most see on market open/close or news events..
Candles frequently open away from the previous close infact any where along the body or wick, and any one of you that would of taken the time to read any book on candle stick analysis would know..They do not have to open where it closed, period..
So to say that it, quote " has no option but to only open on the other side of the TL" is just sheer fabrication just pure non sense...end of..
see pic attached..
philt thank you
i feel really bad about what i said to you i apologies.
i will explain this chart and others as soon as i can there is a lot going on at home tonight.
philt i will prove it to you
philt i will back up and prove it to you.
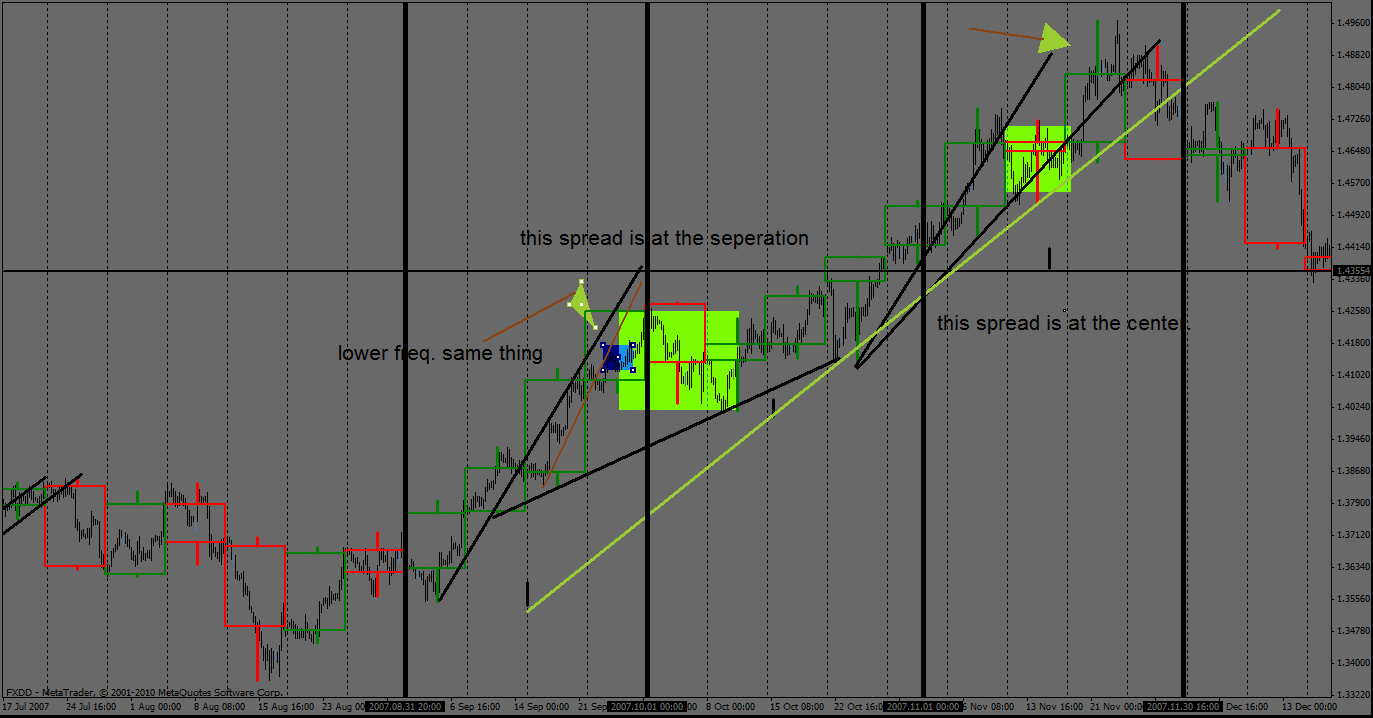
This is live chart
a trend line it has to open on the other side. A weekly gap to stay inside the trend line
would have to be massive, i have only seen a gap large enough to effect this once.
And sense we are using this for analysis why would you be lower then the weekly?
So when we learn about trading we want to filter out rare occasion and stick with
the ones that happen consistently. Does this hep you? You can back test trend line far
into history you may find maybe one instance but no more.
Advartised closes
Advertised closes can alert you to a continuation of range!
At the (emotional third point) in a trend it can alert you to slight trend line crossing
that happens often at this point, then physical price and the over lay candle re- enter
threw the crossed line. This alerts you on the outer slop. In this manner.
An advertised close on the inner slop trend line advertised closes alert you to counter
trend to build the outer slope.
In small range trends their is little to know major counter trends, so all advertised closes
alert you to slight crossing with continuation.
Once in a while the emotional point is the forth point in trend.
The most common is at point three. This point more times then not is the point of slight
crossing and then continuation.
Example.
Example. Her of emotional point 3[attach=config]131905[/attach]
Example. Her of emotional point 3[attach=config]131905[/attach]
Ok...thanks for your replies Boe....
So are you a trader or an analyst? Or both. So with this strategy you have shown. As you a trader you will be looking for buy and sell signals, entries exits, profit objectives, targets, something to give your risk/reward..
As an analyst you will be looking for some kind of forecast to project where the Market is likely to go, targets etc...
because at the Moment I am failing to see the relevance of your charts in regard to making trades....they just look like you are drawing the trend lines to suit what you say.. We can all go back over historic data and draw trend lines, Elliott wave counts, patterns what ever, but what about on the hard right edge of your charts..
Show me a chart of aud/usd and show me as of now what is going on according to your analysis..