EMA-4-MTF-Strategy
but , how do you make a 10 sec timeframe-- almost like bet on tick chart
and in august and these days, it move slow
how about if it move FAST with breakout -- will this strategy, risk of losing big -- in normal day
10.-sec.-Strategy - results
Oanda Demo Account 205153
Deposit: 100'000.-$
date 2009-sept.-03 / result: 614.87 $
Oanda Demo Account 205153
Deposit: 100'000.-$
September 3 15:40:22 2009 EDT / Account: 102,094.97 / Result: + 2'094.97 $ 
but , how do you make a 10 sec timeframe-- almost like bet on tick chart
You have it only on Oanda.
Perhaps s.o. could code it for MT4, I don't know.
and in august and these days, it move slow
It can be an advantage for you!
how about if it move FAST with breakout -- will this strategy, risk of losing big -- in normal day
Lightning breaktouts arising from nothingness are extremely dangerous for 10-sec.-Strategy. In these singular situations you lose money, when you don't whip out your trade.
hi
ur system can we use it on 1min TF did u ever try it
I haven't give it a shot on 1 min TF. When you see this strategy on 1 min TF it might be possible with a pinch of salt in highly narrow trending channels.
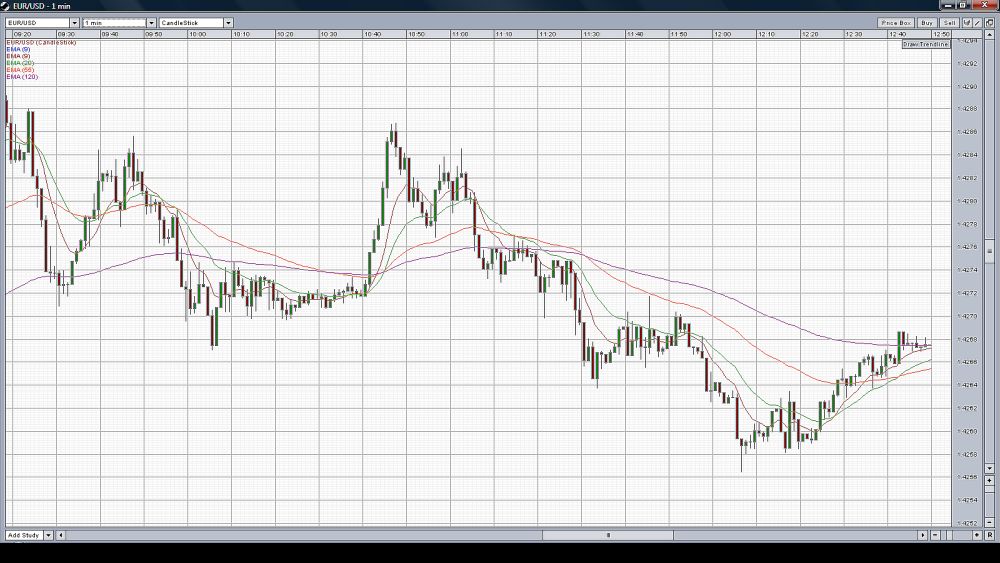
 But when you would deal the system with 1 min., it would be possibly even looking at 5 min and 15 min time frames at once, monitoring the more global trend.
see attachment: Chart EUR/USD 1 min
i.e. only computer can trade that fast
if you use any manual thinking system, you will loss (much higher probability -- not to mention , broker make more of your money by getting bigger spread or unfavor rate during fast movement)
10-sec.-Strategy
10-sec.-Strategy is trading sometimes extremely fast. - so it woudn't be the same with 1 min or 5 min TF's.
On live accoun it's not possible to make 10s trade.
- Free trading apps
- Over 8,000 signals for copying
- Economic news for exploring financial markets
You agree to website policy and terms of use
EMA-4-MTF-Strategy
Timeframe: 10 sec, 30 sec., 1 min, 5 min, 15 min, 30 min, 1h, 3h, 4h, 1 day, 1 week
Currencies: all
Exception to the rule: 10 sec TF - only EUR/USD - (then: Spreads not more than 1.5)
Indicators: EMA: 9, 20, 55, 120
Enter/Exit: when bars crosses EMA 9
Hold: when EMA 9 20 (bullish)
Updated:
Commencement of risk: 2009 September 08 Demo Account (100'000.- $)
Account Number: 224845 (USD)
Depot at 2009 oct. 01 - TOTAL: + 141'168.66 $
Profit since 2009 sept. 08 - Oct. 01-2009 - Profit: + 41'168.66 $
see attachment
Updated:
Commencement of risk: 2009 October 21 Demo MT4 Account (25'000.- $)
Account No.: 1202207 (USD)
Depot at 2009 oct. 23 - TOTAL: + 29'729.95 $
Profit since 2009 oct. 21 - Oct. 23-2009 - Profit: + 4'729.95 $
see attachment or #11
e.g.
GBPJPY M1, M5, H1 2009 oct. 11
Price data can change very much from every day and still conceal if the price is growing or decreasing. You see even a more general picture if you watch the price moving averages on higher time frames.
Label:
E = Entry (In) (might be SHORT or LONG)
O = Out (Exit)
Preferred:
Bars crosses EMA 9 for Entry (or with EMA9/20 crossover). Out could be with EMA9/20 intersection.
The "O?" markers stands for EXIT when you think pips are enough at this point.