Indicators: Setka (grid)
A few pictures explaining the work of the indicator
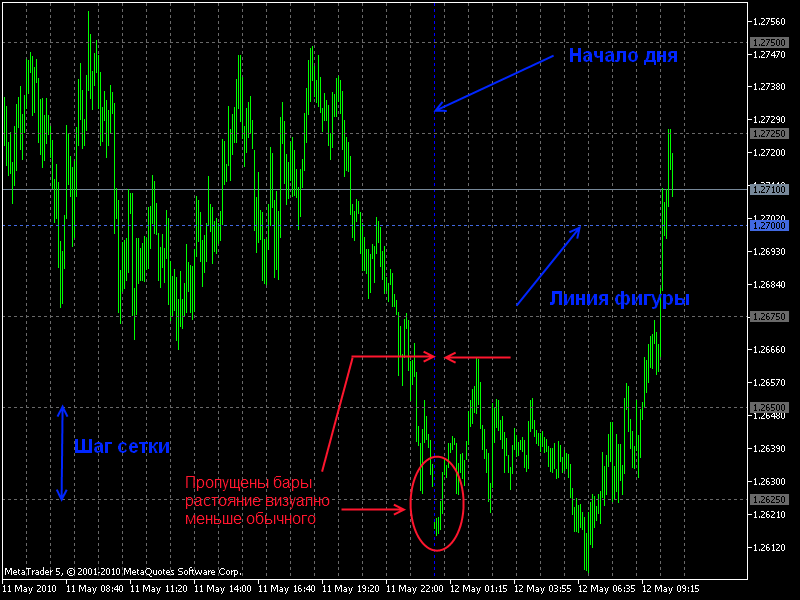
Here you can see how to quickly see that there are missed bars.
One of the many ways of analysing (using the "indicator")
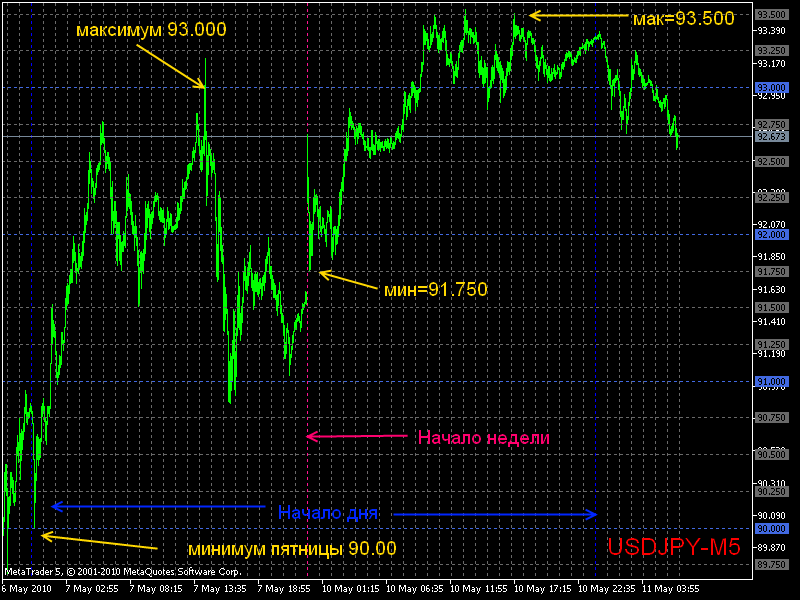
We opened the chart on Monday. We start to analyse and build a trading plan.
- Determined the high of 93.00 and the low of 90.0 on Friday. Please note that I consider this figure as the maximum. If you move your mouse to the vertical line next to it, you will see that this peak occurred at 14:30 (news).
- Let's determine where the big buyers (sellers) were. A powerful buyer entered at the level of 90.0, the crowd caught up in 1 hour to the level of 91.5. A seller appeared there. Quotes went down to 91.0. From the level of 91.0 again a buyer (maybe the old one was added) reached 92.0 fixation of a part of profit went down to 91.750 (no powerful sellers) broke through the level of 92.0 went further. A powerful seller appeared at 92.750. Both times when reaching this level there were sales. It was dismantled on the news (maximum of the day). Analyse the rest of the day yourself.
- As a result of the analysis we get some analogue of the market profile(https://www.mql5.com/en/articles/17 ). Only it was built not by an automatic machine, but by us, more perfect. You will see the beginning of work of exchanges, they usually start working at the beginning of the hour(https://www.mql5.com/en/articles/59). By the characteristic movement at the beginning of the hour, you can sometimes determine the possible further movement "long and short table" etc.
- Monday morning what we have determined. Directional move up + gap up added confidence that we are going there. There are big buyers in the market, but the big seller is tight. Key levels are 91.750, 92.000, 92.750 and 93.0.
- I understand your scepticism, history is all good. I just want to show you what you already know (the magic of round numbers, there are many books about it). Just for this you need a point of reference (a stove from which to dance). The grid fulfils this role of a stove. And you can see a lot. Here's one more thing. At 3:30 the bulls hit 92.750 with one horn, but could not break through. Then during 4 hours no big seller appeared, we can say that the pattern of a bowl was drawn (for me it's a saucer at least, the main thing is to see that the buyers started to outweigh). And 8:00 went on the attack (the beginning of the hour, the beginning of the stock exchange work, the day before we moved up, today we are going up, gap up, add some oscillator and I think you will come to the conclusion whether this level will be broken or not.
- The triple top is at 93.50. Usually the pair goes through a figure a day, maximum 1.5. That's where it got stuck. There will be tomorrow, there will be a market, we'll think. You can't make all the money. The bulls got two horns broken, usually the third horn doesn't grow. We can enter the sale with a small stop and TP of about 25 pips.
I hope that someone will see here useful for his trading and help to make this "indicator" better. I will be glad if you find mistakes and help to correct them. The goal is to draw it quickly and correctly without loading the machine.
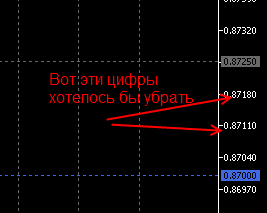
I have not yet managed to solve how to remove the numbers.
Z.y. good luck with your work
It is not recommended to make screenshots larger than 750x500 pixels, as large canvases are automatically compressed on the site side.
I understand if you really need a lot of space, but your screenshots have a lot of free space, so why such large sizes?
It is not recommended to make screenshots larger than 750x500 pixels, as large canvases are automatically compressed on the site side.
I understand if you really need a lot of space, but your screenshots have a lot of free space, so why such large sizes?
I don't know how to make such sizes. If you use the Print Screen button, then there the sizes will be huge. And if you select the "Save picture as..." menu on the chart, then there are 800*600. I worked with these drawings and pasted them here.
I realise they're the defaults. It turns out they can be adjusted. Make the defaults correct. I'm probably not the only one
I realise it's the default. It's customisable. Make the defaults right. I'm probably not the only one
looking and thinking for a long time.
thinking and looking.
I think you're all familiar with my radical views!!!
And I'll tell you, there is salt! And the salt is in the crystals!
I've been looking and thinking for a long time
thinking and looking.
I think you're all familiar with my radical views.
And I'll tell you, there is salt! And the salt is in the crystals!
The crystals are small, you can't see them. maybe I'm looking in the wrong place. Explain.
Here is the version with corrections.
Thank you very much for helping to realise the idea correctly and fixing the code.
I hope this is the final version, it works great now.
I'm posting version 3.05 here for now. I'll post it in Code Base later. I need to see how it works when the quotes are running.
- Free trading apps
- Over 8,000 signals for copying
- Economic news for exploring financial markets
You agree to website policy and terms of use
Setka (grid):
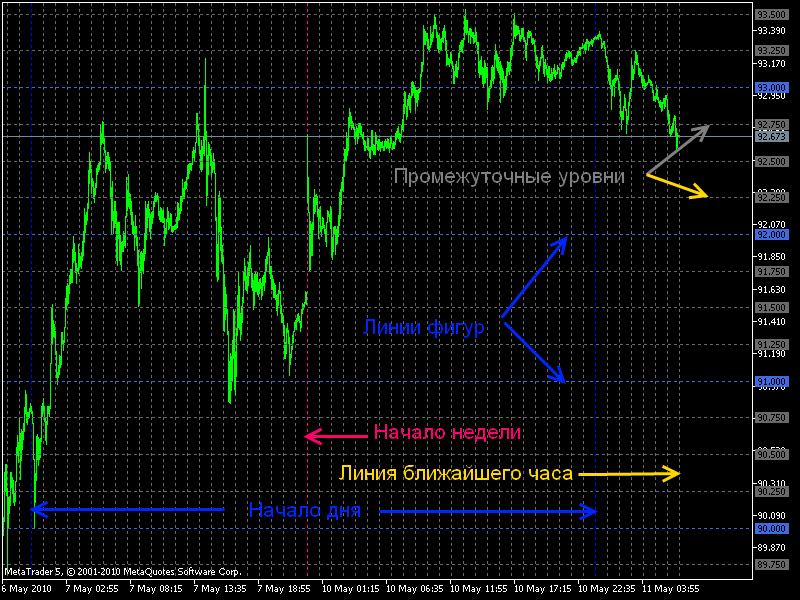
This indicator will help you to determine quickly the starting and ending of the day (week, month), to see the maximal and minimal prices of the period (and determine them more accurately), the magnitude and direction of the movement for the period, the important levels (figure), the exchanges starting time, the news publication times etc.
Try this indicator, I think it will be very useful. The MQL5 language allows to implement more functions, that was impossible in MQL4 (see https://www.mql5.com/ru/code/8684 ).Author: Prival