Join our fan page
- Views:
- 26219
- Rating:
- Published:
- 2009.11.10 13:16
- Updated:
- 2016.11.22 07:32
-
 You are missing trading opportunities:
- Free trading apps
- Over 8,000 signals for copying
- Economic news for exploring financial markets
Registration Log inYou agree to website policy and terms of use
If you do not have an account, please register -
 Need a robot or indicator based on this code? Order it on Freelance
Go to Freelance
Need a robot or indicator based on this code? Order it on Freelance
Go to Freelance
Author:
Urain
Indicator shows vertical lines at last week bar.
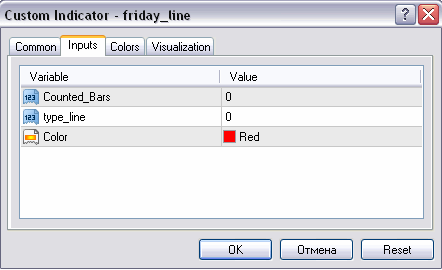
Parameters:
Counted_Bars - number of bars in the calculation, 0 means all bars.
type_line - line type.
Color - line color.
Indicator runs once, to run again make reinitialization.
It deletes only its own lines, the lines are names using the bar dates.
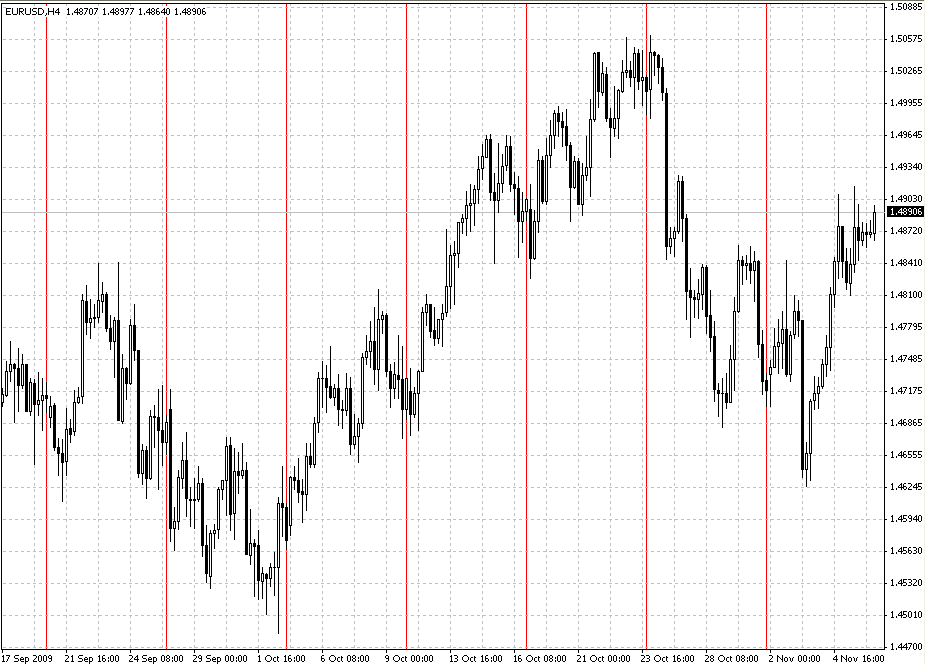
Fig 1. Friday_Line Indicator shows weeks separated by vertical lines, EURUSD, H4
Translated from Russian by MetaQuotes Ltd.
Original code: https://www.mql5.com/ru/code/9303
 Indicator for Stop Loss levels calculation using Bill Williams technique
It calculates and shows Stop Loss levels (for Buy and Sell positions) using the method described by Bill Williams in his book "Trading Chaos". A new feature has added: now all it can be analysed in history.
Trend Indicator for several timeframes
It shows a trend table for a several timeframes in the bottom left corner of the chart.
Time, Forex sessions and Trade Hours monitor
Indicator shows a different Forex sessions and the market hours of the exchanges.
Informer
Indicator shows entry and exit points for all deals and account statistics on the chart. It is very useful for trade analysis.