Join our fan page
- Views:
- 11984
- Rating:
- Published:
- 2010.01.26 11:17
- Updated:
- 2016.11.22 07:32
-
Need a robot or indicator based on this code? Order it on Freelance Go to Freelance
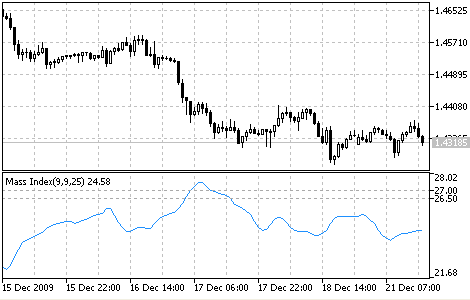
The Mass Index is developed to catch the trend reversal points. The mass index was created by Donald Dorcy. In case the movement is considerable the Mass Index goes up, otherwise if it is slight the Mass Index goes down. The daily prices movements are used for this purpose.
According to D.Dorcy, the most important mass index signal is a special model formed by the indicator. It is called "reversal bulge". It is formed when a 25-period mass index first rises above 27 and then falls below 26,5. In this case a turn of prices can take place, independently of the general trend (the prices may move up or down or fluctuate within a trade corridor).
To find out which signal - for buy or for sell - the reverse bulge gives, people often use 9-period exponential moving average of prices. When a reverse bulge appears, you should buy if the moving average falls (in hope of a turn) and sell if it grows.

Mass Index indicator
Calculation:
where:
- SUM - means a sum;
- HIGH - the maximum price of the current bar;
- LOW - the minimum price of the current bar;
- EMA - the exponential moving average;
- N - the period of the indicator (the number of values added).
Translated from Russian by MetaQuotes Ltd.
Original code: https://www.mql5.com/ru/code/37
 ColorCandlesDaily
The ColorCandlesDaily indicator draws candles with different colors depending on the day of the week.
 Market Facilitation Index (BW MFI)
The Market Facilitation Index (BW MFI) is the indicator which shows the change of price for one tick.
 Money Flow Index (MFI)
The Money Flow Index (MFI) is the technical indicator, which indicates the rate at which money is invested into a security and then withdrawn from it.
 Momentum
The Momentum Technical Indicator measures the amount that a security’s price has changed over a given time period.