Join our fan page
- Views:
- 6501
- Rating:
- Published:
- 2011.04.11 15:30
- Updated:
- 2016.11.22 07:32
-
Need a robot or indicator based on this code? Order it on Freelance Go to Freelance
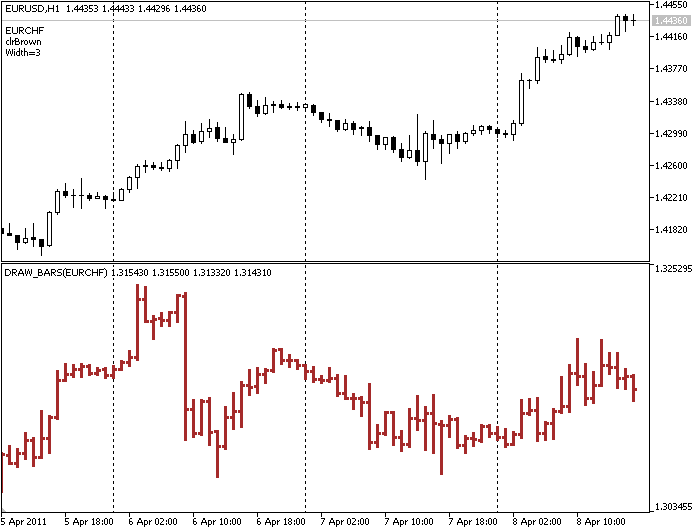
The indicator plots the bars of the specified symbol in the separate window.
The DRAW_BARS drawing style is used to plot the bars using the values of 4 indicator buffers with Open, High, Low and Close prices. The bars color and width changed after N ticks. The N variable is defined as input parameter, it can be changed using the "Properties" window.
Note that initial properties of the plot1 graphic plot (DRAW_BARS) are defined using the #property preprocessor directive, further these properties changed randomly (OnCalculate() function).
See also: The Drawing Styles in MQL5.

Translated from Russian by MetaQuotes Ltd.
Original code: https://www.mql5.com/ru/code/337
 DRAW_FILLING
The DRAW_FILLING drawing style plots the filled area between the values of two indicator buffers. In fact, it plots two lines and fills the area between them with the specified color.
 DRAW_CANDLES
The DRAW_CANDLES drawing style plots the candles using the values of 4 indicator buffers with Open, High, Low and Close prices.
 DRAW_ZIGZAG
The DRAW_ZIGZAG drawing style allow to draw sections using the values of two indicator buffers. It looks like DRAW_SECTION, but it allows to draw vertical sections inside one bar.
 DRAW_ARROW
The DRAW_ARROW drawing style plots the arrows (chars).