Important Information:
What sets my advisor apart from others in the market?
- Dear users, I've identified a pattern indicating that the use of neural networks and artificial intelligence leads advisors to impressive test results, but these results often prove effective only in the short term in live trading. I set out to develop a strategy that stands the test of time. Drawing inspiration from time-proven strategies like level breakthroughs, news trading, price action, and more, I compiled data from various approaches. I integrated the fundamental elements into my SSX Titan EA advisor.
- While the initial test results weren't overly impressive, I remained confident that I was on the right path. Through extensive optimization and continual refinement, I gradually enhanced the advisor's performance. As I incorporated more indicators, including some personally developed ones, I achieved greater stability. Eventually, I discovered the optimal settings that delivered astonishing results.
- Let me be upfront—I'm not claiming to generate billions in test results like some users out there, but I firmly believe that my results are outstanding. In summary, I've highlighted the distinctive features of my advisor compared to others.

WHAT LEVEL BREAKOUT TRADING IS BASED ON
Breakout trading is an approach in which a trader focuses on price movements through key support or resistance levels. The strategy is based on the assumption that if the price breaks through a support or resistance level, there is a possibility that the price will continue moving in the same direction.
Level building can be quite subjective. Different guidelines are used for this:
- previous extremum points;
- psychological meanings of prices;
- patterns of technical analysis;
indicator values (for example, high volume levels on the market profile).
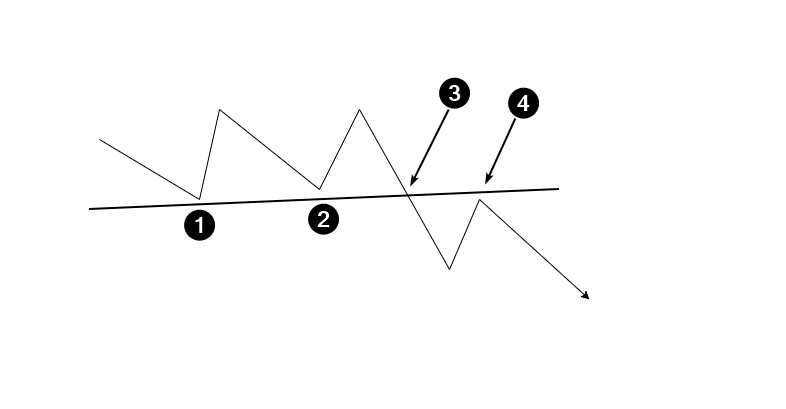
Levels can be inclined and horizontal, they can use a different number of guidelines. In general, trading on a breakout of a support level looks like this:

IDEA OF THE PATTERN
The idea of a breakout is to disrupt the balance of supply and demand.
Suppose that in the market, the forces of buyers and sellers were balancing each other out for a period of time. At the same time, the price was forming a trading range (was flat). The boundaries of a formed range (or a technical analysis pattern) usually define support and resistance levels.
Let’s continue to develop the hypothesis. Under the influence of some negative factors, buyers weakened, sellers became more active, and the price began to fall. At the same time, there was a breakout of the support line — market participants reached a consensus that the price for the asset is too high, and the fair price is lower. At this moment, sellers become very active, which leads to a breakout.
HOW TO IDENTIFY A BREAKOUT USING VOLUME INDICATORS
Experienced traders may notice that:
- when the price is about to break through a level, the trading volume usually increases as it approaches that level;
- before a true breakout occurs, there is usually a false breakout (a deceptive maneuver) in the opposite direction;
- breakouts occur rapidly, leaving little time for traders to analyze and enter a position at a bargain price. Moreover, opening a trade in the direction of a breakout, a trader may feel emotional discomfort due to the potential of buying at a high price or selling at a low one.
How to confirm a breakout to trade more confidently?
Look for clear evidence of one party’s dominance over the other. It can be found using advanced volume analysis indicators of the ATAS platform. For example:
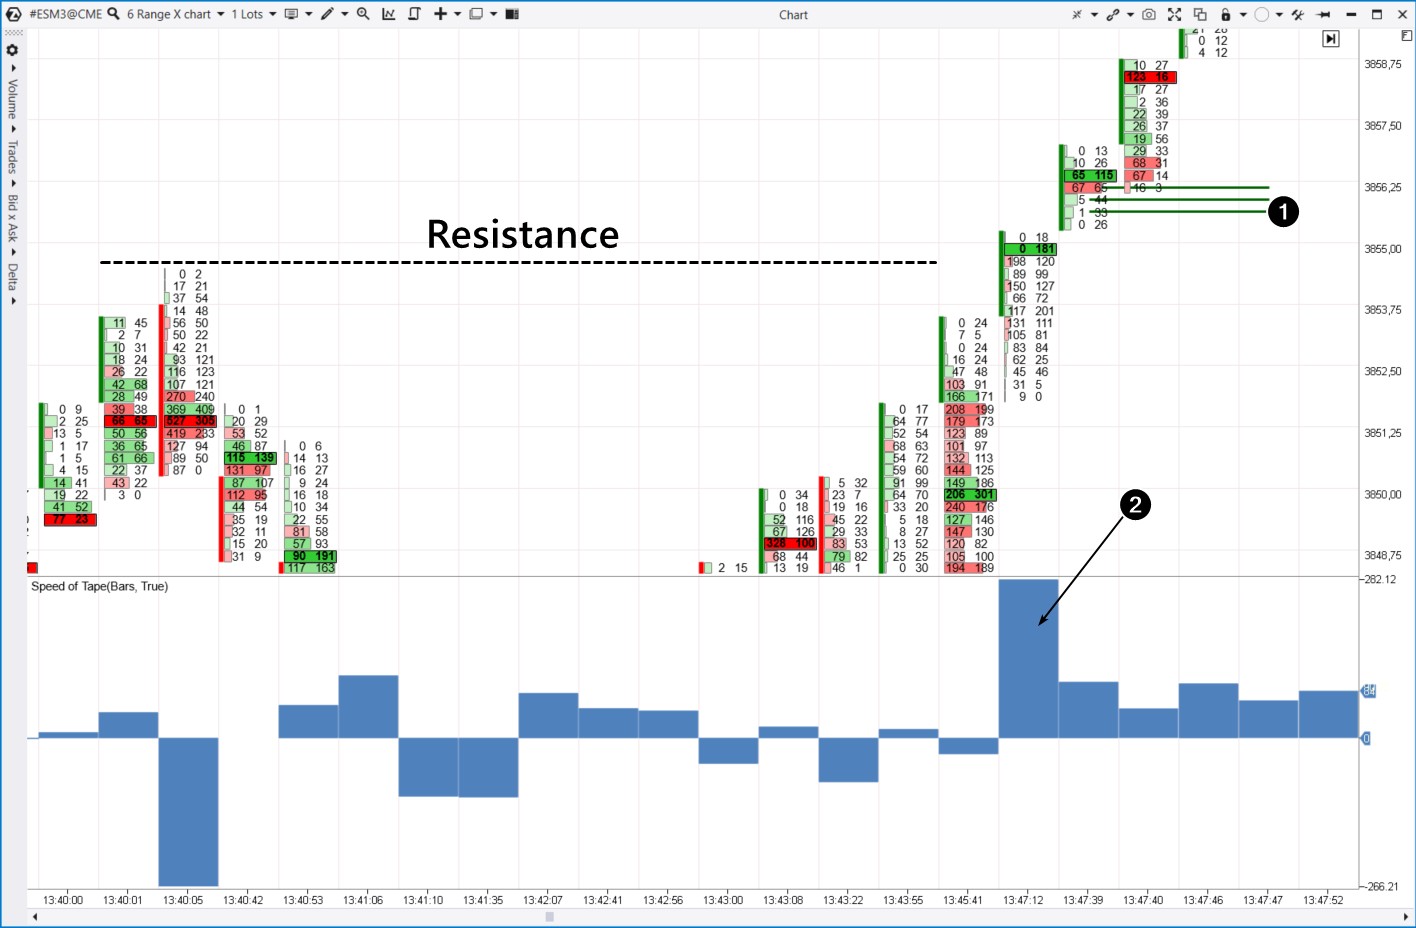
- Stacked Imbalances shows the dominance (imbalance) of one of the parties by analyzing several price values in a row. The imbalance usually occurs in the breakout area. This indicator can also be used for money management, as will be shown below.
- Speed of Tape in delta mode will give evidence of increasing pressure of one of the parties over time.
The cluster chart below illustrates a breakout of the resistance level.

I've only scratched the surface of the strategies employed by SSX Titan EA. I can't reveal all the trading secrets or share my trading indicators for free, and I believe you understand why. I'd like to offer my advisor to those who are truly ready to trade, patiently waiting for trades instead of banging their heads against the screen when the advisor doesn't trade for two days. Thorough trade analysis takes time, and that's why the advisor can't trade every day like many others on the website. But after all, we're here to trade, not play roulette.
I'm allocating only 50 copies of the advisor at the initial price of $399. Naturally, the price will increase for various reasons—competition, the product's quality, and its exclusivity. Thank you for your attention, and let's trade together with SSX Titan EA.


